
Downloads
IFS Report R270 Tax and public finances the fundamentals
PDF | 902.12 KB
This report highlights 10 key facts related to taxes and the public finances that will underlie the fiscal policy challenges and choices faced by citizens and governments in coming decades. It is part of the ‘UK 2040: Options’ project, which is exploring policy options to improve outcomes for children born today and reaching adulthood around 2040.
Looking across the next 20 years, there will be important and difficult choices over both the level of taxation and the design of different taxes. Both will affect the type of society we live in.
Fundamental facts
1. Tax revenue is 37% of national income (the highest level seen in the UK since the 1940s) and rising. Maintaining government services in the face of an ageing population, increasing health and social care costs, and the costs associated with responding to climate change would require taxes to increase further in coming decades.
2. UK public debt – as measured for the purpose of fiscal rules – is currently around 90% of national income. Future governments would need to run a primary surplus – meaning raising revenues higher than non-interest spending – simply to stop debt rising further.
3. Tax rates are much lower on capital incomes than on labour incomes. This distorts the labour market (away from employment and towards self-employment). It is horizontally inequitable because similar people face very different tax bills.
4. Income tax has been made more complex since 2010. A freeze in thresholds will see the share of adults paying income tax reach a level not seen since at least the early 1990s and the share paying higher rates reach an all-time high. These important changes are being determined by the rate of inflation, rather than by active policy choice.
5. VAT zero rates and exemptions cost £100 billion in forgone revenue. They place a large compliance burden on firms and are a very poorly targeted way to redistribute income to lower-income households.
6. There is a clear intergenerational divide in wealth. The returns to wealth tend to be undertaxed relative to labour income and, in some cases (including the capital gains made on main homes), are completely untaxed.
7. Council tax is regressive. In England and Scotland, it is based on values that are over 30 years out of date. Tax bills bear increasingly little relation to the actual value of the houses we live in. Stamp duty hinders people from moving house.
8. The long-run trend towards cutting the UK corporation tax rate while broadening the tax base has been sharply reversed in recent years. There is ongoing uncertainty over the plan for investment allowances. This uncertainty will hamper business investment, which is already weak by international standards.
9. In recent decades, governments have added a series of new taxes explicitly aimed at changing behaviour. Such taxes must be designed with care.
10. Tax rates on greenhouse gas emissions vary wildly, including by the source of the emissions and the type of end user. This makes reducing carbon emissions more costly than it needs to be.
The big-picture choices over how much to tax and spend will be difficult in large part because of poor economic growth and growing spending pressures. The public finances are easier to manage when economic growth is strong; it is easier for governments to improve services when the whole country is getting richer and it is easier to manage the stock of (nominal) debt when the economy grows faster than the rate of interest on government debt. But over the last decade, economic growth has been historically weak, and forecasts expect it to remain so. In most post-war years, UK governments could afford for revenue to fall below the level of non-interest spending and still see debt falling as a share of national income. No longer. High public sector debt, in conjunction with weak economic growth and high interest rates, means the next government would need to run a primary surplus simply to stop debt rising. That is, it would need to raise more in revenue than is spent on public services and benefits (excluding spending on debt interest). This will be a major constraint on fiscal policy at a time when there are major spending pressures. Many areas of public spending are already under strain after a decade of austerity, since the pandemic hit and in the face of high inflation; industrial action over pay awards is just one indication of this. Spending pressures will grow, most notably because the share of the population that is over the state pension age is about to start rising for the first time in 50 years. Spending would need to rise simply to provide the same health services and state pensions to an ageing population. The planned move to net zero, meanwhile, will bring further costs.
UK taxes are already high by historical UK standards, although not when compared with the rest of Western Europe. It is not inevitable that taxes will rise – UK voters have a choice. But the choice is harder than it has been for decades. Without tax rises, UK public service and benefits provision will not simply tread water, it will deteriorate. Unless levels of tax increase substantially, a reduction in the scope of the public services that the British state provides is likely inevitable. Unless something major changes – such as an acceleration in economic growth – it will not be possible to maintain public services and keep tax at current levels. The choices that face future governments are not enviable.
Figure 1. Composition of UK tax revenue, 2023–24 forecast
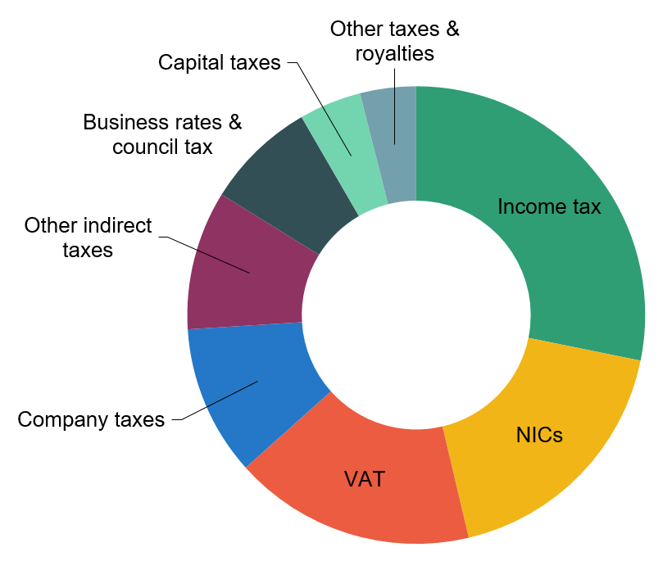
Note: ‘Company taxes’ are corporation tax, energy profits levy, apprenticeship levy, electricity generator levy, bank levy, digital services tax, diverted profits tax and petroleum revenue tax. ‘Other indirect taxes’ are fuel, alcohol, betting and gaming, and tobacco duties, environmental levies (including Emissions Trading Scheme auction receipts), vehicle excise duty, insurance premium tax, customs duties, air passenger duty, landfill tax, aggregates levy and soft drinks industry levy. ‘Capital taxes’ are stamp duties, capital gains tax and inheritance tax. ‘Other taxes’ are VAT refunds, licence fee receipts and other small taxes.
Source: Office for Budget Responsibility, 2023d.
The choice over how much to raise in tax should – and no doubt will – be the subject of public debate. But it is no less important that we debate the choices over how revenue is raised. This is not simply a question of how much we get from different taxes (shown in Figure 1). Rather, it is a question of how those taxes are designed. The 10 key facts that we have highlighted (see the ‘Fundamental facts’ box) reflect that almost all taxes have major design flaws and significant scope for improvement. If the opportunity is taken, those improvements could go a long way to reducing the economic pain that a higher overall level of tax would entail. While there are specific choices and challenges for each tax, the problems caused by poor tax design fall into three broad types.
First, various taxes distort the choices of people and firms in ways that are unjustified (in the sense that the distortions are not necessary to achieve government aims, such as redistribution). For example: high marginal tax rates caused by ‘humps’ in income tax reduce work incentives (by more than is necessary to achieve redistribution); preferential tax rates on business incomes discourage employment (relative to self-employment); large-scale carve-outs within VAT create heavy compliance burdens; corporation tax both discourages some profitable investments and subsidises some unprofitable ones; and stamp duty prevents some people from moving house to, for example, take a better job. Such distortions can mean that less work is done, investment is lower and/or resources are not being allocated to their most efficient uses. Ultimately, inefficient tax design is an unnecessary drag on productivity.
Second, many parts of the tax system are unfair. This is not a statement about vertical redistribution, about which there is reasonable disagreement. Parts of the tax system currently treat very similar people in very different ways that are hard to justify. Two people living in houses that are worth the same amount today can face very different council tax bills if their houses happen to have been worth different amounts in 1991 (the year on which council tax valuations in England and Scotland are based). And two people earning the same income by doing the same work can face very different tax bills if one is an employee and the other is self-employed. Taxes are currently also reinforcing inequalities arising from the fact that different generations have experienced very different economic conditions. Notably, large capital gains on main homes – many of them the result of luck – have been central to a growing intergenerational divide in wealth and are completely untaxed.
Third, some parts of the tax system are not well designed to achieve policy aims. Taxes are, of course, not only used to raise revenue or (alongside the benefit system) to redistribute income. Governments have also long used tax with the explicit aim of changing behaviour. In fact, in recent decades, governments have been introducing new ways to do this. Most notably, there are now various parts of the tax system, including a large number of environmental levies, that are aimed at reducing greenhouse gas emissions. The tax system should play a key role in helping the UK transition to net zero. However, the combined effect of the various government policies is an uneven set of incentives that will make achieving net zero more costly than it needs to be.
There is nothing inevitable about the tax system we currently have or the problems it creates. It can be challenging to design taxes and, in some cases, there are trade-offs between different goals. But much is known about how to reform taxes in ways that would make the system more effective, efficient and equitable.
The main challenges are likely to be political. Many of the needed reforms would be large. There would be losers, as well as winners. The potential losers are often a more concentrated and better-organised group than those who are losing out from the current system. In addition, there is often a public misunderstanding about why the tax system is the way it is and which features are justified. For example, over 80% of the UK’s workforce are employees. They lose out from a system that gives tax breaks to the self-employed. If taxes were the same for both groups, overall spending could be higher or taxes on employment lower. Despite this, most employees do not think of themselves as losers from this system. In addition, there is widespread belief that lower tax rates on the self-employed are justified by lower government benefits for that group – this is not the case. Philip Hammond, when Chancellor, tried to implement a small increase to National Insurance contributions of the self-employed in Budget 2017; he U-turned after fierce opposition.
Despite the political difficulties of reforming taxes, governments do face a choice; not seeking to address the problems with the design of the tax system is a choice to live with those problems.
Governments should take this choice seriously. The design of the tax system matters hugely. Reforms in the areas we highlight would be worthwhile even if taxes were being cut overall. But the shape of the tax system matters even more when spending demands are placing upward pressure on the overall level of tax.
There are no silver bullets here. But better-designed taxes could bring real benefits, including by supporting higher economic growth and facilitating the move to net zero. Tax could and should be part of the solution to future challenges rather than part of the problem.
1. Tax revenues are historically high and rising
Tax revenue as a share of national income is high by historical UK standards but relatively low when compared with other Western European countries. There will be pressures to increase taxes further in coming decades, including to fund the needs of an ageing population.
Total UK tax revenue is forecast to reach 37.7% of national income by 2027–28. This will be the largest share of national income taken in tax since at least 1948. There has been a sharp increase in tax revenue (and therefore in total government revenue) since 2019–20. This has come alongside a substantial increase in government spending (Figure 2). Spending spiked in 2020–21 in response to the COVID-19 pandemic and is on course to be permanently higher in the medium term, driven primarily by increased health spending and higher interest payments on government debt.
Figure 2. UK public finances, past and future
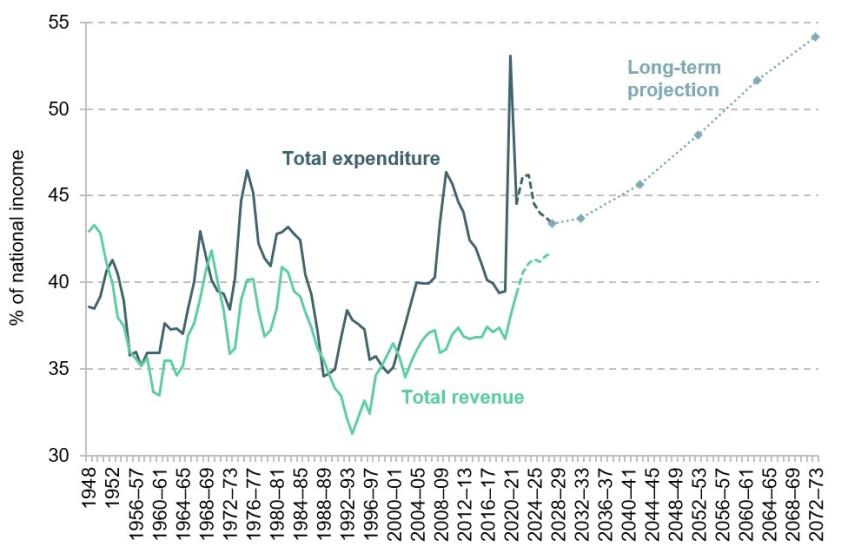
Note: Long-term spending projection is the OBR Fiscal Risks and Sustainability forecast of ‘primary spending’ (defined as total managed expenditure minus public sector interest payments) plus an assumed public sector interest payment of 4.1% of national income in all years of the forecast (this figure corresponds to the forecast level of public sector interest payments in 2027–28 as set out in Office for Budget Responsibility (2023d)). This effectively assumes that increased spending pressures are sufficiently funded through increased revenues so that debt interest spending remains constant as a share of national income beyond 2027–28.
Source: Total expenditure is ‘total managed expenditure’ and total revenue is ‘public sector current receipts’ from Office for Budget Responsibility (2023a). Long-term projection is authors’ calculation based on table 4.1 of Office for Budget Responsibility (2023c).
Despite the large recent increase in tax, future governments will face major spending pressures that will add to demands on the public purse. Today, around 23% the UK adult population are over the state pension age. By 2040, that is expected to reach 27% and, by 2070, 30% (Cribb et al., 2023). This ageing population will demand both more and more expensive health and social care as well as increased spending on state pensions. This will be only partially offset by reduced pressures on education spending coming from the UK’s falling birth rate. Figure 2 shows a spending forecast derived from the Office for Budget Responsibility’s (OBR’s) estimate of how government spending would need to grow in coming decades in order to meet the demands of demographic, economic and technological change.1 This forecast suggests spending would need to increase to 45% of national income by the 2040s. Numbers of this kind are highly uncertain – relying on numerous assumptions about the future that may not come to pass. Nevertheless, Figure 2 provides a broad indication of the scale of the fiscal challenge the UK will face.
In recent decades, UK health spending has been increased substantially not by raising taxes but, effectively, by reducing the share of national income spent on defence since the end of the Cold War. That is not a trick that can be repeated – indeed, governments may well face pressure to increase defence spending in future. It would also be difficult to continue the pattern of the last 15 years which, broadly, has seen increases to spending on health (and a few other areas) alongside large cuts to the funding of most departments.
The UK’s ageing population will effectively confront policymakers with a choice in coming decades: increase levels of tax substantially to fund higher spending or substantially reduce the scope of the public services that the British state provides.
The current level of UK taxation remains relatively low compared with most Western European countries (Figure 3 compares tax revenues across the OECD in 2020, the latest year for which comparable data are available). But government revenues around 45% of national income (which the above spending forecast suggests would be required to meet spending pressures by the 2040s) would match the highest levels currently seen in the most heavily taxed European countries (although tax in these countries may well also rise in the coming years).
Figure 3. Total tax revenue in OECD countries as a share of GDP, 2020
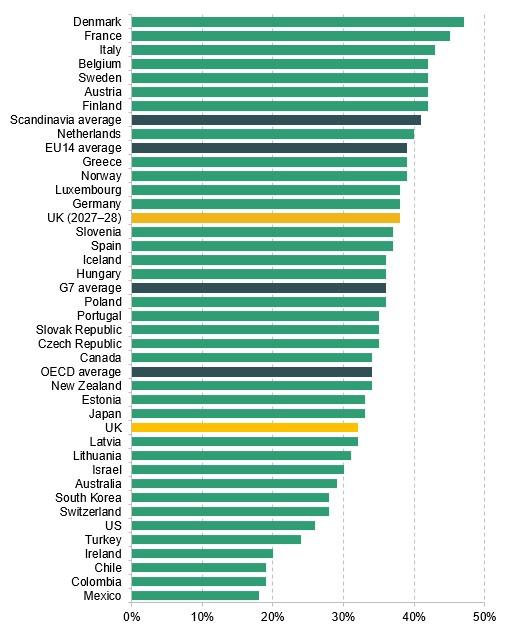
Note: Scandinavia is taken as Denmark, Finland, Iceland, Norway and Sweden. EU14, G7, OECD and Scandinavian averages are unweighted.
Source: OECD, 2022.
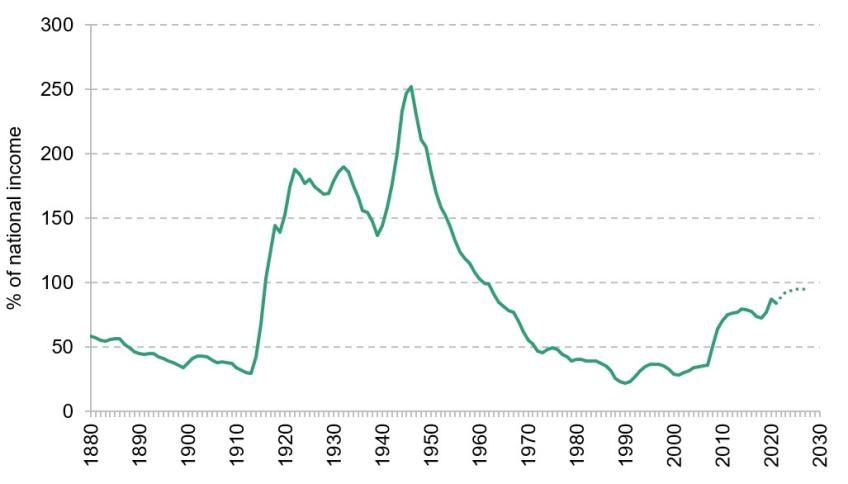
2. Debt is high and harder to manage
To stop debt rising, future governments will need to run a primary surplus, meaning revenues higher than non-interest spending. The stated desire to reduce debt will constrain fiscal policy for many years.
For good reasons, national debt ratcheted up following both the 2008 financial crisis and the COVID-19 pandemic. In both cases, higher spending (relative to the size of the economy) led to higher borrowing and therefore to higher debt. The measure of UK government net debt that is targeted by fiscal rules is currently around 90% of GDP. This is high relative to the recent past (see Figure 4); indeed, prior to the financial crisis, the explicit aim was to keep debt below 40% of GDP. It is also fairly high relative to other developed countries (International Monetary Fund, 2023). But UK debt has been higher relative to the size of the economy, notably following the world wars.
Figure 4. Underlying public sector debt
Note: Series shows public sector net debt. From 1997–98 onwards, figures exclude Bank of England holdings. Figures include the island of Ireland in its entirety up to 1920, and Northern Ireland only thereafter.
Source: Figures prior to 1900–01 from the Bank of England’s ‘A millennium of macroeconomic data, version 3.1’ (2017) and thereafter from Office for Budget Responsibility (2023b).
One key difference relative to the post-war period is that, at the same time as debt has risen substantially, it has become more difficult to manage a higher debt burden.2 This is for two main reasons. First, and most importantly, weak growth in GDP – driven by abysmal productivity growth since the financial crisis (Szreter, 2023) – means that it is much harder to reduce the debt-to-GDP ratio. For a given stock of nominal debt, reducing the debt-to-GDP ratio is easier when GDP growth is strong. Second, since March 2022, interest rates have risen substantially, which pushes up the cost of servicing government debt. The combination of much-elevated debt and rising interest rates means that debt interest spending is forecast to be running at around 3¼% of GDP in 2027–28, which is a level not seen since the late 1980s (Figure 5).
Figure 5. Debt interest spending as a share of national income
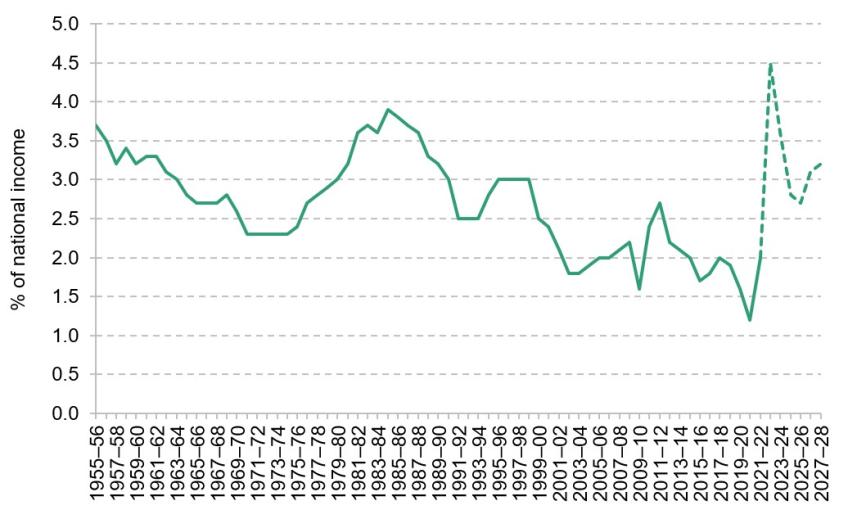
Source: Chart 4.10 of Office for Budget Responsibility (2023d).
There are a number of potential concerns with operating at a higher level of debt:
- It might reduce the scope for the government to respond with a large increase in borrowing the next time a substantial adverse shock occurs.
- Combined with higher interest rates, it means that for a given amount of total public spending a greater proportion goes on debt interest rather than being available for public services or social security benefits.
- Elevated debt leaves the public finances more exposed to interest rate rises: the increase in debt interest spending from a given rise in interest rates is now twice what it was prior to the financial crisis. In addition, and as a result of quantitative easing, the government is now effectively borrowing on a shorter-term basis (Tucker, 2022). This means that the impact of higher interest rates feeds through into increased debt interest spending more quickly: 80% of the eventual increase would be seen within 12 months, compared with 30% in 2007.
For these reasons, successive Chancellors have set themselves a fiscal target that commits to debt falling as a share of GDP in the medium term. Broadly, this is a sensible goal. A key choice for governments is the specific design of the fiscal rules used to achieve this. The current government’s primary fiscal target – its ‘fiscal mandate’ – is for underlying public sector net debt to fall in the final year of a rolling five-year forecast (currently 2027–28). Achieving falling debt has become more difficult. By the end of the forecast horizon, this now requires the government to run a primary surplus – that is, for revenue to be higher than spending, excluding spending on debt interest. In fact, a primary surplus is needed simply to stop the debt-to-GDP ratio rising.3 As such, the desire to put debt on a declining path is now a major constraint in fiscal policy. Unless economic growth increases, or interest rates drop back towards the very low levels they were at prior to the pandemic, the public finances look tight for the foreseeable future.
Under current planned policy, and based on the most recent OBR forecasts, underlying public debt is due to peak in 2026–27 and fall only slightly the following year. There is much uncertainty around the forecast for debt and it could easily end up rising in that year. One clear risk is that OBR forecasts assume that the government will implement its stated policy of raising rates of fuel duties in line with RPI inflation – but it has not actually done that since 2010 (see Fact 9).
The opposition Labour Party has also said it would set itself a target for reducing debt as a share of national income, though it has also indicated that it would take greater account of public sector assets as well as debt in fiscal policy. Considering both sides of the balance sheet – that is, assets as well as debts – makes sense. Future generations are likely to be more relaxed about inheriting a higher level of debt if it is associated with better public sector assets than if it is not. And there are measures of the health of the public finances, such as public sector net worth, that are broader than the stock of debt. But the commitment to put debt on a downwards path would – as for the Conservatives – not be easy to meet.
3. The tax system penalises employment
The self-employed and company owner-managers are often taxed at substantially lower tax rates than employees, creating unfairness, inefficiency and complexity.
Figure 6 shows how the tax liability incurred by an individual generating £40,000 of income varies across three different legal forms. The differences are stark. For an employee, the tax liability for a job generating £40,000 of income is £11,326. That compares with £8,135 for a self-employed person and just £6,604 when the income is earned through a company (allowing it to be paid out partially in the form of dividends). Even these figures will understate the degree of disparity in cases where business owners are able to take income in the form of capital gains – which are often taxed at lower rates than dividends. In almost all OECD countries, dividend income is taxed more favourably than labour income.4
Figure 6. Tax due on a job generating £40,000 in 2023–24
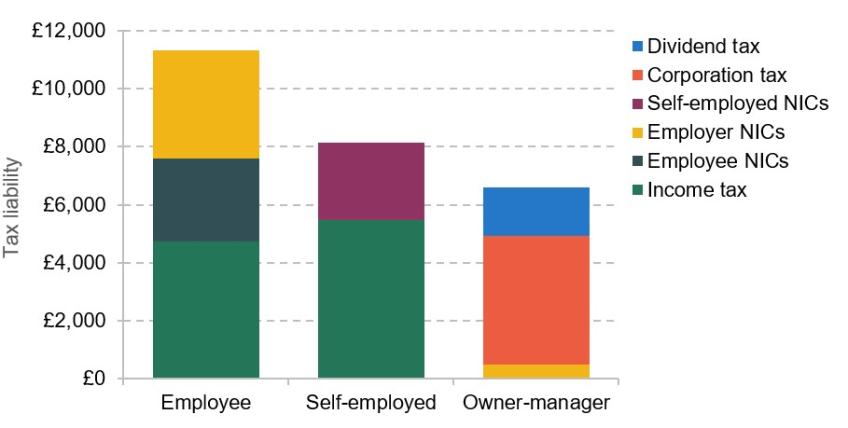
Note: Employees are charged income tax on income excluding employer NICs (this is why income tax is slightly higher for the self-employed than for employees – the self-employed receive more of the £40,000 as taxable income). Company owner-managers are assumed to pay themselves a small salary and to take the rest of their income in the form of dividends (which is the most tax-efficient way to take this level of income out of a company in a given year). Excludes trading allowance and employment allowance where applicable. We assume no pension contributions are made.
Source: Authors’ calculations.
The most important driver of the UK’s tax penalty on employment is National Insurance contributions (NICs).5 Contrary to popular belief, differences in the government benefits offered to employees and the self-employed are far too small to explain the large disparity in NICs treatment between them. Nor can tax differences be justified by differences in employment rights (IFS Taxlab, a).
The tax penalty on employment causes economic distortions, including by biasing the labour market away from employees – making, for example, the use of self-employed contractors more attractive. Current arrangements are also unfair in the sense that people generating similar incomes can face drastically different tax bills depending solely on their income source. And while lower rates of tax for business owners are often defended as a means to encourage investment, they are in practice poorly targeted at achieving this (IFS Taxlab, b).
Preferential tax rates on business incomes also have implications for inequality. Business owners – both the self-employed and company owner-managers – are over-represented at the top of the income distribution. As well as reducing the overall tax rates faced by those with high incomes, preferential rates create opportunities for taxpayers to switch to more lightly taxed forms of income in response to increases in taxation, making it harder for governments to raise more revenue by increasing top rates of income tax (Delestre et al., 2022).
These issues have become more important over time as the number of people working through their own business has grown. Between the turn of the 21st century and the pandemic, business owners were the fastest-growing part of the UK labour force (Cribb, Miller and Pope, 2019). That growth was at least partly tax-motivated. One of the government’s responses has been to seek to apply full employment taxes to individuals who are paid through a company but who it considers to be employee-like (using so-called ‘IR35’ rules). The reality, however, is that the boundary between employees and the self-employed is murky and difficult to police.
There is broad agreement that better aligning the overall tax rates levied on different forms of income would alleviate a range of problems. There are two broad challenges for government. One is to design a system that would achieve closer alignment of capital and labour income taxes without discouraging investment and, potentially, with more targeted ways to incentivise entrepreneurship. Adam and Miller (2021b) describe such a system. The taxation of incomes could be made fairer and more efficient. But it would require substantial reforms. The second and harder challenge is therefore how to achieve such reform politically.
4. Personal tax is unnecessarily complex and opaque
Personal income taxes have become more complex since 2010. New ‘humps’ in tax rates and threshold freezes have led to record numbers paying higher rates.
Income tax and National Insurance contributions (NICs) are the two largest taxes, raising just under half of all tax revenues. Together they tax personal incomes in a way that is unnecessarily complex and opaque. Recent changes to income tax have increased complexity by adding ‘humps’ in the rate schedules that people face (Figure 7). This, in combination with freezes to thresholds, means that more people than ever are paying income tax rates above the basic rate.
Figure 7. Humps in the marginal personal tax rate on employees
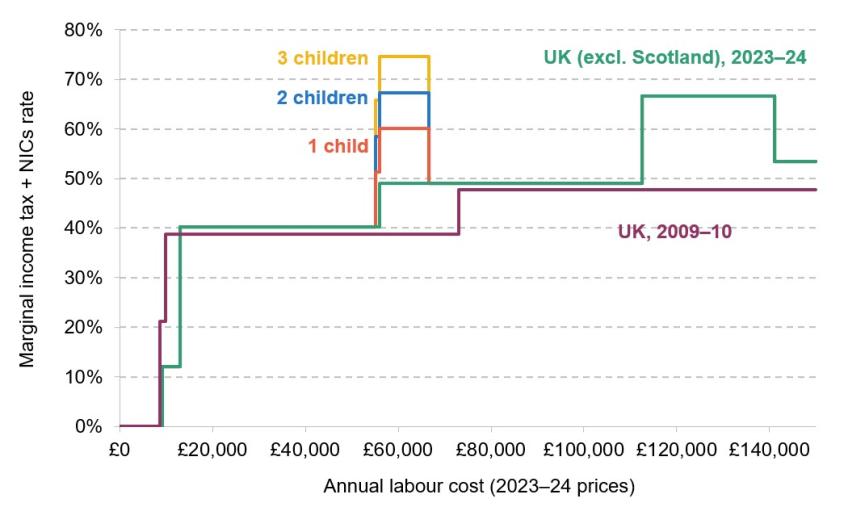
Note: Horizontal axis shows labour cost (gross earnings + employer NICs); marginal rates are expressed as a percentage of that labour cost. Graph assumes all income is from earnings and that earnings are stable throughout the year. The employment allowance is ignored.
Source: Authors’ calculations.
While NICs once played a significant role in determining the state benefits that individuals access, this relationship has been substantially eroded over time. NICs now operate essentially as a second income tax, with a portion of the liability paid directly by employers. This arrangement (and the fact that debates tend to focus on income tax rates) can make it hard for taxpayers to understand the tax rates they are facing. The 20%, 40% and 45% rates of income tax are highly salient in the UK’s political debate but the overall tax rates, including all forms of NICs (shown in Figure 7), are far less so. (Note that income tax rates differ in Scotland.) Many people are likely unaware, for instance, that each additional £1 paid by an employer to an employee earning £25,000 a year will ultimately be taxed at an overall rate of 40%. Additional complexity arises because NICs are not charged on investment incomes, pension income or the earnings of people above the state pension age, and are levied at lower rates on the self-employed.
As well as making clear the overall level of tax rates on (employees’) personal income, Figure 7 shows ‘humps’ in the tax schedule – points where the marginal rates jump up and then down again. Alistair Darling, when Chancellor, created one such hump by withdrawing the tax-free personal allowance when a taxpayer’s income exceeds £100,000.8 This effectively creates a 60% income tax band (67% once NICs are accounted for) for those earning between £100,000 and £125,140. This is not a desirable feature; it is an opaque way to increase marginal rates and unnecessarily distorts taxpayers’ work and saving decisions.
The withdrawal of child benefit from those earning between £50,000 – slightly below the higher-rate threshold – and £60,000 creates a series of humps. This policy was introduced in 2013 by the then-Chancellor George Osborne. For a parent with three children, this can mean an effective overall tax rate of 75% – substantially blunting the incentive to increase earnings above £50,000. Furthermore, the £50,000 and £60,000 thresholds between which the benefit is withdrawn are frozen in cash terms. This has two implications. First, child benefit is being removed from ever more people – 26% of families now have some or all of their child benefit withdrawn compared with just 13% in 2013–14 (Waters and Wernham, 2022). Second, because child benefit is (sensibly) updated annually with inflation, the effective rates faced by those having the benefit withdrawn have been steadily increasing since the policy was introduced.
Changes to income tax have had big effects on the number of people paying the tax and on the number paying it at a rate of 40% or higher (see Figure 8). Large increases to the personal allowance in the early 2010s reduced the number of income tax payers. The current cash freeze in the personal allowance, however, will completely reverse this trend and, by 2027–28, the share of adults paying income tax is set to be higher than at any time since the early 1990s.
Figure 8. Taxpayers and higher-rate taxpayers over time
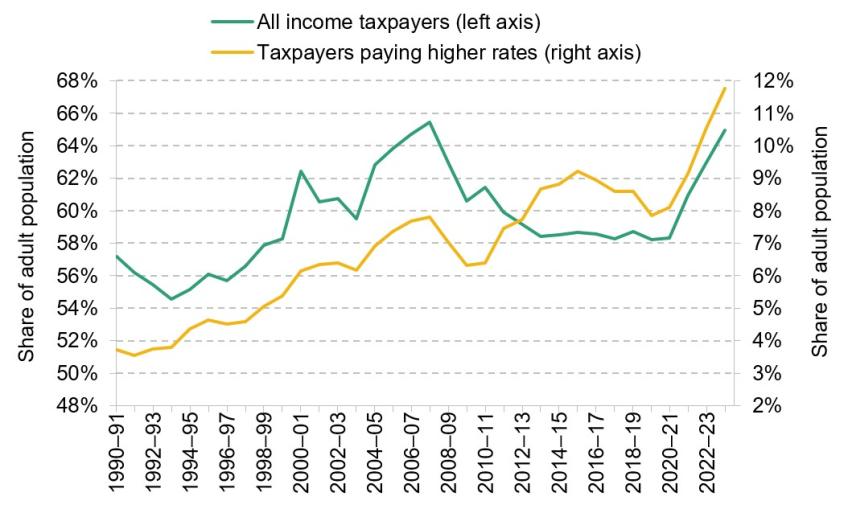
Note: Taxpayers paying higher rates are those paying either the higher or additional rate of income tax. Numbers of taxpayers include Scottish taxpayers, who are classified as higher-rate taxpayers if they have total income above the UK higher-rate threshold or if they have non-savings, non-dividend income above the Scottish higher-rate threshold.
Source: Number of taxpayers from table 2.1 of Office for National Statistics (2023). Total adult population from Office for National Statistics (2022a).
The real-terms value of the higher-rate threshold has also changed substantially over time. Overall, and as a combined result of changes in thresholds, the creation of a 45% additional rate of income tax and earnings growth, there has been substantial growth in the number of people paying higher rates. In 1991–92, just 3.5% of UK adults paid the 40% higher rate of income tax. By 2023–24, 12% were paying the higher or additional rate and, as a result of the ongoing threshold freeze, that figure is set to continue rising rapidly, reaching 14% by 2027–28.7
Bringing more people into income tax and increasing the scope of higher tax rates to encompass a larger share of the population is not necessarily undesirable – choices in this area reflect the balance of governments’ priorities around work incentives and redistribution. But governments must make careful choices over how high rates should be and how higher rates are achieved. The higher rates associated with the ‘humps’ are problematic. They are opaque and create particularly high marginal rates (and therefore larger disincentives to work) for the affected groups. The way in which threshold freezes are greatly increasing the number of taxpayers facing high rates is also problematic. Such choices should be made explicitly and transparently by politicians and not arbitrarily shaped by inflation.
5. VAT reduced rates and exemptions cost £100 billion
VAT was designed to be a low-cost, efficient revenue raiser. It raises much more than when introduced 50 years ago. But widespread zero rates and exemptions create distortions and compliance burdens that hinder economic performance.
VAT is the UK’s third-largest tax. It replaced ‘purchase tax’ in 1973 and, after three rate rises, now raises 15% of tax revenues – roughly double the share it accounted for in 1978–79 (Figure 9). At the same time, revenues from other indirect taxes – a category comprising both excise duties such as fuel and tobacco duties and environmental taxes – have fallen significantly.
Figure 9. Contribution of indirect taxes to government revenue
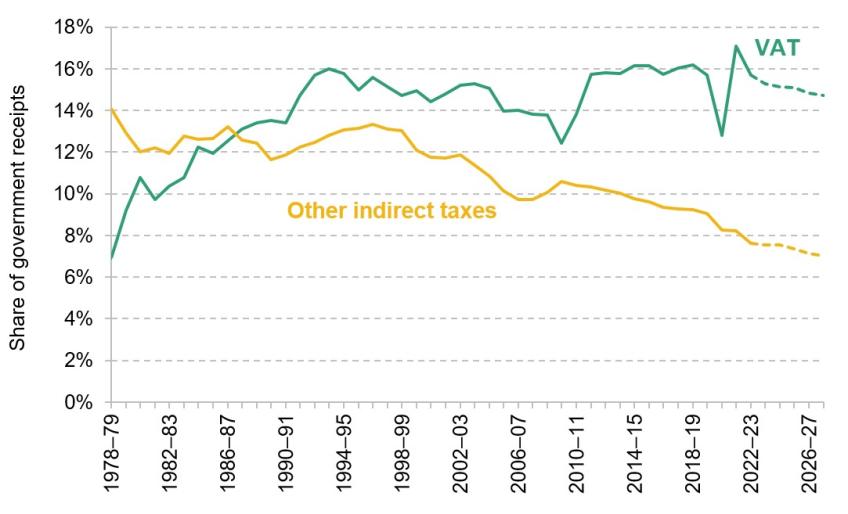
Note: See note to Figure 1 for composition of ‘other indirect taxes’.
Source: Authors’ calculations using IFS Taxlab (c).
This move away from taxes on specific goods towards general consumption taxes such as VAT is mirrored across most of the developed world; the US is an outlier in not having a VAT. VAT has been described as ‘unquestionably the most successful fiscal innovation of the last half-century … perhaps the most economically efficient way in which countries can raise significant tax revenues’ (Bird, 2010, 363). But while VAT has huge appeal as a tax-raising tool in principle, the UK’s version creates a large number of distortions and a high compliance burden.
Problems arise because many goods and services are not subject to the main 20% rate (Mirrlees et al., 2011). A reduced 5% rate applies to domestic energy and a few other products, and a zero rate applies to new housing, children’s clothing, most food and some other goods. A further set of goods and services, including financial services, are VAT-exempt.8 The amount of revenue the UK raises through VAT is comparable to that in most other developed economies, but it comes from a narrower VAT base (because reduced rates apply more widely) (IFS Taxlab, e).
Reduced and zero rates of VAT and exemptions are extensive, representing £97 billion of forgone revenue in 2022–23.9 Variation in VAT distorts spending and production decisions in unjustified and often unfair ways. For example, the reduced 5% rate on domestic fuel encourages firms to supply and households to demand gas boilers, thereby working against the net zero goal.
VAT concessions add a huge amount of complexity to the tax system. There is an incredible amount of detail in the rules determining exactly what qualifies as, for example, an exempt financial service or zero-rated food. Long, expensive court cases have been fought over whether specific products such as Jaffa Cakes, or certain types of flapjack, should be subject to VAT. Policing such distinctions can swiftly lead to the realm of the absurd. A gingerbread man is zero rated for VAT as long as the chocolate decoration is ‘no more than a couple of dots for eyes’ – add a smile, and you’ll also need to add 20% VAT.
Zero- and reduced-rating for goods such as food, children’s clothing and domestic fuel are often justified on distributional grounds but are extremely poorly targeted at helping those on low incomes. Poorer households do spend proportionally more on these goods than richer households. Removing zero and reduced rates would therefore be regressive.10 But in cash terms, most of the benefit of these tax breaks goes to richer households. Universal credit would be much better targeted at poorer households than VAT concessions. Previous analysis has shown that it would be possible to remove VAT tax breaks, compensate low-income households through higher welfare payments and raise significant amounts of revenue (Crossley, Phillips and Wakefield, 2009; Crawford, Keen and Smith, 2010).
The key choice for citizens and governments is whether to continue to bear the huge costs of keeping the current system.
6. Wealth is intergenerationally unequal and returns undertaxed
Recent generations look set to have less wealth, on average, than their parents did at the same age. Returns to wealth tend to be taxed at lower rates than labour income.
UK wealth is unequally distributed – even more so than income. There is also a clear intergenerational divide in wealth (Bourquin, Brewer and Wernham, 2022). Broadly, this has been driven by the different fortunes of different generations. Those born in the 1940s, 1950s and 1960s: saw strong earnings growth during their careers; were more likely to have defined benefit pensions; and were likely to be able to buy a house and have subsequently benefited from a recent period of low interest rates that increased the value of their wealth. In contrast, those born in the 1980s or later: have suffered from weak earnings growth since the mid 2000s (i.e. for all of their career so far); are much more likely to be saving in defined contribution pensions which, relative to defined benefit schemes, are less generous and expose individuals to more of the risk associated with variation in returns; and have been made worse off by the period of low interest rates which made housing and saving for retirement less affordable.
Figure 10 shows one important example of the intergenerational divide in wealth. Those born in the 1940s and 1950s saw a clear increase in their likelihood of owning a home relative to the previous generation. But the cohort-on-cohort improvement in homeownership came to a halt when house prices started to rise rapidly in the 1980s. Those born in the 1970s and 1980s have fallen behind their predecessors; indeed, the 1980s cohort seems to be following the homeownership age profile of those born in the 1930s.
Figure 10. Average homeownership by age, for people born in different decades
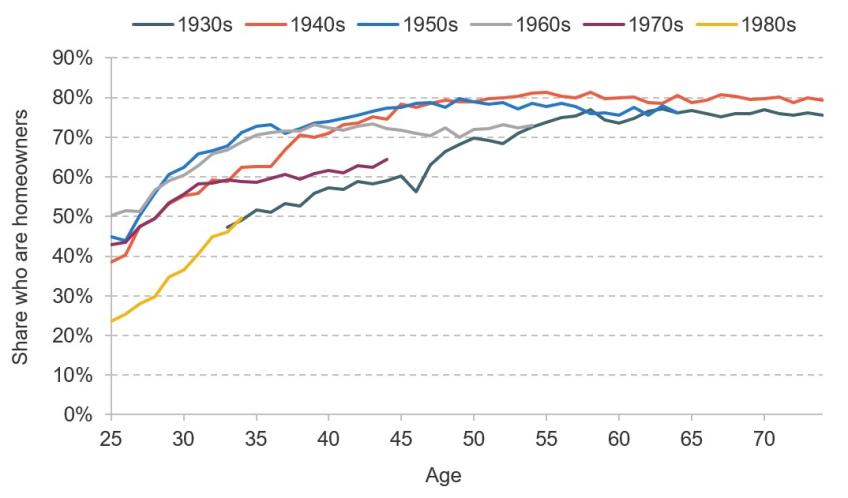
Note: Cohort of birth is approximated based on age and year of interview. Age is not the age recorded in the microdata, but the average age of the cohort in the year observed, to allow the most recent data for each cohort. A ‘homeowner’ is defined as an individual, living in owner-occupied housing, who is either the household reference person or their partner.
Source: Figure 24 of Bourquin, Brewer and Wernham (2022).
Overall, recent generations look likely to accumulate less wealth through saving and buying a home than their parents did, and those who do become as wealthy as their parents are more likely to have to wait until they are older and rely on inheritances.
Housing accounts for just over a third of total UK household wealth and pensions account for another 42% (Office for National Statistics, 2022b). A minority of wealth is held in other financial assets, such as shares – this is true even for the wealthiest households.
There are problems with how the returns to wealth are taxed.
Notably:
- Capital gains on main homes are exempt from capital gains tax. Large capital gains – many of them the result of luck – have been at the core of the rise in net household wealth and the growing intergenerational divide.
- Pension saving receives large subsidies that are overly generous to groups that are not in danger of undersaving for retirement (Adam et al., 2023). For example, 25% of a pension (up to a cap) can be withdrawn free of income tax. Given that there is also income tax relief on contributions, this means that a significant portion of pension wealth (comprising both the initial remuneration that was saved and any subsequent returns) is never subject to income tax. The design of this feature means that the tax break is largest for those with the most pension wealth.
- The returns to financial wealth – i.e. capital incomes, including dividends and capital gains – are taxed at lower rates than labour income (see Fact 3). Financial wealth is more important at the top of the wealth distribution and capital incomes (notably from closely held businesses) are more important at the top of the income distribution (Delestre et al., 2022).
There is ample scope to reform how we tax the returns to wealth, and therefore how tax affects the accumulation and distribution of wealth. For governments, there are both tax design and political challenges. For example, there is a strong case for taxing housing capital gains, but this needs to be done in a way that does not discourage saving or distort who owns houses.11 And there would be a major political challenge in implementing even a well-designed tax: if a government introduced such a tax, there is a real danger that people would stop selling houses in the expectation that the tax would be removed by a future government.
Inheritances will eventually transfer some wealth to today’s younger cohorts and thereby lessen the intergenerational divide to some extent. But this looks set to reduce social mobility by strengthening the link between the living standards of the 1980s cohort and their parents’ circumstances (Bourquin, Brewer and Wernham, 2022). Some wealth is taxed at death but the UK’s inheritance tax is flawed. Most notably, it is easy to avoid for the very largest estates. This can be achieved by transferring significant portions of wealth more than seven years from death (straightforward for the very wealthy but more difficult for those whose main wealth is tied up in their home) or through the use of reliefs, notably including those for agricultural land and unquoted business assets. Pension wealth can be passed on to heirs entirely free of inheritance tax – creating the bizarre situation where pensions are treated more favourably as a vehicle for bequests than as a source of retirement income. As with taxes on the return to wealth in life, there is ample scope to reform taxes at death. Inheritance tax could be reformed by, for example, removing or restricting reliefs. It could also be overhauled. The logic behind a system of wealth transfer taxation implies that tax should be levied on the recipient (rather than the estate of the donor) and should be levied irrespective of whether the transfer was made at or before death.
Given high wealth inequality, a natural question is whether the UK should introduce a wealth tax. There is not agreement among economists about whether an annual tax on the stock of wealth should feature as part of a well-designed tax system – although there are good reasons to think such a tax would be undesirable as well as major practical issues in measuring wealth.12 Either way, an annual wealth tax is no substitute for fixing capital taxes.13
7. Council tax is over 30 years out of date and regressive
Council tax is highly regressive with respect to property values and leads to increasingly arbitrary tax bills. Stamp duty holds back housing transactions.
Council tax is important – it raises £44 billion a year. Council tax bands in England are still based on property values in April 1991 – over 30 years ago. The relative prices of different properties within each local authority have changed significantly since then. This means properties are in increasingly arbitrary tax bands – the amount that each of us pays bears increasingly little relation to the actual value of the property we live in. In addition, the most valuable properties in 1991 (band H) attract just three times as much tax as the least valuable properties (band A), despite being worth at least eight times as much in 1991 and typically even more now, since prices have risen most in areas where they were already highest. A progressive tax system does not require each individual tax to be progressive, but it is hard to see what would justify a regressive tax on property.
The poor design of council tax, in conjunction with the mechanism for allocating funding to local councils,14 produces a system that favours London and the South East, where property values are much higher and have risen strongly since 1991, over the North and Midlands, where prices are much lower and have risen relatively slowly (see Figure 11).
Figure 11. Average property price in April 2023 as a multiple of January 1995, by region
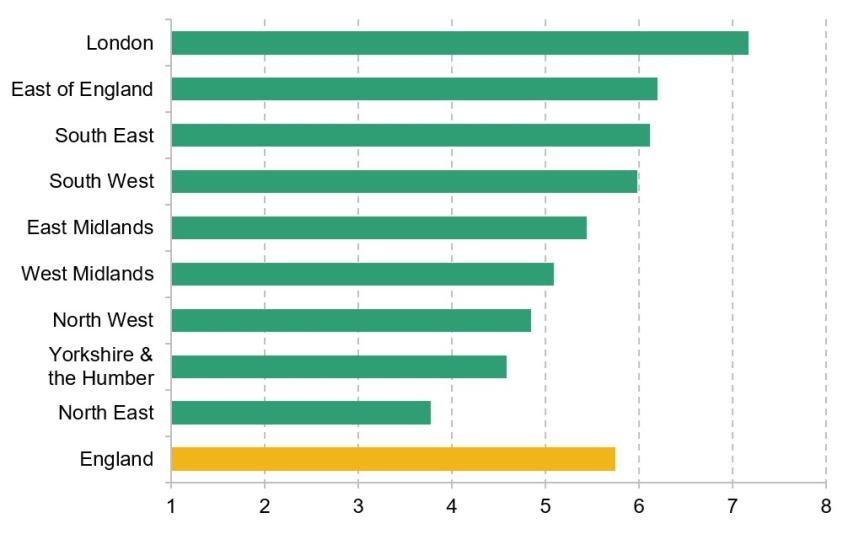
Source: Authors’ calculations using Land Registry house price statistics.
Council tax is ripe for reform (Mirrlees et al., 2011). If council tax were based on up-to-date values and made proportional (rather than regressive) relative to property prices, the council tax base would increase in London and the South East relative to other parts of the country. If government funding for local authorities were updated in light of the new council tax valuations (such that areas seeing a higher tax base received less funding from central government) and local authorities changed council tax rates to maintain their revenue, tax bills would be significantly higher in London and parts of the South East and significantly lower in the Midlands and the North. Such a tax would be much more progressive – average bills would be lower for most households in the bottom half of the income distribution, and higher for those at the top (Adam et al., 2020). It would not require the overall burden of council tax to change, only which households pay the most.
Council tax varies across parts of the UK. Northern Ireland operates a system of domestic rates (similar to the pre-1990 UK-wide system) that is based on 2005 property valuations. Scotland also operates a council tax based on 1991 property values, but has (as of 2017) made the tax less regressive by applying higher rates to properties in bands E to H. It is currently consulting on proposals to increase the relativities for bands E to H further from April 2024. Wales revalued its council tax in 2005 using 2003 property valuations and is in the process of undertaking a revaluation and reform of the system. The main challenge for England is to find the political will to reform council tax.
Stamp duty land tax is a tax on property and land transactions. This is a highly problematic tax. A basic tenet of the economics of taxation is that transactions taxes should be avoided. Stamp duty imposes a heavier tax charge on properties that change hands more often – there is no good reason to do this. By taxing housing transactions, stamp duty gums up the housing market. It means that fewer houses are bought and sold, people find it harder to move to where the jobs are, young families struggle to trade up, and older people hold onto bigger properties than they need, because it costs so much to move. Mirrlees et al. (2011) argued that there is no place for stamp duty on property transactions in a well-designed tax system.
8. Business investment is weak and corporation tax uncertain
UK rates of corporate investment are among the lowest in the developed world. Corporation tax policy has recently been subject to major changes. Policy uncertainty deters investment.
In 2019, UK business investment was the lowest in the G7 and the third-lowest in the OECD (Adam, Delestre and Nair, 2022). Investment affects productivity and, thereby, living standards.
Corporation tax impacts investment incentives. Broadly, there are two problems with UK corporation tax policy. First, recent policy changes have created uncertainty that damages investment incentives. Second, investment incentives vary across asset types, financing sources and legal form – this has long been true and is true, to varying degrees, in most countries.
Until recently, the big-picture trend in UK corporation tax was rate cutting (see Figure 12) and base broadening; this trend has been seen across many developed countries in recent decades, although the UK went further than most. In 2022, the UK had one of the lowest corporation tax rates in the developed world, but also some of its least generous investment allowances. Broadly speaking, the low rate was well targeted at making the UK an attractive location for profitable, internationally mobile investments. But the narrower base disincentivises domestic investment.
Figure 12. Corporation tax rate and revenue over time
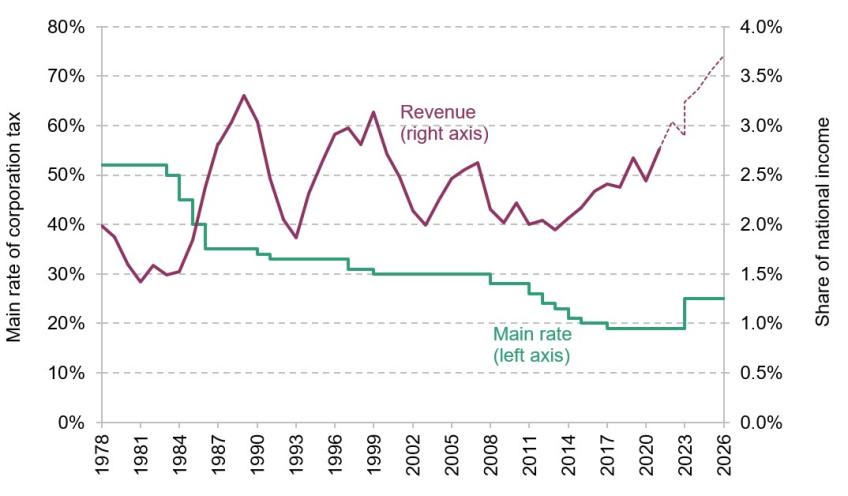
In the 2010s, there was a clear sense of overall policy direction that had been laid out in a much-praised ‘corporate tax road map’ (HM Treasury, 2010) – although, within this, frequent changes to the annual investment allowance (AIA), which allows businesses to immediately deduct 100% of their plant and machinery investment up to a certain limit each year, created uncertainty.
Mr Sunak, both as Chancellor and as Prime Minister, has changed the direction of policy. In April 2023, the main rate of corporation tax increased to 25%. This was the first rate increase since Denis Healey’s 1974 Budget. As a result, corporation tax revenue is forecast to reach its highest-ever level (Figure 12). At the same time, investment allowances have been made substantially more generous for the three years from April 2023. Companies can now immediately deduct 100% of all spending on plant and machinery (essentially equivalent to an uncapped AIA) – a policy often called ‘full expensing’. The government has said it wants to make this policy permanent, but there is uncertainty over whether this will happen.
Corporation tax seems to have started on a new course towards a higher rate and a narrower base. But there is uncertainty around that. Will full expensing be made permanent? Will the main rate stay at 25%? And even if this is the new steady state, the tax base still embeds a range of distortions; some investments are discouraged by tax while others are subsidised (in both cases unjustifiably). Indeed, full expensing actually substantially increased a subsidy for debt-financed investments;15 will that be maintained? And how will the UK address the ongoing challenges that arise when trying to tax the mobile profits of multinationals? The current government is engaged in an OECD-led multilateral reform of corporation tax (which includes the implementation of a minimum international rate), but how far does the UK plan to go in changing how multinationals are taxed? While it is always desirable for a government to lay out how it thinks a tax should be designed, it is particularly important when taxes are affecting long-run decisions. Corporate investment will be held back by uncertainty, including policy uncertainty. A future government should clearly set out its plan in this area.
9. Taxes are being used to change behaviour in new ways
Revenues from long-running sin taxes have been declining, while governments have introduced more taxes with the explicit aim of changing behaviour.
The UK has long levied ‘sin taxes’ on alcohol, tobacco and some gambling (the first recorded incidence of alcohol duties dates back to 1643) – although the degree to which these taxes are intended to alter behaviour (as opposed to merely raise revenue) is not always clear-cut. Tobacco and fuel duties revenues have been in decline since the early 2000s, reflecting both the relative decline in smoking and fuel use and, in the case of fuel, reductions in the real value of duties over time (Figure 13). In recent decades, new taxes aimed at changing behaviour in new ways have been added. These include taxes on landfill waste (1996), the extraction of aggregates (2002), the sugar content of soft drinks (2018) and plastic packaging (2022), as well as (since 2010) a raft of taxes targeted in one way or another at curbing greenhouse-gas-emitting activity. Tax is also being used to subsidise activities judged to have wider societal benefits, including through R&D tax credits (2000) and a range of schemes aimed at renewable energy generation.
Figure 13. ‘Sin taxes’ over time
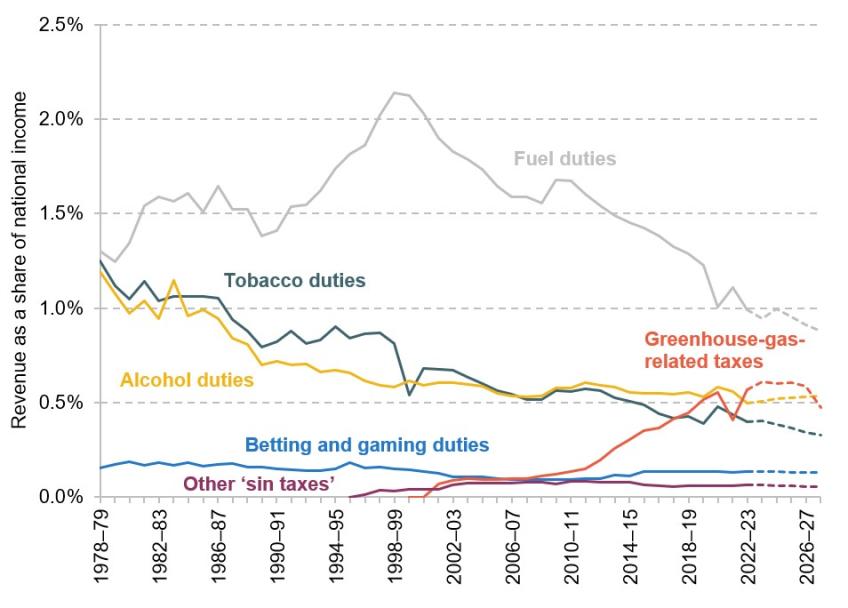
Note: Greenhouse-gas-related taxes include the Renewables Obligation, the Emissions Trading Scheme, the climate change levy, contracts-for-difference, capacity market payments, and the carbon reduction commitment. Other ‘sin taxes’ include landfill tax, aggregates levy, soft drinks industry levy and plastic packaging tax.
Source: Authors’ calculations using IFS Taxlab (c).
There can be a clear rationale for using tax to change behaviour in cases where one economic agent imposes costs (or benefits) – so-called externalities – on others and does not account for those effects when making decisions. The classic examples are pollution and innovation, which motivates why many governments tax motoring and other uses of fossil fuels and subsidise investment in R&D. Taxation can be a particularly efficient way of dealing with such externalities by providing a price signal that would otherwise be absent and thereby ensuring that the decisions of individuals account for their impact on society as a whole. Taxes are also sometimes used to try to stop individuals from harming themselves, particularly in the face of addictive substances. This is arguably, at least partly, the case with taxes on tobacco, alcohol, gambling and, more recently, sugar in soft drinks. In such cases, there is also likely to be a large dose of straightforward paternalism, and people will differ in their views on the appropriate role of government in such cases.
The soft drinks industry levy – a tax on soft drinks containing sugar – provides an informative case study on the challenges in designing taxes aimed at changing behaviour. The tax was motivated by evidence that young people consume large amounts of sugar. International evidence from other countries with such taxes suggests that soft drink taxes led to increased prices and that, in turn, higher prices reduced consumption. The design of the UK’s sugar levy also incentivises producers to lower the sugar content of drinks. There is evidence that the UK tax has led to substantial product reformulation and, in cases where products continue to include sugar, to large price increases (Dickson, Gehrsitz and Kemp, 2023). But not everyone who consumes drinks with sugar is causing harm to themselves or others. There is therefore a trade-off: the aim of lowering the social costs of sugar consumption of one group must be weighed against the desire not to impact unnecessarily the decisions of other groups. There is still much to learn about the magnitude of, and the variation in, the social costs of excess sugar consumption in order to evaluate the soft drinks levy fully (Griffith et al., 2020).
10. Taxes on carbon are complex and inconsistent
The tax system has a crucial role to play in shaping incentives to decarbonise. Current tax policies are poorly designed for reaching net zero.
The UK government has committed to reaching net-zero greenhouse gas emissions by 2050. At the same time, the exchequer will need to make up the revenue shortfall that arises as carbon-rich products and activities are phased out. Policy in both areas has been piecemeal and haphazard.
One of the key policy problems presented by climate change is that those undertaking greenhouse-gas-emitting activities do not face the full costs that their actions impose on the rest of society. Carbon taxes can help solve this problem. By imposing a cost that reflects the damage caused by greenhouse gas emissions, the incentives of individuals and businesses can be better aligned to those of society. For a carbon tax to be most effective, a tonne of CO2 should be taxed at the same rate no matter where, or by whom, it is emitted. That avoids a situation where a sector or individual that faces a relatively high carbon ‘price’ makes expensive emissions reductions while another that could reduce emissions more easily does not do so. In other words, it ensures that emissions reductions are made at the lowest possible cost to the nation as a whole.
As things stand, the UK operates a patchwork of taxes that, in various ways, impact the price of carbon – policies include an emissions trading scheme for businesses, taxes on fuel and air travel, and a variety of levy-funded subsidies for renewable energy.16 While some (although by no means all) of the taxes are well targeted at disincentivising emissions, they suffer from an almost complete lack of coordination. As a result, overall tax incentives to cut emissions are highly uneven.
Figure 14 shows the combined effects of the nine different policies that implicitly tax carbon in the energy market. The resulting incentives vary wildly by both end user (households, energy-intensive businesses or non-energy-intensive businesses) and the form in which it is consumed (electricity or gas). For businesses operating in non-energy-intensive sectors, for example, the implicit tax rate per tonne of CO2 equivalent (tCO2e) emitted is £224 for electricity consumption but just £44 for gas consumption.17 Emissions associated with household gas consumption, meanwhile, are actually subsidised relative to other forms of consumption thanks to the reduced 5% rate of VAT levied on household energy bills.
Figure 14. Implicit tax rates on emissions in the energy market, 2023–24
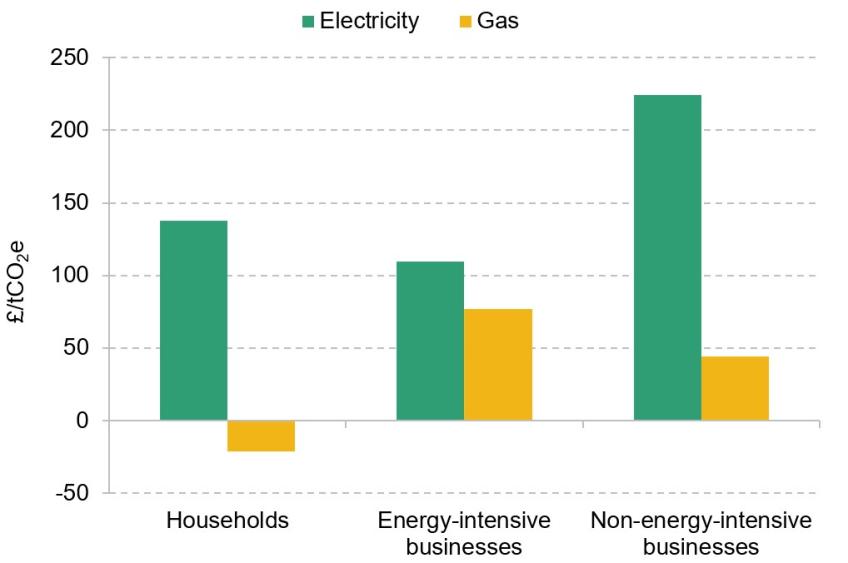
Note: Figures for electricity refer to electricity generated from the burning of natural gas. Implicit taxes encompass charges made as a result of the UK Emissions Trading Scheme (ETS), carbon price support, the climate change levy, contracts-for-difference, the Renewables Obligation, feed-in tariffs, the warm home discount and the Energy Company Obligation. Allocations of free ETS permits are ignored. An implicit tax of zero is taken to include the standard VAT rate of 20%. Additional VAT paid as a result of levies’ increasing retail prices is included in the final implicit tax/subsidy figure. ‘Energy-intensive businesses’ excludes electricity generators. The effects of the energy price guarantee are ignored for the purposes of this analysis.
Source: Authors’ calculations. See online appendix 8A of Adam et al. (2021) for methodology (https://ifs.org.uk/sites/default/files/output_url_files/Green-Budget-2021-Appendix.pdf).
The current tax structure is not well focused on meeting the formidable challenge of decarbonising the UK economy. The government needs a plan to bring greater coherence to the incentives that policy creates. This should include whether and how to tax emissions that are embedded in imports.18 Without a coherent set of incentives, the cost of achieving net zero may well be considerably higher than it needs to be.
As well as the need for a more coherent approach to using tax policy to achieve net zero, there is an increasingly urgent imperative for the government to address how successful decarbonisation will impact current sources of revenue. Two obvious examples of this are fuel duties levied on petrol and diesel that the exchequer depends upon for around £25 billion of revenue a year, and vehicle excise duties, which bring in a further £8 billion. Given that the government is currently committed to ending the sale of new combustion engine vehicles by 2030, that revenue will soon need to be replaced (electric vehicles currently pay neither tax – although vehicle excise duty will begin to be applied to electric vehicles from April 2025).
While electric vehicles do not directly produce carbon emissions,19 there is nevertheless a strong case for continuing to tax motoring in order to help to correct for the other remaining social costs generated by people’s driving – most notably in the form of congestion. Ideally, any newly designed taxes on motoring would reflect at least distance driven and (even better) vary according to when and where journeys take place (although dealing with the distributional consequences of these changes, and potential privacy issues, would need to be carefully considered).20 But even if such a tax were implemented, setting rates at an appropriate level to deter congestion may not entail replacing the revenue currently raised through taxes on fossil fuel. Tax revenue could be made up from other parts of the tax system. The government needs a plan for how to make up the revenue lost on the road to net zero. The longer the government delays such a transition, the more painful it is likely to be as, for example, many more people will be driving hybrid or electric cars in the expectation of paying little tax on them.
Endnotes
Authors

Isaac Delestre
Isaac is a Research Economist in the Taxation sector, focusing on the taxation of high-income individuals and closely-held corporate entities.

Helen Miller
Helen is Deputy Director of the IFS and Head of the Tax sector.
More from IFS
Understand this issue


Policy analysis


Academic research


