
Executive summary
Recruitment and retention of NHS staff is a pressing issue, with more than 12,500 roles, or one in 11 of all roles in the NHS hospital and community sector, reported vacant in the first quarter of 2023.1 One concern is that the NHS may struggle to attract new staff, and retain existing staff, if local non-NHS employers offer alternative jobs with higher pay. While this may in principle affect all staff groups, it is likely to be particularly pertinent for lower paid and non-clinical workers, whose skills and training are likely to be more easily transferable to another sector, compared with clinical staff (such as doctors and registered nurses) with years of highly specialised training.
In this report, we use administrative payroll data from the Electronic Staff Record, combined with local earnings data from the Annual Survey of Hours and Earnings for the period between 2014 and 2019, to examine the correlation between leaving rates for certain NHS staff groups and measures of local pay across different areas of England.
We focus on the retention of NHS staff in bands 1 to 4 of the Agenda for Change framework. Agenda for Change is a national pay structure with limited regional variation in pay for the same role and, as such, offers little flexibility to the NHS to respond to local labour market conditions. Staff in these pay bands make up a third of staff in the acute and community sector, and earned up to £24,882 in 2021–22. This places their earnings roughly between the 10th and the 30th percentile of national full-time earnings. They work in a variety of roles, including nursing assistants and healthcare assistants, assistant allied health practitioners, ambulance staff and healthcare science assistants, as well as non-clinical clerical and maintenance roles.
Key findings
1. Each year between 2014 and 2021, 13% of staff members left the NHS acute and community sectors. This was higher than the job-changing rate for all employees in the UK recorded in the Annual Survey of Hours and Earnings over the same period (10%).
2. Leaving rates are higher in areas with higher overall earnings, with the strongest associations in nursing and midwifery, and allied health and ambulance roles. For both these groups, a £1,000 increase in full-time annual earnings at the 25th percentile in the local area is associated with a 1.0 percentage point increase in leaving rates.
3. These associations are smaller for healthcare assistants and clinical support roles, and administrative and clerical roles. A £1,000 increase in full-time annual earnings at the 25th percentile in the local area is associated with a 0.4 percentage point increase in leaving rates for these groups. For the maintenance and works group, the estimated association is even smaller and is not statistically significantly different from zero. Associations vary little by pay band.
4. Other characteristics of local areas correlated with earnings could also affect retention. When we strip out any permanent characteristics of local areas, the association between earnings and NHS leaving rates becomes smaller and not statistically significantly different from zero.
5.There are a number of possible reasons why we do not find a statistically significant effect after stripping out the impact of permanent area characteristics, and we cannot conclusively answer the question whether higher local earnings relative to NHS earnings cause NHS staff members to leave. It may be that there is no underlying causal relationship between pay in the local area and the retention of NHS staff. Alternative explanations include compositional changes in the local workforce driving variation in local earnings, difficulty capturing an effect that unfolds over a longer and/or variable time horizon, or a lack of remaining usable variation after persistent differences in leaving rates across areas are accounted for.
1. Introduction
Recruitment and retention of NHS staff is a pressing issue, with more than 12,500 roles, or one in 11 of all roles in the NHS hospital and community sector, reported vacant in the first quarter of 2023.2 One concern is that the NHS may struggle to attract new, and retain existing, staff if local non-NHS employers offer alternative jobs with higher pay. While this may in principle affect all staff groups, it is likely to be particularly pertinent for lower paid and non-clinical workers, whose skills and training are likely to be more easily transferable to another sector compared to clinical staff (such as doctors and registered nurses) with years of highly specialised training.
In this report, we examine the association between local pay and the retention of NHS staff in the hospital and community sectors in pay bands 1 to 4 under the Agenda for Change framework. Agenda for Change is a harmonised pay and progression framework covering all NHS staff except doctors, dentists, apprentices and some management positions, with limited regional variation in pay for similar roles. As a result, this system offers limited flexibility for NHS employers to react to changing labour market conditions.3 Agenda for Change comprises nine pay bands.
In November 2021, there were more than 630,000 employees in bands 1 to 4, representing 36% of staff directly employed by the NHS in the hospital and community sector. This includes roles of both a clinical (e.g. nursing support staff and healthcare assistants) and non-clinical (such as hospital maintenance, clerical staff and technicians) nature.
We focus on the relationship between local pay and the retention of staff in these pay bands. We use administrative payroll data from the Electronic Staff Record, combined with local earnings data from the Annual Survey of Hours and Earnings for the period between 2014 and 2019, to examine the correlation between NHS leaving rates and measures of local pay across different areas of England. We first document annual leaving rates among six different staff groups between 2014 and 2020. We then explore how annual leaving rates vary geographically, and how this correlates with different measures of earnings in the local area.
2. Data and sample
Our analysis primarily uses the Electronic Staff Record, a payroll dataset covering all staff directly employed by the NHS. This includes those employed in hospital and community settings, working in both physical and mental health. Those working in primary care (e.g. administrative staff in GP practices) and in contracted-out services are not included. The data contain information on each staff member’s role, seniority, workplace, hours, earnings and area of residence for each month between January 2014 and December 2021.
We use the information on staff role to define six subgroups of staff in pay bands 1 to 4:
- nursing – nursing and midwifery staff (e.g. nursing assistants);
- clinical support – healthcare assistants and other clinical support staff;
- maintenance – maintenance and works staff;
- clerical and administrative staff;
- allied health – staff in the allied health professions and ambulance staff;
- technical and scientific staff (e.g. healthcare science assistants), and a small group of other or unknown roles.
Table 1 summarises the demographic characteristics, earnings and hours of staff in each group between 2014 and 2021. The group as a whole, as well as all subgroups except maintenance have large majorities of women. In addition to being more likely to be male, maintenance staff are also substantially older than the rest of the group (an average of 48.6 years old compared to an average age of 42.8 across all other groups). The subgroups of nursing and clinical support staff have more non-UK nationals than all other staff groups, and more non-White staff members than other groups with the exception of technical staff, a group that includes an above-average share of staff members from Asian or British Asian backgrounds.
The six staff groups also differ in their structure with respect to pay bands, which in part reflect the seniority, required skills, and responsibility of roles. A majority of those in nursing and clinical support roles are in band 2, whereas non-clinical roles are more evenly spread out across bands 2 to 4. Few staff members are in band 1, with the highest share – among clinical support roles – still only reaching 14%. Combined with working fewer hours on average, this leads to their earnings being the lowest of the five subgroups, with the reverse being true of maintenance staff.
Table 1. Characteristics of staff in pay bands 1 to 4
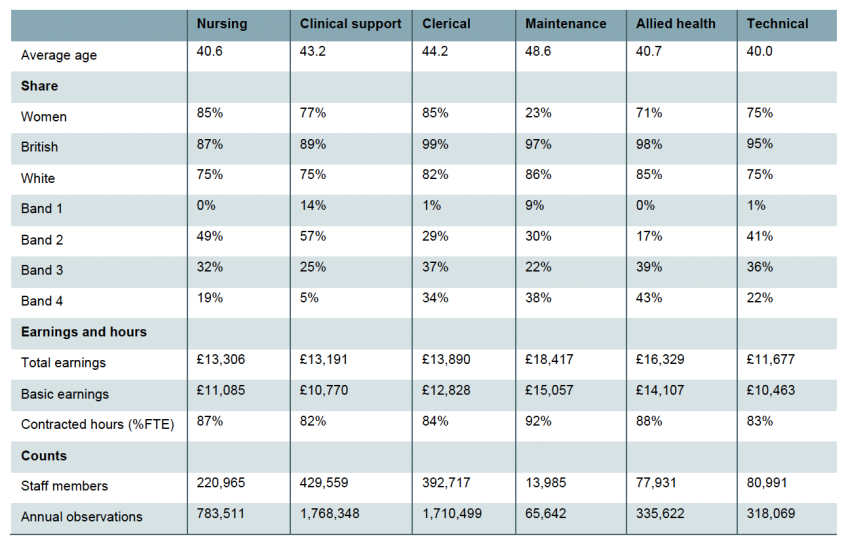
Note: Data from 2014 to 2021. See page 5 for definitions of the groups.
In this report, we focus on workers leaving the NHS hospital and community sector as our main outcome of interest.4 We define a staff member as leaving the NHS hospital and community sector in a given year if they received positive pay (and worked positive hours) in that year but were no longer recorded doing so in the following year (e.g. a worker would be defined as leaving the NHS in 2015 if we observed them working in any month in 2015 but not in any month in 2016).
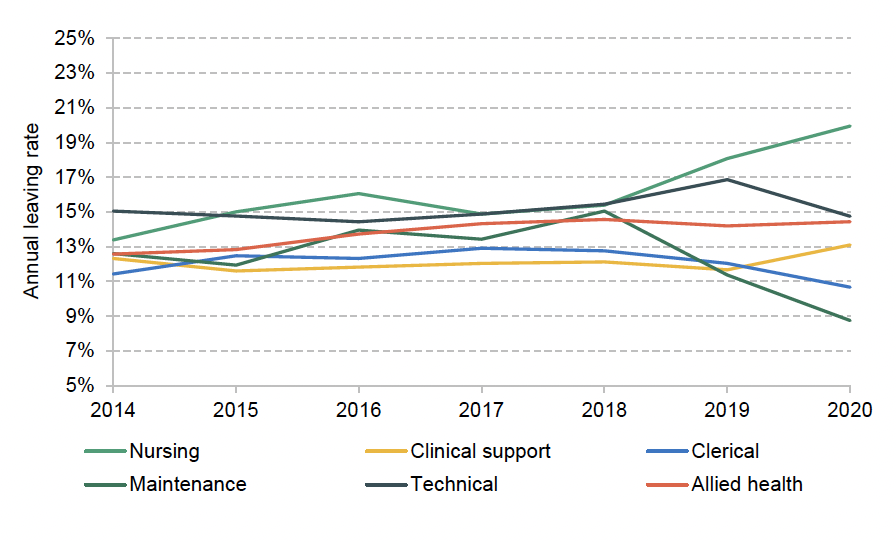
Figure 1 shows the national annual leaving rates for each staff group between 2014 and 2020. Across the entire period, 13% of workers in our sample left the NHS hospital and community sectors each year. There were modest differences between staff groups, with the highest leaving rates over the whole period (16.2%) among nursing and midwifery staff, and the lowest (12.1%) among clinical support workers as well as clerical staff. This was higher than the job-changing rate for all employees recorded in the Annual Survey of Hours and Earnings for the same period (10%). It was also higher than the leaving rate for registered nurses and midwives (Propper, Stockton and Stoye, 2021).
Figure 1. Leaving rates by staff group and over time
In the remainder of the report, we examine how annual leaving rates vary across different areas, and how this relates to earnings among all (not just NHS) employees in these areas. We focus on variation at the travel to work area (TTWA) level. TTWAs are designed to approximate largely self-contained local labour markets and there are 149 TTWAs in England.5 We therefore calculate the average leaving rates among staff living in each TTWA in each year to produce annual leaving rates for staff living in each TTWA between 2014 and 2021.
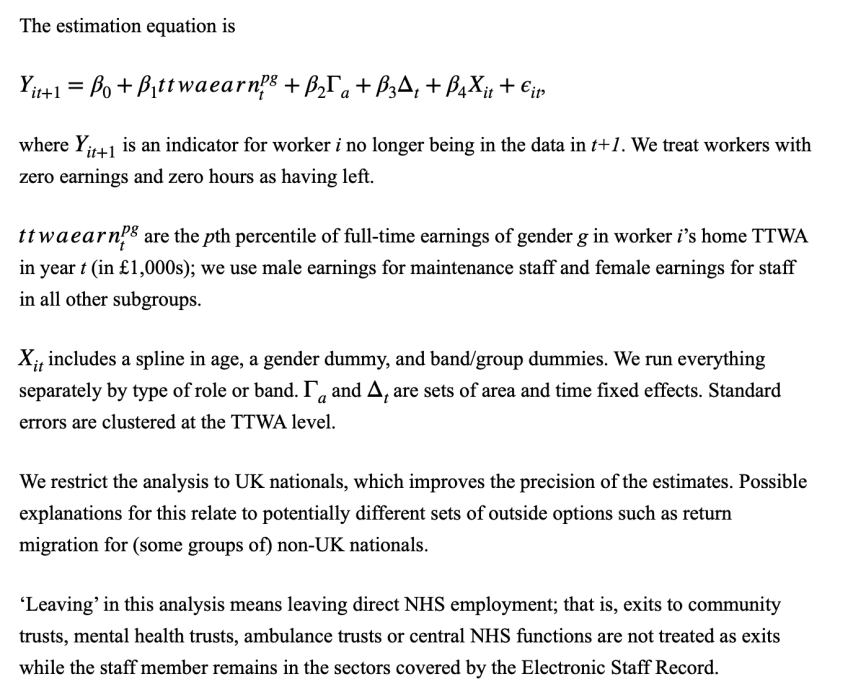
In order to relate leaving decisions to local earnings, we combine NHS leaving rates with data from the Annual Survey of Hours and Earnings on the male and female full-time earnings of employees in each TTWA. To focus on the lower part of the earnings distribution, our main results use the 25th percentile of full-time earnings as a measure of potential earnings in each area (i.e. the amount that a quarter of the employees living in the TTWA earn less than). We focus on this measure of earnings because it is likely to be the relevant part of the earnings distribution for NHS staff in lower-band roles considering leaving their job.6
It is important to note that this measure of local earnings may in itself be influenced by the Agenda for Change pay scales, as NHS employees will be included in the local earnings distribution. This may reduce the size of the estimated association between NHS leaving rates and wages in the local area (as compared to using a measure of non-NHS earnings only) as using this measure may understate the extent to which non-NHS earnings vary across different areas.
3. How do local earnings relate to NHS leaving rates?
We now examine how NHS leaving rates vary across the country, and how this relates to variation in wider earnings. We first document how leaving rates and full-time earnings vary across TTWAs in England. We then examine the correlation between leaving rates and earnings for different staff groups, and whether these relationships change when accounting for permanent or slow-changing factors that could explain persistent differences in leaving rates across different areas, basic staff characteristics (age, gender and pay band), and national trends over time. Finally, we repeat this analysis for staff in different pay bands to see whether these relationships vary by pay band.
Geographical variation in leaving rates and earnings
Figure 2 shows how leaving rates of NHS staff in bands 1 to 4 and local full-time earnings varied across the country during our sample period. The left panel shows average leaving rates among staff living in each TTWA between 2014 and 2020. The right panel shows the 25th percentile of full-time earnings among women living in these areas between 2014 and 2019. Comparing the two maps, it is clear that areas with higher female earnings across all employers – principally in Greater London and in the South of England – tend to also see high rates of staff leaving the NHS hospital and community sectors.
Figure 2. NHS leaving rates and outside earnings in England, average from 2014
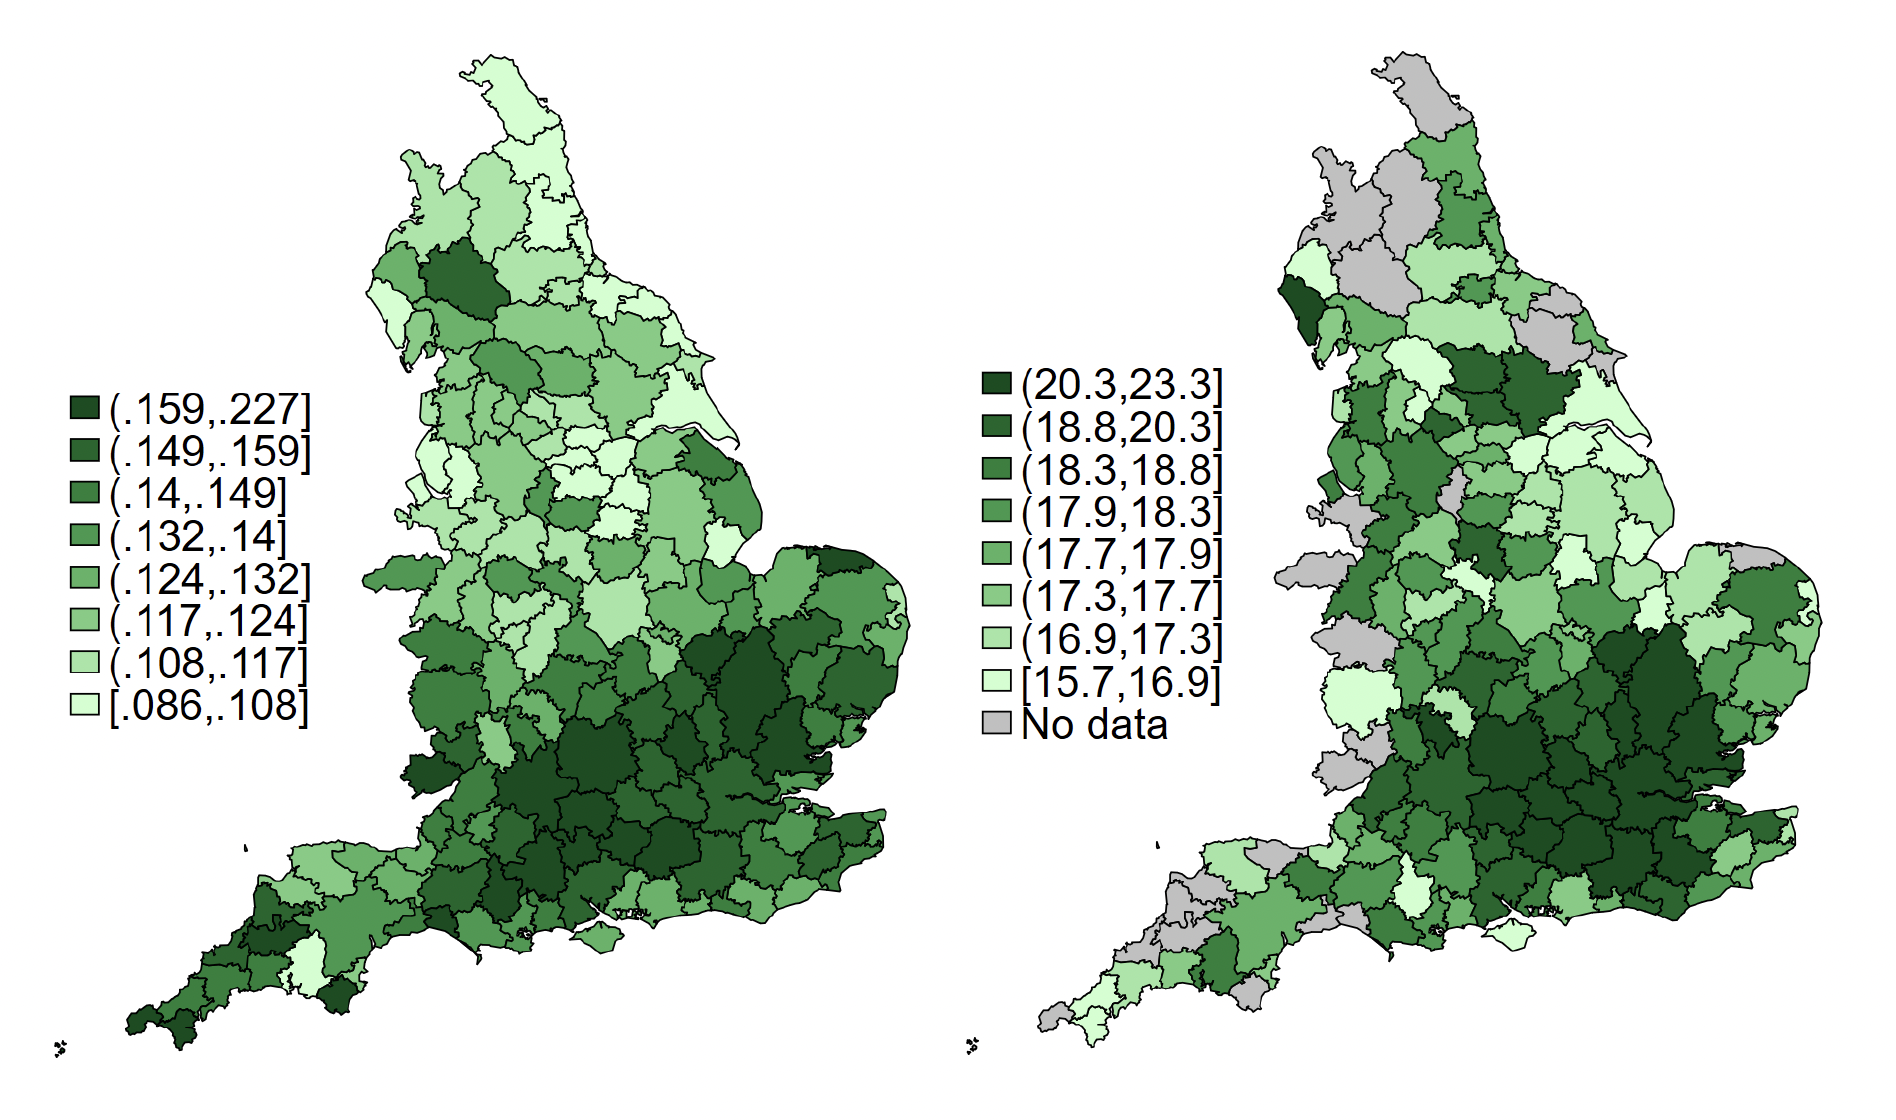
Note: The left-hand map shows annual leaving rates of NHS staff in bands 1 to 4, on average across years from 2014 to 2020. Leaving is defined as leaving the NHS acute and community sectors and central NHS functions. The right-hand map shows the 25th percentile of outside women’s full-time earnings, on average across years from 2014.
How does the relationship between leaving rates and local earnings vary by staff group?
Figure 3 explores this relationship separately for each staff group, plotting leaving rates against the 25th percentile of earnings in a TTWA. In this case, we use gender-specific local earnings, comparing leaving rates among maintenance staff to men’s local full-time earnings in a local area (reflecting that the majority of NHS maintenance staff are men), while using women’s full-time earnings for all other staff groups (where the vast majority are women). The figure shows that the relationship is positive for most staff groups, driven by much higher leaving rates in areas with the highest local earnings: these gradients are strongest for nursing staff, followed by the technical staff, and allied health group. However, for maintenance, there is no evidence of such a positive relationship.
Figure 3. Bottom quartile of outside earnings and leaving rates by staff group
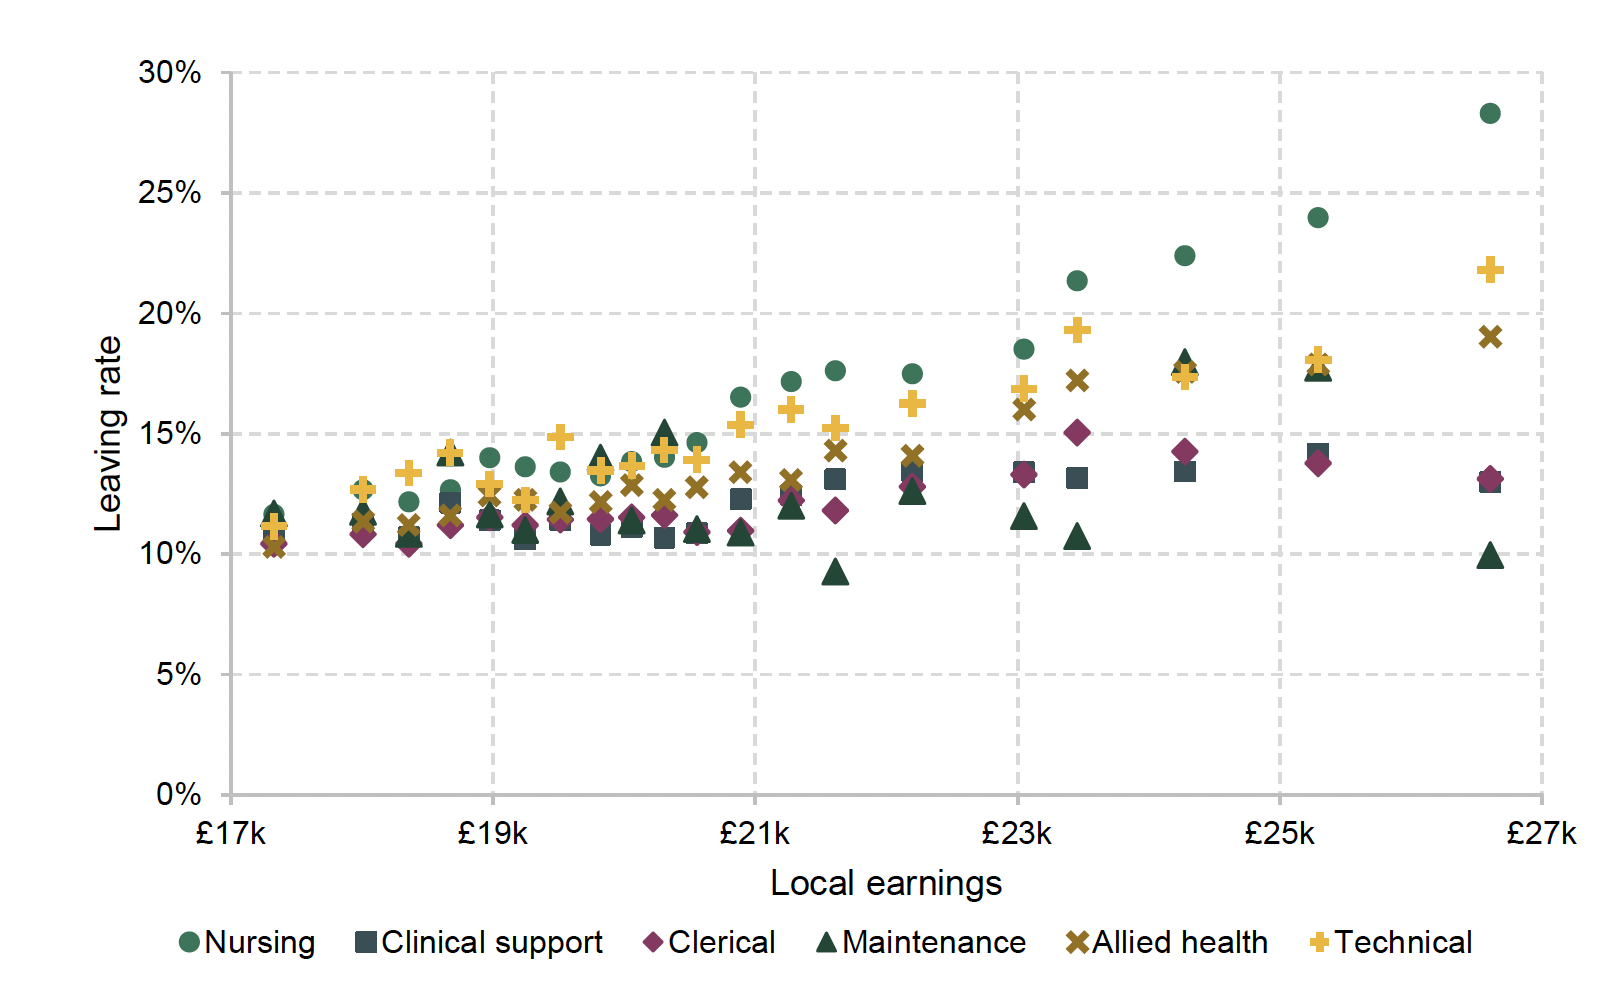
Note: Local earnings are gender-specific 25th percentile of earnings in the TTWA. Markers represent average leaving rates for an interval of local earnings.
Figure 4 quantifies the correlation between local earnings and NHS leaving rates. Technical details of this exercise can be found in the technical appendix. The ‘unconditional’ estimates show, for each staff group, the association between a £1,000 increase in the 25th percentile of female earnings in a given year with the leaving rate over the following year in the same TTWA. Consistent with Figure 3, the associations are strongest among the nursing group and the allied health group: for both these groups, a £1,000 increase in full-time earnings at the 25th percentile is associated with a 1.0 percentage point increase in leaving rates. These associations are statistically significant at the 95% level, and are equivalent to a 6.2% increase in leaving rates in the nursing group, and 7.2% among the allied health staff group, when compared to the average annual leaving rates across the entire period of 16.2% and 13.9% among these groups, respectively. These associations are smaller for the clinical support and clerical subgroups but still statistically significantly different from zero. For the maintenance subgroup, the estimated association is even smaller and is not statistically significantly different from zero.
Figure 4. Between- and within-area associations between higher outside earnings and NHS leaving rates, by staff group
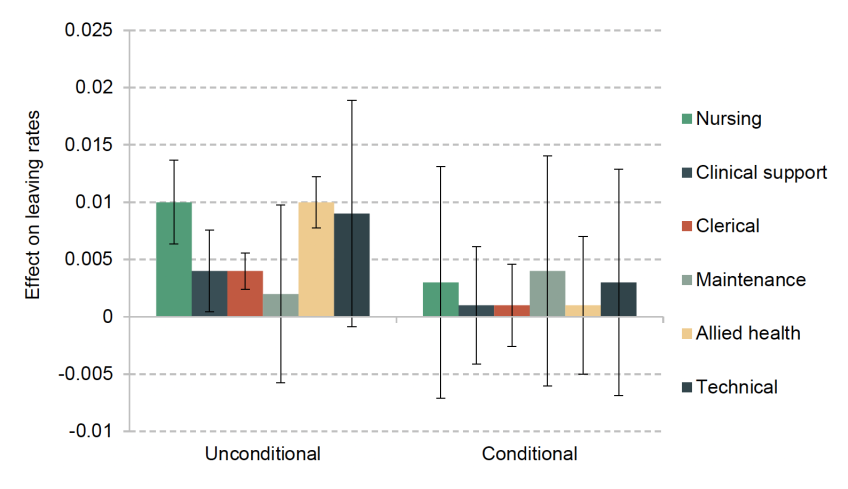
Note: Coefficients and 95% confidence intervals from a regression of leaving rates on the 25th percentile of outside earnings, with and without area fixed effects and basic worker characteristics. For details of the specification, see the technical appendix.
Taken together, this suggests that there is generally a positive relationship between local earnings and leaving rates among NHS staff in bands 1 to 4. However, this does not imply that these differences in earnings cause the differences in leaving rates among NHS staff. Areas with better-paid job opportunities with other employers may also differ from other areas in other related, but distinct, ways. These characteristics could have their own effect on leaving rates. For example, hospitals in prosperous urban areas where non-NHS employers offer higher pay could be busier, making work more stressful. Or people living and working in areas where pay is lower could have different preferences and priorities from those in higher-pay areas.
To take account of any differences across areas that affect leaving rates that are fixed or slowly changing over time, we can also look at changes in leaving rates and pay within the same area. If an increase in outside pay were associated with an increase in leaving rates, then this would give us greater confidence that these permanent or slow-changing economic, social or cultural differences between areas are not driving the association we described in the previous subsection. We can also directly adjust for the observed characteristics of staff (such as age and gender) living in each area that may be correlated both with their decisions to leave the NHS and with the wider economic characteristics of the local area.
The ‘conditional’ estimates in Figure 4 show the result of this exercise (the details of this multivariate regression can be found in the technical appendix). In this case, accounting for staff characteristics and the persistent differences in leaving rates between local areas typically leads to a smaller – and while still positive, no longer statistically significant from zero – estimated association between earnings and leaving rates for all staff groups. The central estimates therefore suggest that short-term changes in general earnings in the local area are not associated with large changes in NHS leaving rates.7 However, these estimates are relatively imprecise, and we cannot rule out some relatively large associations with confidence: for example, the top of the 95% confidence interval is consistent with an association between a change of £1,000 in full-time earnings at the 25th percentile and an increase of 1.4 percentage points in the exit rate among maintenance staff.
It is also worth noting that this does not rule out an effect of earnings opportunities with local non-NHS employers – it could be that these are themselves slow to change. However, we cannot statistically distinguish that effect from other permanent or slow-changing economic, social or cultural factors that are related to, but distinct from, earnings opportunities.
Do results vary by NHS pay band?
We also repeat the analysis separately for staff in different pay bands (rather than different staff groups). Figure 5 shows the results, with a similar pattern to before. When simply looking at the correlation between local earnings and NHS leaving rates, there is a significant positive association between local earnings and leaving rates for all pay bands: the estimated association with a £1,000 increase in the 25th percentile of local earnings ranges between a 0.4 and 0.8 percentage point increase in NHS leaving rates over the next year. However, when controlling for persistent difference in leaving rates between different areas, the estimated associations become not statistically distinguishable from zero, and are smaller in magnitude for all groups apart from band 1.8
Figure 5. Between- and within-area associations between higher outside earnings and NHS leaving rates, by pay band
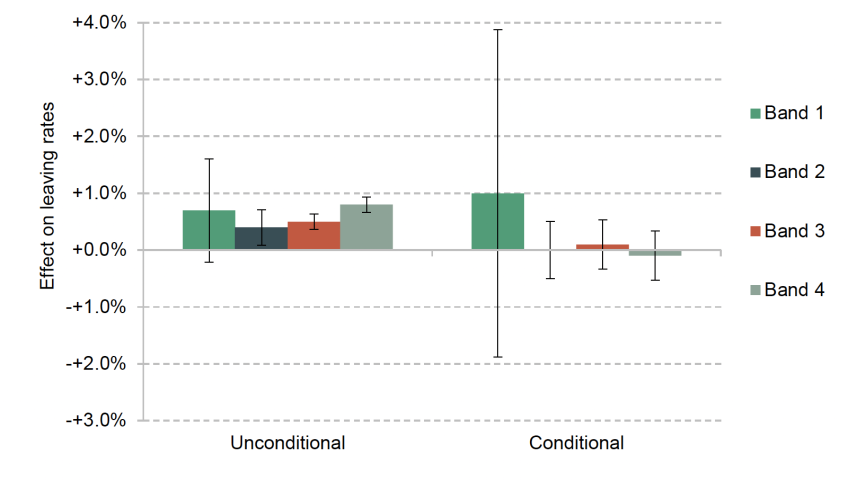
Note: Coefficients and 95% confidence intervals from a regression of leaving rates on the 25th percentile of outside earnings, with and without area fixed effects and basic worker characteristics. For details of the specification, see the technical appendix.
4. Conclusion
The relative value of NHS pay, which is largely determined at the national level with limited options to adjust to local economic conditions, varies across different parts of England due to geographical variation in the level of pay available from non-NHS providers. This could make retention more challenging for areas where outside options – the earnings staff members could achieve with another local employer – are higher.
We examined this relationship for NHS staff in Agenda for Change bands 1 to 4. This includes more than a third of NHS staff in the community and hospital sector, and covers roles such as nursing auxiliaries and junior clerical staff. Their pay ranges approximately from the 10th to the 30th percentile of national full-time earnings.
For this group as a whole, as well as all the subgroups we examined, there is a positive association between leaving rates and full-time earnings in the local area. In other words, more staff in areas with higher average earnings in the wider local jobs market leave the NHS each year compared with areas where average earnings are lower. For our analysis by staff group, we use male full-time average earnings for staff in maintenance roles, and female full-time earnings for all other groups, reflecting the gender composition of the different staff groups.
We find that these relationships typically become smaller and not statistically significant from zero when we adjust for the characteristics of these staff groups and fixed or slow-changing factors that cause persistent differences in retention between areas. However, this does not necessarily mean that the changing relative value of NHS pay compared with other local job opportunities has no impact on retention. The coefficients are, however, quite imprecisely estimated, meaning that we cannot reject effect sizes that would be economically significant.
There are a number of possible reasons for the pattern we find. For example, one driver of changes in local earnings is the composition of the local labour force. If, for example, people leaving a local area are disproportionately in the lowest-paid occupations, this would be reflected in an increase in measured local earnings. However, the wage that a given worker who remains in the local area can command has not changed at all. Changes in local earnings might therefore reflect the changing composition of the local labour force, rather than changing opportunities.
Another possible explanation is that we only measure short-term responses in our analysis, whereas the retention response might plausibly happen over a longer or variable period of time. For instance, it might take time for staff in bands 1 to 4 to observe that the relative value of their earnings has changed, to consider their options, and to apply for and secure another job. How much time this takes might also vary across people and places. All this makes it more difficult to detect the actual relationship.
Finally, it is possible that after stripping out permanent and slow-changing place characteristics, not enough variation remains to identify an effect. This would be the case if local earnings opportunities themselves only change slowly. Especially with a relatively short panel such as is available for this analysis, this might mean that we cannot disentangle the impact of earnings from other slow-changing factors.
Overall, our results show that higher-earnings areas experience poorer retention, but cannot conclusively answer the question whether this is a causal relationship or reflects other differences between areas (and does not conclusively suggest that pay in alternative jobs does not matter for retention of NHS staff). Future work using different data sources – for example, using a longer panel and/or measuring relevant opportunities more directly using typical transitions and data from job adverts – could address some of the issues described and may shed more light on the question.
Endnotes
Authors

Isabel Stockton
Isabel works in the Healthcare sector, and on the public finances. Their research focuses on retaining and developing the NHS workforce.

George Stoye
I completed a PhD at UCL in 2020. My work examines the drivers of variation in the quantity and quality of healthcare provided to different patients.
More from IFS
Understand this issue


Policy analysis


Academic research


