
Downloads
Download report PDF
PDF | 503.38 KB
Executive summary
NHS waiting lists are likely to be a key issue in the forthcoming general election. The current government has made cutting NHS waiting lists one of its key priorities, while one of the Labour party’s five national missions is to ‘get the NHS back on its feet’, including by cutting waiting times. In this IFS pre-election briefing, we outline what has happened to NHS waiting lists (in England, given that health is a devolved responsibility) over the last 17 years – the period for which consistent data are available – and present new scenarios of what could happen to waiting lists over the years to come. We focus on the elective waiting list – the list of people waiting for pre-planned hospital treatment and outpatient appointments. This is what most people mean when they talk about NHS waiting lists, but we also consider a range of other NHS waiting lists and waiting times. Alongside this report, we have updated our interactive online tool that allows you to produce waiting list scenarios under your own assumptions.
Key findings
1. The NHS elective waiting list in England was already growing pre-pandemic, as growth in demand for care outstripped growth in the service’s ability to provide it. The waiting list doubled in a decade from 2.3 million ‘incomplete pathways’ (where the patient has been referred but is waiting for treatment) in January 2010 to 4.6 million in December 2019. Waiting times also increased over this period, particularly the longest waits. The median waiting times for an inpatient treatment increased slightly from 9.2 weeks in January 2010 to 9.6 weeks in December 2019, while the 95th percentile waiting time for an inpatient treatment increased from 23 weeks to 38 weeks over the same period.
2. The elective waiting list grew rapidly during the pandemic, peaking at 7.8 million in September 2023. There are now some signs of hope, with the waiting list falling for three consecutive months at the end of 2023 (falling to 7.6 million in December). This in part reflects seasonal trends: pre-pandemic, the waiting list also tended to fall in winter. But it also reflects that the NHS has successfully increased treatment volumes to above pre-pandemic levels in recent months.
3. The NHS and government have failed to achieve most of their waiting list and waiting time targets in England since 2010. Targets set out in the elective backlog recovery plan of February 2022 to eliminate waits longer than 65 weeks by March 2024 and to increase treatment volumes to 20.9% above pre-pandemic levels in 2024–25 are almost certainly going to be missed. The longer-running target that 92% of patients should receive treatment within 18 weeks of referral has not been met since September 2015 and looks unlikely to be met any time soon.
4. The elective waiting list has risen in every region and area of England, but there are large differences in the extent of the increase. Compared with January 2020, the waiting list in December 2023 was 113% higher in the East of England, but it was 71% higher in the North East & Yorkshire. We see even greater degrees of divergence if we look at smaller geographic areas.
5. The size of the waiting list has risen much more quickly for some clinical specialties than for others. The waiting list for general internal medicine was 2% below its January 2020 level in December 2023, while the waiting list for gynaecology was 109% above, for example.
6. Other NHS waiting lists and waiting times (for things other than pre-planned care) in England were also rising before the pandemic and have risen even faster since it started. In September 2023, 26% of cancer patients waited longer than two weeks from a GP urgent referral to their first consultant appointment, for example, compared with 8% in December 2019 and 4% in December 2009.
7. There is a lot of uncertainty over what could happen to waiting lists in England in the coming years, and so it makes sense to consider a range of scenarios. In the central scenario that we judge most likely, waiting lists would start to fall consistently but slowly from the middle of 2024. But even by December 2027, the waiting list would still stand at 6.5 million in this scenario, remaining far above pre-pandemic levels.
8. In our more pessimistic scenario, in which NHS treatment volumes grow more slowly, waiting lists would remain at roughly their current (elevated) level in the years ahead. In our more optimistic scenario, in which the NHS manages to increase treatment volumes at a faster rate, waiting lists could fall more quickly and reach 5.2 million by December 2027, though this would still be above pre-pandemic levels. We therefore assess it to be very unlikely that waiting lists will reach pre-pandemic levels over the next four years. Readers are encouraged to use the accompanying online tool to test the sensitivity of this conclusion to alternative assumptions.
Introduction
The government has made cutting NHS waiting lists one of its five key priorities (Prime Minister’s Office, 2023). Similarly, one of the Labour party’s five national missions is to ‘get the NHS back on its feet’, including by cutting waiting times (Labour Party, 2024). NHS waiting lists and the NHS more generally are a key public concern, with health reported as the second most important issue facing the country and 80% of the public reporting that the government is handling the NHS badly (YouGov, 2024a and 2024b). It is therefore highly likely that NHS waiting lists will be an important part of the debate during the upcoming general election.
In this IFS pre-election briefing, we discuss the past and future of NHS waiting lists. In the first part, we outline five key facts about past NHS waiting list performance, including pre-pandemic trends, changes during the pandemic and regional variation. In the second part, we produce a range of scenarios for what could happen to NHS waiting lists over the next four years under different assumptions. Alongside this report, we have updated our prize-winning online tool that allows you to produce your own waiting list scenarios under your own assumptions1 .
For most of this report, we focus on the elective waiting list – that is, the list of people waiting for pre-planned hospital treatment or outpatient appointments. This is what politicians, experts and the general public normally mean when they talk about ‘NHS waiting lists’. But this elective waiting list is not the only NHS waiting list that matters, and so we also briefly outline what has happened to a range of other NHS waiting lists (e.g. for diagnostic tests).
Health is a devolved matter, and our objective here is to provide context relevant for the UK-wide general election expected this year. Our analysis therefore focuses on the NHS in England, for which responsibility lies in Westminster. Devolved parliament elections in Scotland, Wales and Northern Ireland are more relevant for NHS performance in those nations of the UK2 .
Five facts about past waiting list performance
In this section, we set out five key facts about NHS waiting list performance to date. We mainly focus on the elective waiting list, and cover trends during the 2010s, changes since the start of the pandemic, performance against various waiting list targets, regional and country variation, and differences by medical specialty. We also briefly consider several other NHS waiting lists.
1. The elective waiting list was growing for many years prior to the COVID-19 pandemic
The NHS elective waiting list fell between 2007 and 2009, and then started to rise from 2012 onwards. The NHS therefore entered the pandemic with an already growing waiting list. Median waiting times only rose very slightly during this period, but the 95th percentile waiting time rose by much more, which points to a growing ‘long tail’ of people waiting a long time for treatment.
Figure 1 shows the size of the elective waiting list between 2007 (when comparable data start) and 20233 . Although commonly referred to as the number of people waiting for treatment, the waiting list actually measures the number of incomplete care pathways (i.e. the number of referrals for which patients are still waiting to start treatment). It is possible for one person to have multiple incomplete pathways if they need multiple sets of pre-planned treatment, although until recently data on the number of unique individuals waiting on the list were not available.
Between 2007 and 2009, the waiting list fell rapidly – from 4.2 million in August 2007 to 2.4 million in December 2009, a 44% reduction in just over two years. In 2010 and 2011, the waiting list remained steady, before starting to rise from 2012. In December 2019, on the eve of the COVID-19 pandemic in the UK, there were 4.6 million incomplete pathways – 91% higher than in January 2012 (2.4 million). For context, the English population grew by around 5% over that period. Compared with January 2010, the waiting list was 97% higher – it had doubled.
The waiting list rose between 2012 and 2019 because the number of people joining the list, who were mainly referred onto the list by their GPs, exceeded the number of people leaving the list, who mainly left after receiving treatment. Between 2016 (when data on the numbers of new joiners start) and 2019, there was an average of 1.69 million people joining the list each month and an average of 1.67 million people leaving the list each month (of whom 1.38 million each month, or 83%, were treated). This meant that the list grew on average by 20,000 per month over the period. Put another way, the number being treated from the list was growing over time, but not quickly enough to exceed the number joining the list and so prevent the waiting list from growing.
As the size of the waiting list grew, so too did average waiting times. Figure 2 shows the median waiting time for treated patients between 2007 and 2023, split by whether they were treated as an inpatient or an outpatient. Median waiting times fell rapidly in 2007, and then were relatively flat between 2008 and 2012, before starting to rise in 2013. In December 2019, the median patient treated from the waiting list as an inpatient waited 9.6 weeks, while the median patient treated as an outpatient waited 6.0 weeks. This was 0.5 weeks (5.0%) and 1.1 weeks (21.9%) longer than in January 2010, respectively.
The median is just one measure of waiting times, capturing the average length of time that an individual might have to wait. Figure 3 instead shows the 95th percentile waiting time, one measure of the longest waits in the system. In December 2019, the 95th percentile patient treated as an inpatient waited 37.8 weeks, while the 95th percentile outpatient waited 27.6 weeks. This was 14.5 weeks (62.4%) and 12 weeks (77.3%) longer than in January 2010, respectively. The 95th percentile therefore grew by a much larger percentage than median waiting times. This points to a growing ‘long tail’ of people waiting a very long time for treatment.
2. The elective waiting list has grown faster since 2020, but there are signs of hope
Waiting lists grew rapidly during the pandemic. This is because the number of patients being treated from the waiting list fell sharply and then remained consistently below pre-pandemic levels until 2023. In recent months, the waiting list has started to fall. Part of this reflects seasonal patterns, but part of it reflects an increase in the number of patients the NHS is treating.
Perhaps counterintuitively, the elective waiting list fell for the first few months of the pandemic (Figure 1). Although the number of patients receiving pre-planned treatment fell as hospitals prioritised treating COVID-19 patients, the number of patients being referred onto the waiting list fell even further, causing the list to fall for several months.
From June 2020, the elective waiting list started rising rapidly, growing on average by 80,000 per month up to December 2023, much faster than the pre-pandemic growth rate of 20,000 per month. In December 2023, there were 7.6 million incomplete pathways (made up of 6.4 million unique individuals), compared with 4.6 million in December 2019.
This increase in the waiting list was driven by the simple fact that the number of new patients joining the list was greater than the number leaving the list. On average between June 2020 and December 2023, 1.56 million patients joined the list each month and 1.48 million patients left it. However, as Figure 4 shows, both the number of patients joining the waiting list and the number of patients receiving treatment have remained stubbornly below their pre-pandemic levels, at least until 2023.
There are many reasons why the NHS treated fewer patients from the waiting list for much of this period. The continued pressure from treating COVID-19 patients is perhaps central among these, but other factors (such as changes in staff composition and experience, and a deteriorating physical NHS estate) have also likely played some role. This struggle to increase treatment volumes comes despite large increases in NHS funding and staffing since the start of the pandemic4 .
The low numbers joining the NHS waiting list also represent a major puzzle. Had the number of new joiners remained at pre-pandemic levels, or even grown over time, the waiting list would be many millions higher than it currently is (Stoye, Warner and Zaranko, 2021). This has, in some sense, shielded the NHS from most of the consequences of its struggle to increase treatment volumes. As Figure 4 shows, the number of people joining the waiting list has returned in 2023 to levels much closer to those seen pre-pandemic. However, it has not risen substantially above pre-pandemic levels, as we might have expected if many of those who missed being referred earlier in the pandemic were now joining the list.
It remains an open question why so many fewer people are joining the list than we would expect. It could be that patients are not joining the list because they cannot obtain a referral. It could be that they have obtained care elsewhere (e.g. in the private sector). It could be that they are put off by the prospect of a long wait and so choose not to seek care. It could be that some of those who put off seeking care died before ever joining the waiting list (or, more happily, saw their ailment resolve itself). It seems likely that all these reasons (and others) have played a role, but it is difficult to place a weight on each with the data available (not least because, by definition, those who do not join the list do not appear in the waiting list data). It also remains to be seen what the longer-term consequences will be for the health of patients who might otherwise have received treatment.
In more recent months, there have been some signs of hope. The waiting list fell for three consecutive months between October and December 2023, a trend that may well continue into 2024. This in part is explained by seasonality: the NHS waiting list also tended to fall over the winter in pre-pandemic years (Figure 1). But it is also the result of an increase in NHS treatment volumes relative to pre-pandemic levels (Figure 4). As we will discuss in the second part of this report, if NHS treatment volumes continue to grow relative to pre-pandemic levels, it is likely that NHS waiting lists will continue to fall over time (though perhaps not in a steady and sustained fashion until later in 2024).
3. Most recent elective waiting list targets have been missed
The NHS and government have failed to achieve most of their recent waiting list targets. Ongoing targets to increase elective activity to 20.9% above pre-pandemic levels by 2024–25 and to eliminate waits of more than 65 weeks seem almost certain to be missed.
The government and the NHS have set a range of targets for the elective waiting list in recent years. These are on top of the pre-existing targets (or ‘standards’) included in the NHS Constitution. We now evaluate whether these targets have been met and assess the likelihood that outstanding targets will be achieved. Table 1 summarises each target and our assessment.
Table 1. Elective waiting list targets and assessment of success
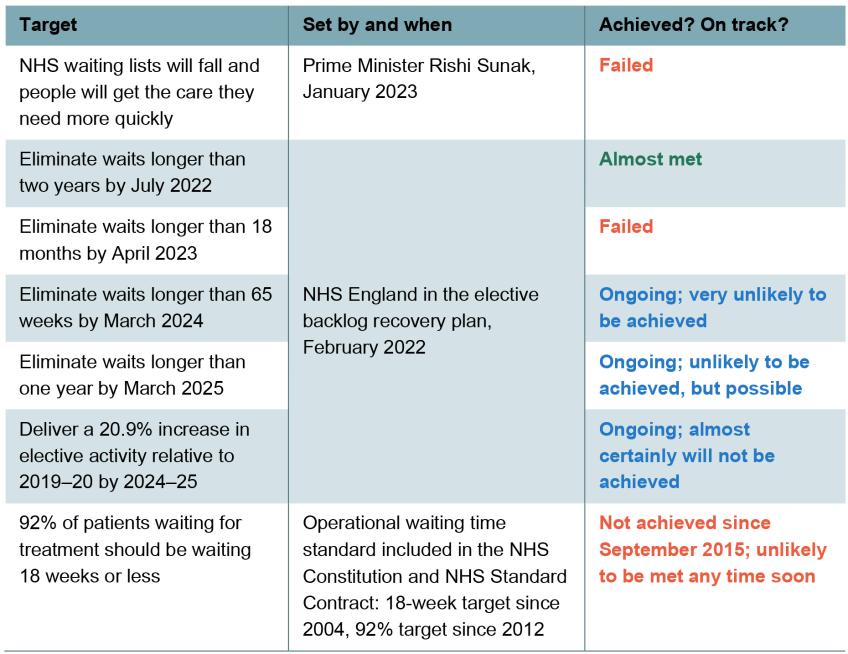
Note: See discussion in the text for the justification for each assessment.
Source: NHS England, 2022 and 2024a; Prime Minister’s Office, 2023.
The most recent elective waiting list target was made by the Prime Minister in January 2023 when he outlined his five key priorities for 2023. His fourth priority was that ‘NHS waiting lists will fall and people will get the care they need more quickly’. Although the elective waiting list did start falling by the end of 2023, it was still 390,000 higher in December 2023 than in January 2023. As the Prime Minister himself recently admitted, this means that the government failed to achieve this target5 .
Targets to eliminate very long waits
In the elective backlog recovery plan, published in February 2022, NHS England set a number of elective waiting list targets. Four of these objectives focused on long waiters, which we consider first. For reference, Figure 5 shows the evolution of the number of patients waiting for relevant lengths since 2021 and the dates of the past targets.
The first long-waiter target was to eliminate waits longer than two years by July 2022. On this date, there were still 2,890 incomplete pathways of more than two years. In the strictest sense, this target was therefore not met. But the NHS achieved a very large reduction in the number waiting this long, with the level in July 2022 88% lower than the peak of 24,424 pathways in January 2022 (around the time the target was set). Perhaps more importantly, the number waiting more than two years has continued to fall, and in December 2023 there were just 282 pathways longer than two years. In other words, although the letter of the target was not met, the NHS continued to make steady progress and all-but-eliminated waits of more than two years by early 2023. We therefore view the NHS as having essentially met this target, if a little behind schedule. Those patients still waiting more than two years are likely to be very complex and specialist cases where there is limited treatment capacity6 .
The second target was to eliminate waits over 1.5 years by April 2023. But on this date, there were still 10,954 incomplete pathways between 1.5 and 2 years. This was 90% lower than the peak of 112,850 in August 2021. Concerningly, and importantly, the number waiting between 1.5 and 2 years has started to rise again, reaching 12,882 in December 2023. Given the considerable number of incomplete pathways over 1.5 years at the deadline, and given that progress has stalled and the number has started to rise again, we judge the NHS to have failed to achieve this target.
There is still some time left on the clock for the final two targets that relate to long waiters. These state that waits longer than 65 weeks (1.25 years) will have been eliminated by March 2024 and that waits longer than a year will have been eliminated by March 2025.
Starting with the first incomplete target, the NHS still has three months left. In December 2023, there were still 85,210 waiting between 1.25 and 1.5 years. In our view, it is very unlikely that the NHS can reduce this rapidly in three months, and so we expect this target to be missed. Indeed, it has been reported that NHS England has agreed a September 2024 deadline for this target with some hospital trusts and is trying to negotiate a later deadline with the government (Illman, 2024).
There is still over a year to achieve the final long-waiter target. In December 2023, there were 239,076 incomplete pathways with waits between 1 and 1.25 years, and in total 337,450 incomplete pathways with waits of more than one year. It is possible that the NHS will substantially reduce the number waiting this long, although it will be a very significant challenge, and we certainly do not expect this to fall to zero by March 2025. Even in December 2019, on the eve of the pandemic, there were 1,699 incomplete pathways over a year. We therefore assess this target to be unlikely to be achieved, but it is certainly possible the NHS will make significant progress towards it.
Targets to increase treatment rates
Perhaps the most important target in the elective backlog recovery plan focused on activity rather than long waiters. This target stated that the NHS would increase elective treatments to 30% above pre-pandemic levels by 2024–25. After accounting for increases in activity that prevented people being referred onto the list in the first place (advice and guidance services), this target required the NHS to increase treatment volumes from the waiting list to 20.9% above pre-pandemic levels by 2024–25. Treatment volumes have only recently started to consistently nudge above pre-pandemic levels (Figure 4) and are nowhere close to where we would expect them to be if the NHS were on track to deliver on this ambition. As we will discuss in the second part of this report, to achieve the target now would require treatment volumes to grow at 18.8% per year, which seems highly implausible. We therefore think it almost certain that the NHS will not achieve this target.
Longer-running targets to reduce waiting times
The final target we consider comes from before the pandemic, as part of the NHS Constitution. This target states that patients should receive treatment within 18 weeks of referral. From 2012, the operational target has been that 92% of patients should be treated within 18 weeks. However, this target was last achieved in September 2015. In December 2019, only 84% of patients were treated within 18 weeks, and this had fallen to 57% by December 2023. This target has therefore not been achieved in over eight years, and it will likely take years for it to be achieved again.
4. There are large regional and specialty differences in elective waiting list performance
The elective waiting list has risen in every region and commissioning area of England. But there have been large differences between regions and areas. The waiting list has grown by less in the South West, London and the North East & Yorkshire than it has in the East of England and the North West. There are also large differences by clinical specialty. Taking the most extreme differences, the waiting list for general internal medicine is slightly below the pre-pandemic level, while in gynaecology the waiting list has more than doubled since January 2020.
We have so far focused on the national elective waiting list. But the COVID-19 pandemic has had a different impact on the waiting list of each hospital, local area and region of England, and has had different impacts on the waiting lists for treatments under different clinical specialties. What matters for individuals is the waiting list they will actually face, rather than the national average. In this subsection, we therefore discuss differences in waiting lists by region, local area and clinical specialty. Throughout, we focus on the areas where people live, rather than where they receive hospital treatment.
We first consider regional differences. Figure 6 shows the change in the elective waiting list since January 2020 in the seven NHS regions of England. The elective waiting list has risen in all regions since the start of the pandemic, but not evenly. At the extremes, the elective waiting list was 113% higher in December 2023 than January 2020 in the East of England, compared with 71% higher in the North East & Yorkshire and 74% higher in London and the South West.
There are several factors that could explain large regional differences in waiting lists. Hospital activity has recovered from the pandemic at different rates in different regions. There are also likely differences in the number of patients joining the waiting list, in part because of differences in need for elective treatment (driven by differences in things such as population growth and population health). But this analysis highlights that individuals living in different regions have experienced substantially different changes in the size of the waiting list in their area.
Figure 7 repeats this analysis for selected local commissioning areas, equivalent to old Clinical Commissioning Group (CCG) areas. As with regions, the waiting list is higher in every area, but there are large differences. In December 2023, the waiting list was 28% higher in Calderdale, West Yorkshire than it was in January 2020, but 145% higher in St Helens, Cheshire & Merseyside. The waiting list grew by 122% in Lincolnshire, by 72% in Sussex and by 49% in Gloucestershire. In other words, there is a great deal of variation across different parts of England.
Finally, Figure 8 shows differences in waiting list growth since January 2020 by the clinical specialty for which individuals are awaiting treatment. There is substantial variation between different clinical specialties. At one extreme is general internal medicine, for which the waiting list was actually 2% below pre-pandemic levels in December 2023. At the other extreme is gynaecology, for which the waiting list was 109% above its level in January 2020.
5. Other NHS waiting lists have also grown substantially
Just like the elective waiting list, other NHS waiting lists were getting worse in the 2010s and then have worsened even further during the pandemic. These include the waiting list for diagnostic tests (although this has flatlined in 2023), waits for cancer treatment and waits at A&E departments.
Although the elective waiting list is what most people mean when they refer to the NHS waiting list, the NHS has several other important waiting lists. We now consider how these other waiting lists have changed over time, as well as other measures of waiting time performance.
We first consider the waiting list for diagnostic tests, shown in Figure 9. This includes people waiting for MRI and CT scans, as well as colonoscopies and a range of other diagnostic tests. Some of these patients will also be on other NHS waiting lists, such as the elective waiting list (discussed above) or the waiting list for cancer treatment (discussed below). Waits for diagnostic tests were another major focus of the elective backlog recovery plan.
As with the elective waiting list, the waiting list for diagnostic tests was rising pre-pandemic, effectively doubling from 490,000 in January 2010 to 1.0 million in December 2019. Since the start of the pandemic, the waiting list for diagnostic tests has grown faster, and in December 2023 there were 1.6 million incomplete diagnostic tests, an increase of 55% from December 2019. However, the diagnostic waiting list remained relatively flat in 2023. This is in part because the NHS delivered 11% more diagnostic tests in 2023 than in 2019. This may be because of the success of community diagnostic hubs and other improvements in diagnostics set out in the elective backlog recovery plan. Nonetheless, 3.8 million fewer diagnostic tests were delivered between March 2020 and December 2023 than we would have expected based on activity levels in 2019.
Another important area covered by the elective backlog recovery plan was cancer care. However, NHS England has recently changed how it measures cancer performance, making it harder to consistently examine how waiting has changed over time. We therefore focus on the old targets with data that run until September 2023. Figure 10 shows the share of cancer patients waiting longer than three selected targets.
The blue line shows the share of cancer patients waiting more than two months from a GP urgent referral to first treatment. The operational target is that no more than 15% of patients should wait longer than this. The share of patients waiting longer than two months was already rising pre-pandemic, and it reached 40% in September 2023, compared with 22% in December 2019.
The green line shows the share of cancer patients waiting longer than two weeks from a GP urgent referral to their first consultant appointment. The operational target is that no more than 7% of patients should wait longer than two weeks. This was last achieved in May 2020 (in the midst of the first wave of the pandemic) and, prior to that, February 2019. Since then, performance has deteriorated. In September 2023, 26% of patients waited longer than two weeks, compared with 8% in December 2019.
The yellow line shows the share of cancer patients waiting more than one month between a decision to treat and the first treatment. For this target, the objective is that no more than 4% of patients should wait this long, which was last achieved in December 2020. In September 2023, 10% of patients waited longer than a month.
Across all three selected cancer waiting targets, then, performance was worsening prior to the start of the pandemic and has worsened substantially since then. At the same time, there has been a large increase in the number of cancer patients being treated. For example, there were 2.2 million patients seen on a ‘two-week wait’ pathway from GP referral to consultant appointment in January to September 2023. This was 26% higher than the number of patients seen in the same period in 2019. The fact that waiting times have been rising despite a considerable increase in activity suggests that the need for cancer care is rising even more quickly.
Although not a waiting list per se, people must also wait for care in accident & emergency (A&E) departments. Figure 11 shows the percentage of A&E arrivals who must wait more than four hours between arrival and admission, transfer or discharge. The operational standard introduced in 2010 stated that no more than 5% of patients should wait this long.
Performance against the four-hour target was worsening pre-pandemic, with 31% of attendances waiting more than four hours in December 2019, compared with 8% in December 2010. Since the start of the pandemic, things have got worse still, with 45% of patients waiting more than four hours in December 2023.
A measure of even more extreme waits is waits between the decision to admit and actual admission. In December 2023, there were 148,300 patients spending more than four hours waiting between the decision to admit and admission, and 44,000 waiting more than 12 hours. This was 1½ times and over 18 times more than in December 2019, respectively (when the number waiting more than four hours was 98,500 and the number waiting more than 12 hours was 2,400).
What could happen over the next four years?
The outlook for waiting lists
There is considerable uncertainty over what could happen to waiting lists in the coming years. In our central scenario, using the assumptions we judge to be most plausible, the waiting list would rise slightly in early 2024, before starting to fall. This fall, although consistent, would be slow and would mean that waiting lists would still be far above pre-pandemic levels at the end of 2027.
We now turn to the future. Many factors matter for the evolution of NHS waiting lists, and there is a lot of uncertainty over what could happen to the elective waiting list in the coming years. In this section, we outline several new scenarios for waiting lists and the assumptions that underpin them8 . Alongside this report, we have updated our interactive online tool that allows you to produce waiting list scenarios with your own assumptions.
Our range of assumptions
Our model of waiting lists requires two key assumptions. The first is what happens to the number of patients being treated from the waiting list each month, which will be determined by the extent to which the NHS can increase treatment capacity. The second is what happens to the number of patients joining the waiting list, which will depend on growth in the demand for care and how easily patients can join the waiting list9 . Together, these will determine what happens to the waiting list in months and years to come.
Context and starting points
Our starting points for these assumptions are official NHS projections and targets. For the number of new patients joining the waiting list, we start from the modelling in the NHS workforce plan (NHS England, 2023a), which suggests that demand for acute care will grow by 2.9% per year on average between 2021–22 and 2036–3710 . For the number of patients being treated from the waiting list, one possible starting point would be the target in the elective backlog recovery plan for activity to be 20.9% above pre-pandemic levels in 2024–25. However, this would require an 18.8% annual growth rate in treatment volumes – a pace of increase that we judge implausible. We therefore turn to an alternative, lower (and in our view more realistic) assumption.
Another important reference point is what happened to waiting lists pre-pandemic. Between 2016 and 2019, the number of patients treated from the waiting list grew by an average of 2.4% per year. Over the same period, the number of patients joining the waiting list grew by an average of 2.0% per year11 .
Scenario assumptions
Because of the uncertainty over how many patients will join the list and how many patients will be treated from the list, we produce three scenarios. Table 2 summarises the assumptions we make for each of these. They are not intended to capture the full range of potential outcomes, but instead reflect our judgements of plausible outcomes. We have updated our interactive online tool that allows you to create scenarios based on your own assumptions12 .
Table 2. Assumptions for each waiting list scenario
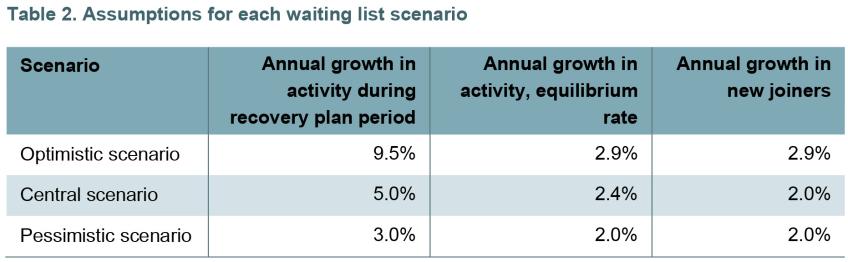
In our central scenario, we assume that treatment volumes grow by 5.0% per year over the remaining period covered by the elective backlog recovery plan (2023–24 and 2024–25). This is far below the 18.8% that would be required to achieve the plan’s headline activity target, but faster than the pre-pandemic trend. This is because, guided by recent experience, we expect the NHS to continue to make significant progress in increasing activity levels, but not enough for it to deliver on its original ambitions.
From 2025–26 onwards, we assume that the NHS has returned to a new equilibrium and that treatment volumes will grow at the pre-pandemic growth rate of 2.4% per year. Figure 12 shows what this would imply for treatment volumes. This 2.4% growth rate is below what is implied by the workforce plan, reflecting our expectation that the NHS will struggle to recruit the number of staff set out in the plan and will continue to struggle to translate higher levels of staffing into higher treatment volumes.
Because waiting lists will remain high, in our central scenario we assume that there is continued rationing of access to the waiting list. We therefore assume that the number of new joiners grows by 2.0% per year, below the 2.9% per year assumed in the workforce plan and equal to the growth rate pre-pandemic.
In our optimistic scenario, we assume that the NHS recovers faster than in our central scenario, achieving a 9.5% growth rate in treatment volumes per year up to 2024–25, roughly half of what would be required to achieve the backlog recovery plan objective (discussed earlier in this report), but still highly ambitious. After that, we assume that treatment volumes grow by 2.9% per year, in line with the objectives in the long-term workforce plan. We assume that the number of patients joining the list is responsive to the improvement in performance, perhaps because GPs are more likely to refer patients when the list is falling, and therefore grows at 2.9% per year as forecast by the workforce plan.
In our pessimistic scenario, we assume that the NHS recovers more slowly than in our central scenario, and activity grows by just 3% per year during the remaining period covered by the elective backlog recovery plan. From 2025–26 onwards, we assume that treatment volumes grow by 2% per year, slower than the pre-pandemic trend rate. This reflects the risk that the NHS is unable to fully implement its workforce plan, including the required increases in productivity. We assume that the number of new joiners remains constrained by the low treatment volumes and that demand grows at 2.0% per year as in our central scenario.
Waiting list scenarios
Given this set of assumptions, Figure 13 presents each scenario for waiting lists. These reflect our own judgements about what could plausibly happen to waiting lists. Readers are encouraged to produce their own scenarios using the online tool released alongside this report13 .
The yellow line shows our central scenario. Following the decrease in the final months of 2023, this suggests that waiting lists will rise slightly again at the start of 2024, before starting to fall consistently from June 2024. Compared with the actual level of 7.6 million at the end of 2023, waiting lists would fall to 7.4 million by the end of 2024 and 7.0 million by the end of 2025. At the end of our model period, December 2027, the waiting list would stand at 6.5 million, still far above its pre-pandemic level. In our central scenario, the waiting list would therefore fall over the next four years, but this fall would be slow and the waiting list would remain substantially above pre-pandemic levels even at the end of 2027.
The purple line shows our pessimistic scenario. Under these assumptions, the waiting list remains approximately constant over time, just fluctuating with the seasonal patterns of activity and referral. Even at the end of 2027, in this scenario the waiting list would stand at 7.6 million.
The blue line shows our optimistic scenario. In this scenario, waiting lists fall considerably faster than in our central scenario, reaching 7.1 million at the end of 2024 and 6.2 million at the end of 2025. By December 2027, the waiting list would be 5.2 million in the optimistic scenario, still above the pre-pandemic level but 1.3 million lower than in our central scenario.
Conclusion
NHS waiting lists are, and will continue to be, a major policy issue. Our analysis suggests that the next government may well inherit a falling waiting list: our central scenario would see the waiting list start falling in a consistent fashion from the summer of this year. But the task of getting the waiting list back to pre-pandemic levels could require more than one parliament.
Setting out targets and ambitions is one thing. Delivering on them is another. The targets and ambitions laid out in the February 2022 elective backlog recovery plan were always intended to be stretching. Their creators can be forgiven for not foreseeing the spike in energy prices and wider costs, nor the extended period of strike action that has undoubtedly hindered efforts to ramp up hospital activity and reduce waiting lists. But the fact remains that the numbers waiting a very long time for treatment have not come down as intended, and NHS hospitals have struggled to increase treatment volumes by anything like the required amount in the period since the plan was published. If it were not for the fact that the number of patients joining the waiting list has stayed surprisingly low – a puzzle and a concern in and of itself – the waiting list would have climbed even higher.
If bringing down waiting lists quickly is a priority, then the next government will very likely need to dedicate additional funding to the health service. In a tight fiscal environment, that will pose challenges and could require some eye-wateringly tough choices elsewhere. Funding is also not the be-all and end-all. It is difficult to see any path to a meaningful reduction in waiting lists that does not include a substantial increase in NHS productivity. Finding ways to achieve that ought to be a policy priority, whoever triumphs in the general election.
References
Freedman, S. and Wolf, R., 2023. The NHS productivity puzzle: why has hospital activity not increased in line with funding and staffing? Institute for Government, https://www.instituteforgovernment.org.uk/publication/nhs-productivity.
Illman, J., 2024. NHSE seeks to ease key elective target. HSJ, https://www.hsj.co.uk/quality-and-performance/nhse-seeks-to-ease-key-elective-target/7036549.article.
Labour Party, 2024. Let’s get Britain’s future back. https://labour.org.uk/wp-content/uploads/2024/01/Missions-Document-Lets-Get-Britains-Future-Back.pdf.
NHS England, 2022. Delivery plan for tackling the COVID-19 backlog of elective care. https://www.england.nhs.uk/coronavirus/wp-content/uploads/sites/52/2022/02/C1466-delivery-plan-for-tackling-the-covid-19-backlog-of-elective-care.pdf.
NHS England, 2023a. NHS long term workforce plan. https://www.england.nhs.uk/publication/nhs-long-term-workforce-plan/.
NHS England, 2023b. Cancer waiting times (CWT statistics up to September 2023). https://www.england.nhs.uk/statistics/statistical-work-areas/cancer-waiting-times/#cwt-statistics-up-to-september-2023.
NHS England, 2024a. Consultant-led referral to treatment waiting times data. https://www.england.nhs.uk/statistics/statistical-work-areas/rtt-waiting-times/.
NHS England, 2024b. Monthly diagnostic waiting times and activity. https://www.england.nhs.uk/statistics/statistical-work-areas/diagnostics-waiting-times-and-activity/monthly-diagnostics-waiting-times-and-activity/.
NHS England, 2024c. A&E attendances and emergency admissions. https://www.england.nhs.uk/statistics/statistical-work-areas/ae-waiting-times-and-activity/.
Phillips, D. and Warner, M., 2024. Scottish Budget: healthcare spending, staffing and activity. IFS Report R298, https://ifs.org.uk/publications/scottish-budget-healthcare-spending-staffing-and-activity.
Prime Minister’s Office, 2023. Prime Minister outlines his five key priorities for 2023. https://www.gov.uk/government/news/prime-minister-outlines-his-five-key-priorities-for-2023.
Stoye, G., Warner, M. and Zaranko, B., 2021. Where are all the missing hospital patients? IFS Comment, https://ifs.org.uk/articles/where-are-all-missing-hospital-patients
Warner, M. and Zaranko, B., 2022. NHS funding, resources and treatment volumes. IFS Report R236, https://ifs.org.uk/publications/nhs-funding-resources-and-treatment-volumes
Warner, M. and Zaranko, B., 2023a. One year on from the backlog recovery plan: what next for NHS waiting lists? IFS Report R241, https://ifs.org.uk/publications/one-year-backlog-recovery-plan-what-next-nhs-waiting-lists
Warner, M. and Zaranko, B., 2023b. Is there really an NHS productivity crisis? IFS Comment, https://ifs.org.uk/articles/there-really-nhs-productivity-crisis
YouGov, 2024a. The most important issues facing the country. https://yougov.co.uk/topics/society/trackers/the-most-important-issues-facing-the-country
YouGov, 2024b. How the government is handling the issue of health in the UK. https://yougov.co.uk/topics/politics/trackers/how-the-government-is-handling-the-issue-of-health-in-the-uk
Endnotes
Authors

Max Warner
Max joined the IFS in 2020 as a research economist in the Healthcare Sector, with a focus on the NHS labour force and adult social care in England.

Ben Zaranko
Ben is a Senior Research Economist and an editor of the IFS Green Budget. His work focuses on the health and social care system and UK fiscal policy.
More from IFS
Understand this issue


Policy analysis


Academic research


