Executive summary
The next wave of Programme for International Student Assessment (PISA) data will be published in December 2023. This will relate to PISA tests taken in 2022, the first wave of data after the COVID-19 pandemic. In advance of these new data, this report seeks to take stock of performance to date in Scotland, including trends in reading, maths and science scores over time and the socio-economic gap in scores, as well as how performance in Scotland compares with other UK nations in particular.
Key findings
1. The performance of Scottish pupils in international PISA tests has declined over time in maths and science, both in absolute terms and relative to other countries, whilst performance in reading has remained flat. Scotland’s maths scores fell 17 points between 2006 and 2018 from 506 to 489, whilst science scores fell more suddenly, by 23 points, from 513 to 490 between 2012 and 2018. Reading scores went from 499 to 504 points between 2006 and 2018.
2. In 2018, there was a steep socio-economic gradient in the attainment of Scottish pupils in PISA tests in maths, reading and science. Across subjects, between 77 and 91 points separate the bottom and top quintiles in terms of socio-economic background, with the biggest gap being in science. This is equivalent to the gap between the UK as a whole and Kazakhstan or Romania in maths, between the UK and Moldova in reading, and between the UK and Costa Rica in science. Whilst there is a steep gradient, the socio-economic gap in Scotland is actually similar to that seen, on average, across OECD countries.
3. Scotland’s socio-economic gradient for maths is slightly smaller than England’s. This is driven by relatively better-off pupils underperforming in Scotland compared with England, whilst students from disadvantaged backgrounds show similar levels of low performance. The socio-economic gradients for reading and science are similar in the two nations. In reading, at each socio-economic quintile, performance is very similar in England and Scotland. Performance in science is uniformly higher across quintiles in England than in Scotland.
4. There are small differences by gender, with boys appearing to perform marginally better in maths and science and girls performing better in reading. The socio-economic gradient is similar for both genders.
5. In 2018, Scottish pupils were entered for an additional test of ‘global competence’, which comes close to measuring one of the Scottish curriculum’s aims of creating more globally aware and responsible citizens. On this measure, Scotland ranks among the very best of all countries that sit the test. However, the socio-economic gap is even larger than in the main PISA tests, with close to 100 points separating the least affluent fifth of students from the most affluent fifth.
1. Introduction
Education in Scotland has been well regarded historically. Some basis for this is evident in international PISA (Programme for International Student Assessment) assessments of 15-year-olds conducted by the OECD. From 2006 to 2012, Scotland scored comfortably above the OECD average in all three of the core subjects of maths, reading and science. However, the most recent 2018 assessments focused on the fact that Scottish education appeared to be on the decline, both in terms of its own performance over time and compared with other countries. This was particularly true for maths and science, though reading remained broadly flat. Whilst Scotland used to be reliably above most other OECD countries, scores were closer to the OECD average in the 2018 PISA results. In contrast, England has not seen a decline in PISA scores over time and had the highest scores among the UK nations in each of the PISA subjects in 2018.
The next wave of PISA data will be released in December 2023. These tests were sat in 2022, which will reflect both long-term trends and the effects of the COVID-19 pandemic. The release of the new PISA data will likely be accompanied by a fanfare of commentary about whether countries are moving up or down the rankings, with less appreciation for the actual test scores across countries, their historical context or the extent of differences by socio-economic background. To enable more informed debate, this report seeks to establish clear baselines for the trends and levels of performance in Scotland as compared with other nations of the UK, and the level and trends for socio-economic gaps. It is particularly important to clearly establish the pre-pandemic baseline and trends for the socio-economic gap, given that we expect the pandemic will have led to an increase in educational inequalities.
The PISA data are one of the best, and only, opportunities to consistently track performance and inequalities in Scotland over time. Scotland abolished standardised assessments that do not lead to formal qualifications in 2004. It then reintroduced them in 2017, but they serve different purposes from Key Stage tests in England and there are limitations in using them to assess inequalities. The Scottish National Standardised Assessments (SNSAs) are sat at three-year intervals throughout primary school and into secondary. They combine tests with teacher assessment to produce an overall measure, meaning it can be unclear how a score was reached. In the PISA data, we can associate the performance of an individual in each subject with their characteristics and those of the school they attend. The scores result only from the tests that were sat and not from additional assessments by others.
Socio-economic differences in education are well established in Scotland, the rest of the UK and internationally (e.g. Anders and Jerrim, 2017; Farquharson, McNally and Tahir, 2022). They exist across a range of outcomes, including early child development (Cattan et al., 2022) and health (Case and Kraftman, 2022). Given the causal impact of education on so many outcomes, inequalities in education are likely to persist into adulthood.1
Section 2 outlines some of the major reforms to the Scottish education system over the last 10–15 years, including the creation of the new ‘Curriculum for Excellence’ and key differences compared with England. Section 3 describes the PISA data, including their key strengths and limitations. Section 4 gives our main analytical results. We first present the trends in overall PISA scores for the three core PISA subjects across the four nations of the UK, before showing how PISA scores vary by socio-economic status in England versus Scotland and by gender. We move on to examine country rankings by socio-economic gradient. Finally, we show how Scotland performs in the ‘Global Competence’ domain, a specific focus of PISA tests in 2018 and close to some of the aims of the ‘Curriculum for Excellence’ to create globally aware and responsible citizens.
The focus of this report is on differences in attainment by socio-economic status. For a detailed description of the 2018 UK PISA results more broadly, read the report by Sizmur et al. (2019a).
2. Scottish education
As education is devolved, schools policies and institutions vary across the four nations of the UK (Sibieta and Jerrim, 2021). In Scotland, decision-making is largely centralised, with a large role for local authorities and the central body, Education Scotland. In England, the focus has been on making schools more autonomous; schools have considerable independence when it comes to staffing and teacher pay. Centralisation of decision-making extends to school choice, which is largely out of the hands of parents in Scotland. The local council allocates each child a school (via the catchment area they live in), and whilst parents can request another this is not common. In England, pupils have no default school and express preferences for up to six schools in their area; 61% rank a school that is not their closest as their first preference (Drayton, Greaves and Rossi, 2023).
The general rule that Scottish schools have less autonomy does not theoretically apply to the curriculum. This is particularly relevant in this report, as the PISA tests aim to establish what an individual knows relative to what a 15-year-old might be expected to know. Since 2010, Scottish schools have followed the Curriculum for Excellence (CfE). Whilst similar to the curriculum in Northern Ireland and the new Curriculum for Wales, introduced from 2022, the CfE is distinct from the approach taken to teaching design and content in England.
The conclusion of the consultation work carried out by the Scottish Executive from 2002 onwards was that the curriculum was overly focused on academic subjects and exams and did not give sufficient regard to changes taking place in society.2 The CfE outlines no specific content to be taught. Instead, schools and teachers teach to the needs of their students and the local area. In this approach, learning experiences and learning that cuts across fields of study are the focus.
The PISA tests are useful as an external measure of Scottish pupils’ attainment. Having earlier abolished national testing other than tests leading to formal qualifications (e.g. Highers and Advanced Highers) in 2004, the Scottish government introduced the Scottish National Standardised Assessments (SNSAs) in 2017. These are computer-based tests that last 45 minutes. The tests take place at roughly three-year intervals throughout an individual’s schooling, starting when they are aged 5–6 (in Primary 1) up until 14–15 (Secondary 3). These are low-stakes tests, with no pass or fail grade, that can be taken at any point in the school year.
Students are not expected to revise. The tests are used by teachers to assess progress as part of a wider range of considerations.3
School resourcing is another area of difference between Scottish and English schools (Sibieta, 2023). In England, spending per pupil fell by 8% in real terms between 2009–10 and 2018–19. Since then, spending per pupil has mostly recovered to 2010 levels, with similar trends observed for Wales and Northern Ireland. This left spending per pupil at about £7,200 across England, Wales and Northern Ireland in 2022–23. Spending per pupil has long been higher in Scotland. However, it has seen smaller cuts since 2010 (with a 6.5% fall up to 2014–15) and bigger recent increases (with a more than 20% real-terms rise since 2014–15). This has left spending per pupil in Scotland at about £8,500 in 2022–23, about 18% or £1,300 higher than in England, Wales and Northern Ireland. The higher level of spending in Scotland seems to translate into smaller class sizes, too. The number of pupils per teacher in secondary schools is lower in Scotland than in England, at around 12.5 compared with around 16.5 in English secondary schools (Sibieta and Jerrim, 2021).
3. The PISA data
The Programme for International Student Assessment tests students across a wide range of countries to assess their proficiency in maths, reading and science. Every OECD member country is included along with a range of others, referred to as partner countries. The tests are conducted by the OECD, generally every three years, and are designed to be comparable across countries and over time. The latest wave of PISA data that is currently available for use relates to the 2018 assessments, which were sat by students in 79 countries. The 2022 assessment data (delayed from 2021 as a result of the COVID-19 pandemic) are expected in December 2023.
In each country, only a sample of students sit the assessments, and these are selected to be as representative as possible. In Scotland, as in the rest of the UK, the National Foundation for Educational Research (NFER) grouped schools based on their previous exam performance, whether they were publicly funded or independent, mixed or single-sex, and their location (urban versus rural). It then randomly selected schools within these groups to take part, producing a sample of schools that are representative of the educational system in Scotland. Of the schools approached by NFER, including back-up schools, 107 (90%) of those in Scotland responded (Scottish Government, 2019). In the rest of the UK, 170 schools in England, 107 schools in Wales and 75 schools in Northern Ireland responded, which was roughly 87% of those approached (Sizmur et al., 2019a, 2019b and 2019c).4
Within each school, 40 students are randomly selected to take part, although they can refuse, be excluded by the school (generally for reasons relating to educational needs), or be excluded due to moving schools between being sampled and the test being conducted. The OECD requires response rates of over 80%, which Scotland achieved (at 80.5%). The UK-wide rate was 83%.
All countries that take part in PISA face the same assessments and survey questionnaires, although many of the surveys are optional and are not completed in the UK. The cognitive tests are completed on a computer and last for 2 hours with questions that are either multiple choice or require a written answer. So as to be able to cover a wide range of content, each student only answers a subset of less than 20% of the full pool of questions. Which subset they answer depends on which of the question booklets they are (randomly) assigned. Through the use of Item Response Theory, PISA scores for an individual student are reached by using their answers to each of the subset of questions they answer to estimate their underlying ability. This allows analysis at the individual level.
If an individual performs well on the PISA test, there is no impact on them. The marks they get cannot be used towards any of their school grades. This means that whilst policymakers and commentators care about the outcome, the tests are ‘low-stakes’ from the point of view of the student. In general, we might worry about judging academic progress based on tests in which pupils may not be motivated to put a great deal of effort into their answers. In the Scottish context, however, the PISA data provide a comparison with the SNSA tests (outlined above), which are also low-stakes.
Although PISA scores can be easily compared across countries, they can be difficult to interpret. Studies exist that try to convert PISA points into approximate years of schooling. The best of these are of two forms. The first type takes those specific students who sat the PISA tests and administers a new test to them a year later. This was the case in the study by Prenzel et al. (2006), who found that those who sat the 2003 PISA tests in Germany performed 20–25 points better in science and maths a year later. In the second type of study, a group of 14-year-olds sit the PISA tests at the same time as the usual 15-year-olds. For instance, Keskpaik and Salles (2013) found that the gap in performance between 14- and 15-year-olds in France was around 44 points in maths.5
Whilst official PISA reports acknowledge these estimates, the OECD does not generally make the translation between points and years of schooling itself. For a number of reasons, we do not either: the amount of evidence on the size of the gap is small; the evidence that does exist for the UK is old and of low quality; and there is large variability between estimates, even in two countries that one might expect to be relatively similar (France and Germany). Moreover, even if such metrics made sense on average, our focus is on the gap between students of low and high socio-economic status (SES). Low-SES individuals, in being behind their higher-SES counterparts, already make less progress in a year, so expressing the difference in those terms seems odd. In this report, we contextualise the gaps we identify in terms of the gaps that exist between average performance in different countries. Though imperfect, this gives some sense of their magnitude.
In each PISA cycle, a one-off test, called the innovative domain assessment, is administered alongside the main maths, reading and science tests. In 2018, the test focused on global competence.6 Individuals are said to be globally competent if they can ‘examine local, global and intercultural issues, understand and appreciate different perspectives and world views, interact successfully and respectfully with others, and take responsible action toward sustainability and collective well-being’ (OECD, 2018a). The OECD chose to test global competence because communities across the OECD and beyond are becoming more diverse. It argues that to live harmoniously and thrive in a labour market that includes diverse teams, individuals will need to be globally competent.
The PISA innovative domain assessment, which is a written test, focused on what PISA describes as the ‘cognitive’ elements of global competence (OECD, 2020c). Essentially, it aims to test students’ ability to grasp why others may think or feel as they do, rather than relying on prior awareness of specific concepts. The resulting scores are turned into a single scale, just as the maths, reading and science scores are.
Questions in the global competence test come in multiple-choice and short-answer formats and involve tasks responding to given scenarios. Students are required to highlight different perspectives, analyse the assumptions people are making or identify where opinion is being relied on instead of fact, and determine which arguments support particular statements and which do not. Much of the exercise relies on good reading and comprehension skills, as is consistent with the major PISA domain for 2018 being reading.7 The global competence test is useful in the Scottish context as it gets close to testing skills that the Curriculum for Excellence was explicitly intended to develop among Scottish students. Disappointingly, the global competence test was not administered in the rest of the UK, and so comparisons cannot be made between Scotland and England, Wales and Northern Ireland.
Alongside the cognitive tests, the OECD surveys respondents, which allows us to look at attainment amongst different groups of students. PISA collects information on the occupation of a student’s parent, how many years of education the parent has, and what durable goods the student’s household contains (as a proxy for their economic situation). This is combined into a single measure that PISA claims captures the economic, social and cultural status (ESCS) of respondents, and aims to capture their relative position in society. This is hard to compare across countries that have different levels of development, though the measure may be more consistent among OECD members. We use this measure as the basis for the analysis of socio-economic gradients below.
4. Evidence
Trends over time
Figure 1 shows the trend in Scottish PISA scores over time in each of the three domains and overall (an average of the three). In maths and science, Scotland has seen decline in its PISA scores over time. For science, this is particularly sharp after 2012. Judging Scotland’s international position over time is harder as the number of countries that take part in PISA has increased from 57 in 2006 to 79 in 2018. The picture is broadly the same, though: Scotland’s ranking adjusting for the total number of countries has become lower in maths and science, whilst in reading it declined after 2009 before returning to a similar level in 2018.8
Figure 1. Scottish PISA scores over time
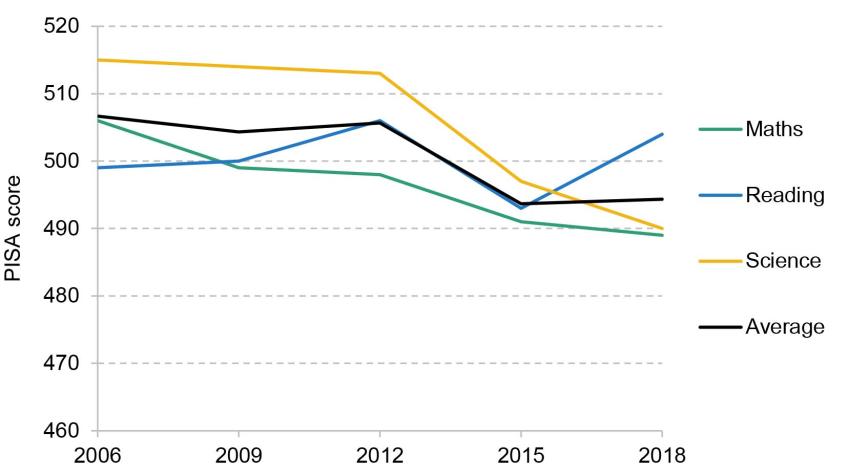
Note: Based on figures 7.13–7.15 in Sizmur et al. (2019a). The average is from authors’ calculations based on the other three subject scores.
To add some context, the 23-point decline in Scotland’s PISA score in science from 2012 to 2018 is similar to the gap between the UK-wide average science score and the average science scores in Lithuania or Spain in 2018 (Schleicher, 2019). The picture is slightly less striking in maths, with a 17-point decline over a longer time period (from 2006 to 2018), though this indicates that the decline is more longstanding than that in science.9 Reading scores move up and down, but by 2018 they are not significantly different from those in 2006.
As a proxy for overall performance on the PISA tests, we can take the average score across the three subjects (maths, reading and science). Figure 2 shows this average score for Scotland and compares it with each of the other UK nations and the average in the OECD as a whole. Between 2006 and 2018, Scotland goes from being the best-performing UK nation and 17 points above the OECD, to being behind England, roughly in line with Northern Ireland and 6 points above the OECD average.
Figure 2. Average PISA scores across UK nations over time
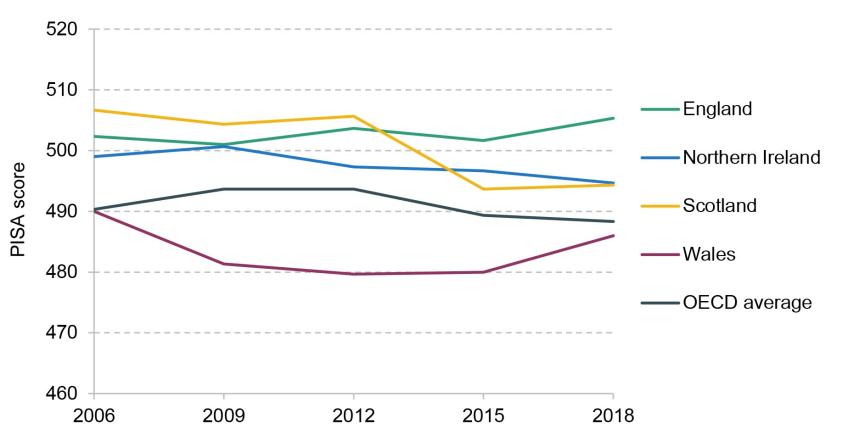
Note: Authors’ calculations taking the average of the subject scores in figures 7.13–7.15 of Sizmur et al. (2019a). This includes reading, maths and science scores, but not global competence.
Figures A1–A3 in the appendix show the same comparisons for each of the three subjects individually. In maths, Scotland is in top position in 2006, 2009 and 2012. By 2018, it has fallen below England and Northern Ireland and has the same score as the OECD average. In science, Scotland’s score of 515 in 2006 put it at essentially the same level as England, but by 2018 it has declined along with Wales and Northern Ireland to around 490, close to the OECD average. In reading, the picture looks better for Scotland, with its scores remaining broadly flat over time and roughly in line with England at a little over 500 points. Throughout, it is clear that Wales performs consistently badly in UK terms, though it has recovered to closer to the OECD average in each subject by 2018.
Gaps in PISA attainment by socio-economic status
Figure 3 shows the socio-economic gradient, as measured by average PISA scores in maths, reading and science for 2018 by quintile of PISA’s ESCS variable, SES. These quintiles are constructed within each UK nation, rather than for the UK as a whole. In each case, for ease of interpretation, Scotland is compared with England.
Figure 3. Socio-economic gradient in PISA scores in Scotland and England, 2018
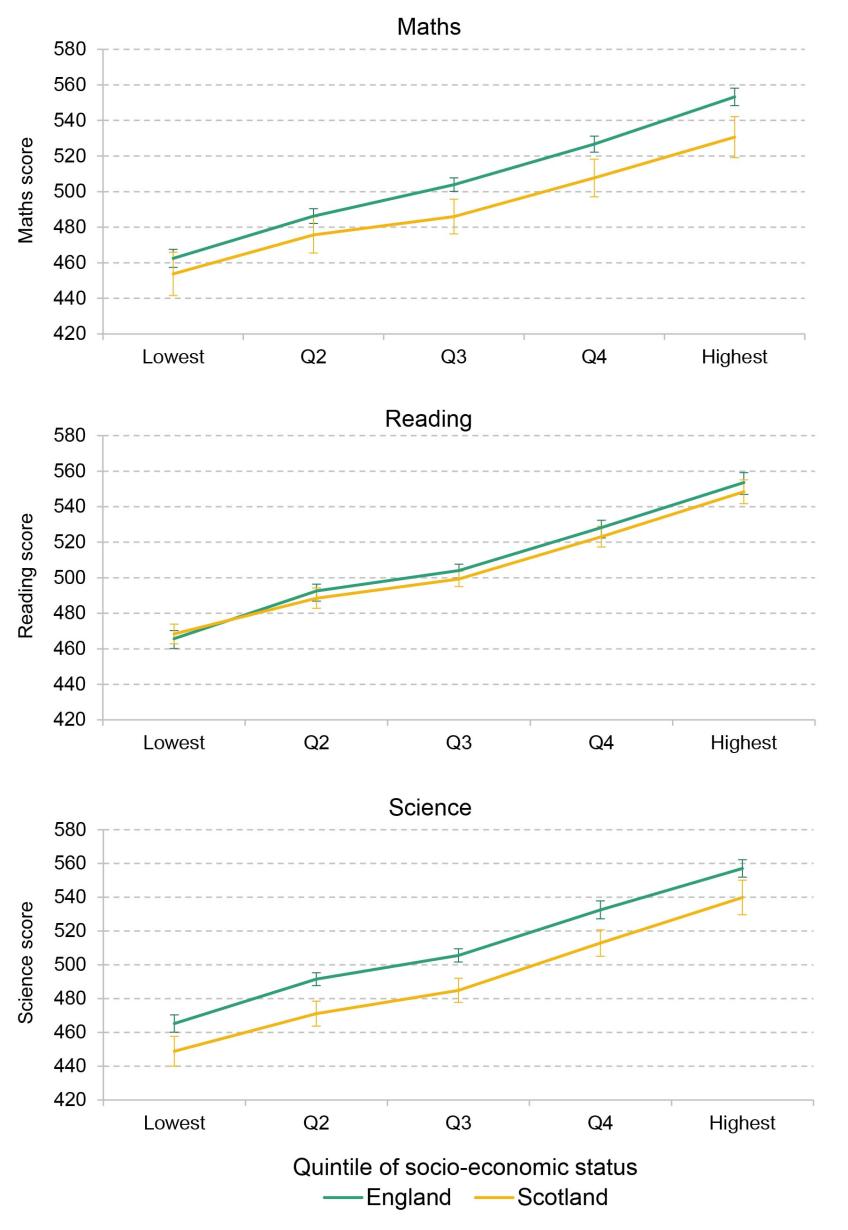
Note: Authors’ calculations based on PISA 2018 data (OECD, 2019). Vertical lines indicate 95% confidence intervals.
First, we look at the socio-economic gradient in Scotland (the yellow line). In each of the three subjects, the gradient appears steep, meaning that more affluent students score more points than less affluent students. Those in the middle fifth (Q3) of the socio-economic status distribution are statistically different from those at both the bottom and the top, quintiles 1 and 5. The gap between the most and least affluent fifths is around 77 points in maths, 80 points in reading and 91 points in science.
Second, we compare Scotland with England. Each of the five points along the two lines has a confidence interval around it. This is the range in which we can be 95% confident that the true value lies. Where confidence intervals overlap, we cannot say that the two countries’ values are statistically different. In maths, performance is similar in quintiles 1 and 2; scores in England are higher but the difference is not statistically significant. In quintiles 3 to 5, scores in England are statistically higher than those in Scotland. This means that the socio-economic gap is larger in maths in England (at 91 points), but only because more affluent Scots perform less well than their English counterparts. In reading, Scotland’s performance is essentially indistinguishable from England’s across the board. In science, English students perform better in each quintile than Scottish students and in each case the difference is statistically significant.
To get a sense of how meaningful these gaps are, we can compare the UK-wide average that is presented in PISA league tables with the averages for other countries (Schleicher, 2019). In maths, the 77-point gap between the bottom fifth and top fifth of students by socio-economic status in Scotland is equivalent to the gap between the UK and Kazakhstan or Romania. In reading, the 80-point gap in Scotland is similar to that between the UK and Cyprus or Moldova. Finally, in science, the 91-point gap in Scotland is the size of that between the UK and Costa Rica or Colombia. 10
Figure 4 focuses on the socio-economic gradient within Scotland, comparing boys and girls. Visually, boys outperform girls in maths in each quintile of socio-economic status and this gap widens slightly at the upper end of the distribution. In reading, the opposite is true – girls consistently outperform boys. In science, the two lines are very similar, though boys have very slightly higher performance. In most cases, particularly in maths and science, the confidence intervals on these points overlap. Whilst the likely reason for this is the relatively small samples which result from cutting the Scottish sample into two (for boys and girls) and then five (for each quintile), it means that we cannot confidently say these lines are different. What is evident, though, is that the same, stark socio-economic gradient is clearly present for both genders.
Figure 4. Socio-economic gradient in Scottish PISA scores by gender, 2018
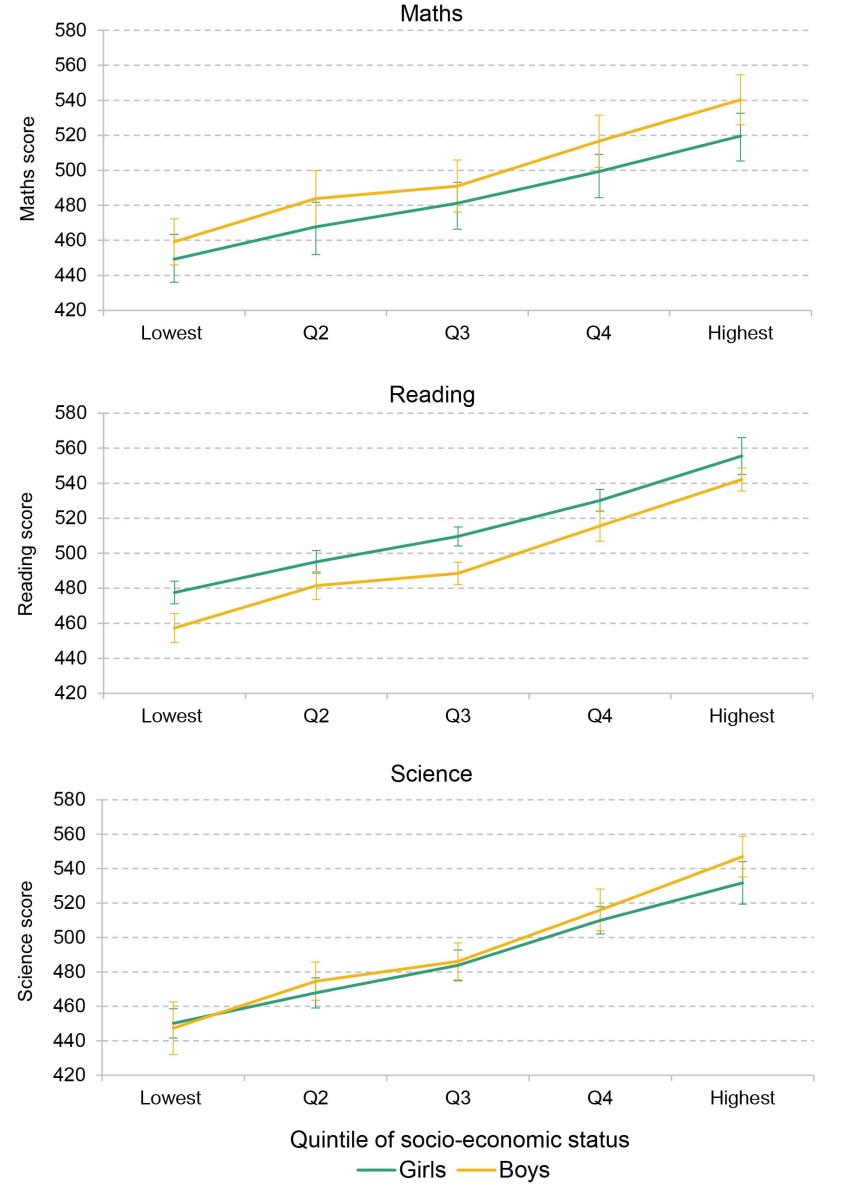
Note: Authors’ calculations based on PISA 2018 data (OECD, 2019). Vertical lines indicate 95% confidence intervals.
So far, the figures that have been discussed have not accounted for other factors. It is possible that the socio-economic gradient is explained by something else. Figure 5 goes beyond the descriptive evidence outlined above and shows results from a linear regression where the outcome is an individual’s PISA score. The sample for these regressions is individuals in Scotland and England (so that comparisons are on the same terms as Figures 3 and 4).
Figure 5. Summary of the association between living in Scotland, socio-economic status, and the two together on PISA scores in maths, reading and science
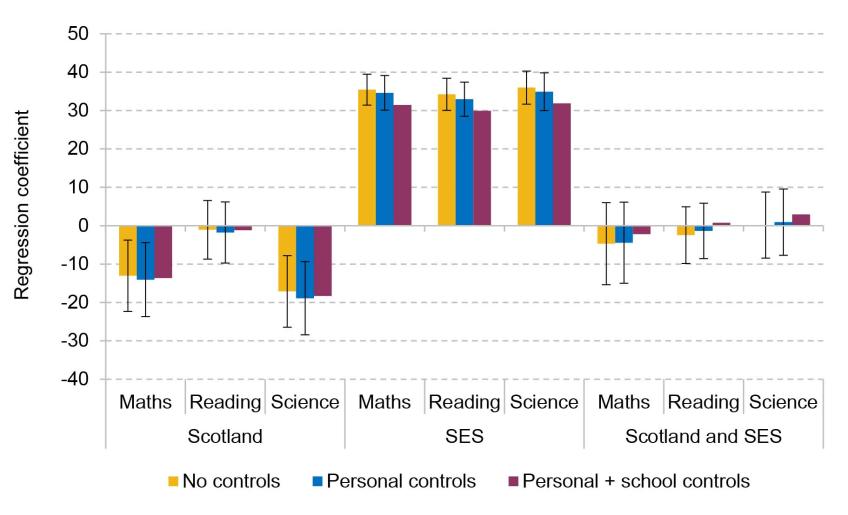
Note: Authors’ calculations based on PISA 2018 data (OECD, 2019). 95% confidence intervals are in black. Sample is 7,607 individuals in Scotland and England for each regression. ‘SES’ is socio-economic status.
The bars relate to three coefficients from these regressions. The first group relates to an indicator of whether an individual is from Scotland (rather than England). The second group shows the coefficient on socio-economic status (‘SES’ on the chart). In contrast to the charts above, this version of the SES variable is continuous rather than by quintile. The third group shows the interaction between the two – in other words, the combined effect of being of higher socio-economic status and living in Scotland. Within each group, the effect on maths, reading and science is shown.
The bars are colour-coded according to which controls are included in any given regression. Green means that only the three coefficients shown are included – those that indicate living in Scotland, SES and the interaction of the two. For the yellow bars, additional controls for personal characteristics are included: indicators for gender, whether the individual is a first- or second-generation migrant, and whether English is spoken at home. For the blue bars, additional controls are added that cover the size of the individual’s class (important to account for as Scotland has lower pupil/teacher ratios (Sibieta and Jerrim, 2021)) and the size of the school.
Within each cluster of coefficients, there is little difference between the bars. The Scotland coefficient is negative and significantly different from zero for maths and science, though not for reading. This suggests that young people in Scotland are showing less proficiency in these subjects than those in England. In the middle section of Figure 5, the coefficients suggest that higher-SES individuals do much better than lower-SES individuals across all the subjects, by around 30 points for each unit increase in the ESCS variable. The final group, where none of the bars is significantly different from zero, shows that this gradient is essentially the same in Scotland as it is in England. It is clear that the earlier figures, although not controlling for the full range of factors included in Figure 5, essentially tell the same story – Scotland generally underperforms England and there is a clear socio-economic gradient that does not differ by nation.
Ranking countries by the socio-economic gradients
Figure 6 puts England and Scotland in an international context. It shows correlations between socio-economic status (ESCS) and PISA maths score. These come from separate regressions where the sample includes each country on its own, one at a time. The OECD average is shown in grey. Visually, England shows a larger socio-economic gap than both the OECD average and Scotland, which is below the OECD average. Each bar has a confidence interval in black – this is the range in which we can be 95% confident that the true value lies. Where confidence intervals generally overlap, we cannot say that countries are statistically different. Instead, we can say that the socio-economic gradient is similar across most OECD countries, particularly in the middle of the chart, and in England versus Scotland.
Figure 6. Ranking coefficients – associations between ESCS and PISA maths score across OECD countries
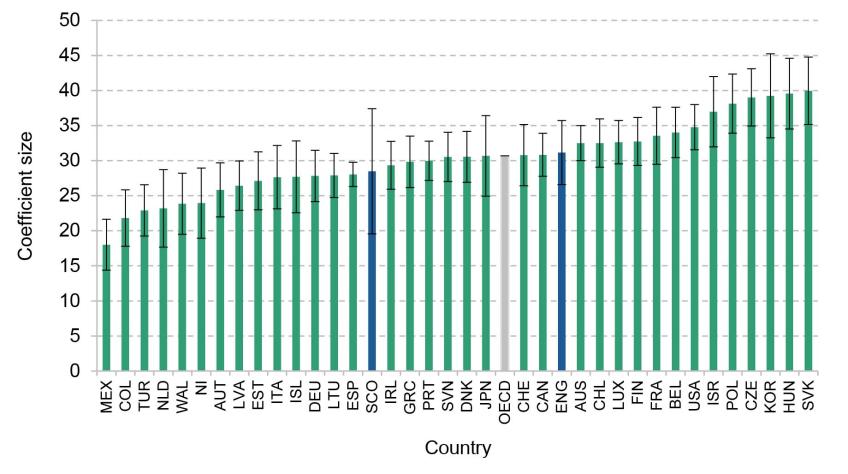
Note: Authors’ calculations based on PISA 2018 data (OECD, 2019). 95% confidence intervals in black.
Figures A4 and A5 in the appendix show similar charts for reading and science. Scotland and England have smaller socio-economic gaps than the OECD average, but are virtually indistinguishable from each other. In science, the difference between England and Scotland is again small, though the socio-economic gradient is above the OECD average in both cases. The degree to which confidence intervals overlap means we cannot say with a high degree of confidence that the socio-economic gradient is very different across OECD countries.
We can be more confident that the socio-economic gradients are smaller than average in Wales and Northern Ireland. In each of the three figures (Figures 6, A4 and A5), they rank in the bottom sixth of countries, meaning that they have a smaller gap between more and less affluent students. They are statistically different from countries at the top of the distribution. Indeed, in reading, Wales and Northern Ireland have the smallest socio-economic gradient across all countries, although one should note that in the case of Wales that comes with low average scores.
Figure 7 loosely compares the PISA data and Scottish Government data. Each pair of bars shows the percentage of those in the bottom (in green) and top (in blue) quintiles of socio-economic status who meet a given standard. For the PISA data, Level 2 (L2) corresponds to a score in the low 400s and Level 3 (L3) is around the OECD average. L2 is described as the ‘“minimum level of proficiency” that all children should acquire’ (OECD, 2020b). In the Scottish Government case, CfE Level 3 (CfE L3) is what Scottish 15-years-olds are supposed to attain. Despite both being called ‘Level 3’, the PISA and CfE levels are in no way the same.
Figure 7. Percentage of students from lowest and highest socio-economic quintiles who attain the given standard
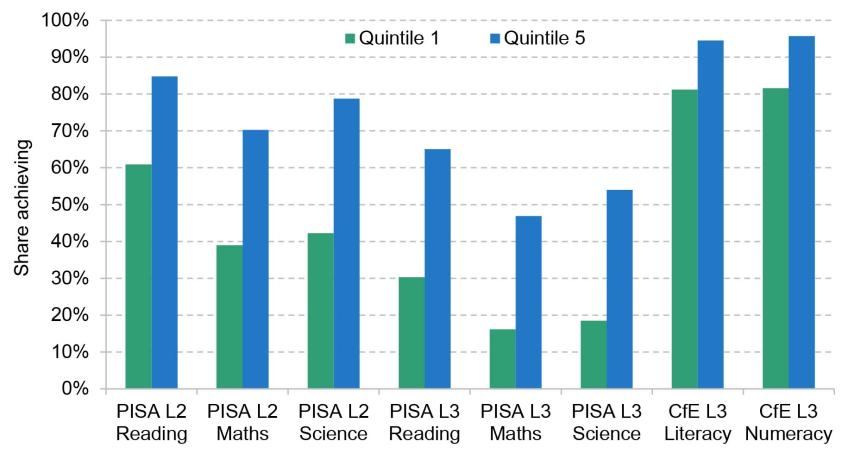
Note: ‘PISA L2’ and ‘PISA L3’ use PISA 2018 data (OECD, 2019). ‘CfE L3’ uses Scottish Government data (Scottish Government, 2022b). See text for explanation of L2 and L3 in each case. Quintile 1 denotes those who are the least-affluent in the PISA data or living in the most deprived areas in the CfE data. Quintile 5 means the most-affluent in the PISA data or those living in the least deprived areas in the CfE data.
The PISA and CfE levels are not strictly comparable, but the gap in the percentage reaching these levels between the highest and lowest socio-economic statuses seems much smaller in the CfE tests. The two measures use different data to compute the quintiles. The PISA data are based on the ESCS measure used throughout this report, whilst the CfE data use the deprivation level (as measured by the Scottish Index of Multiple Deprivation) of a student’s local area to group pupils. An affluent family could live in a deprived area and a less-affluent family could live in an affluent area, which could explain why the gap is smaller. In both literacy and numeracy, it is around 13–14 percentage points. This compares with over 20 percentage points for each of the PISA tests. The largest gaps, at least proportionately, appear in maths and science.
Global competence
Figure 8 shows the socio-economic gradient in global competence. Scotland (in yellow) performs well compared with the other countries that entered their students for the test. This is true for each of the ESCS quintiles, with those at the bottom of the SES distribution ranking fourth among all nations and those at the top ranking third. The socio-economic gradient is steep, however. Indeed, with a gap of around 100 points between the bottom and top quintiles, it appears steeper than the gradients in the other, core domains of PISA. Some of this could be explained by the fact that students of higher socio-economic status are more likely to say issues of global competence are covered in their curriculum – Scotland has the second-biggest difference of all countries that take the test when comparing the bottom quarter of students by socio-economic status with the top quarter (OECD, 2020a).
Figure 8. Socio-economic gradients in global competence scores
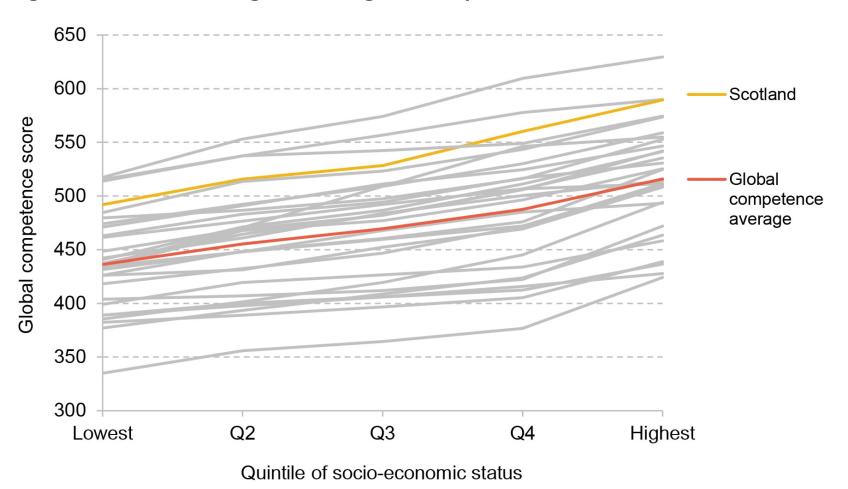
Note: Authors’ calculations using PISA 2018 data (OECD, 2019). The red line shows the average for all countries that take the test, excluding Scotland.
The Scottish socio-economic gradient is also evident in regression analysis, shown in Figure 9. The outcome variable in this regression is the PISA global competence score and the graph shows the resulting coefficient (or correlation) between that and a continuous version of the ESCS variable. A one-unit increase in ESCS (roughly one standard deviation) results in a roughly 35-point increase in global competence scores regardless of whether other variables are included.
Figure 9. Summary of the associations between ESCS and global competence score
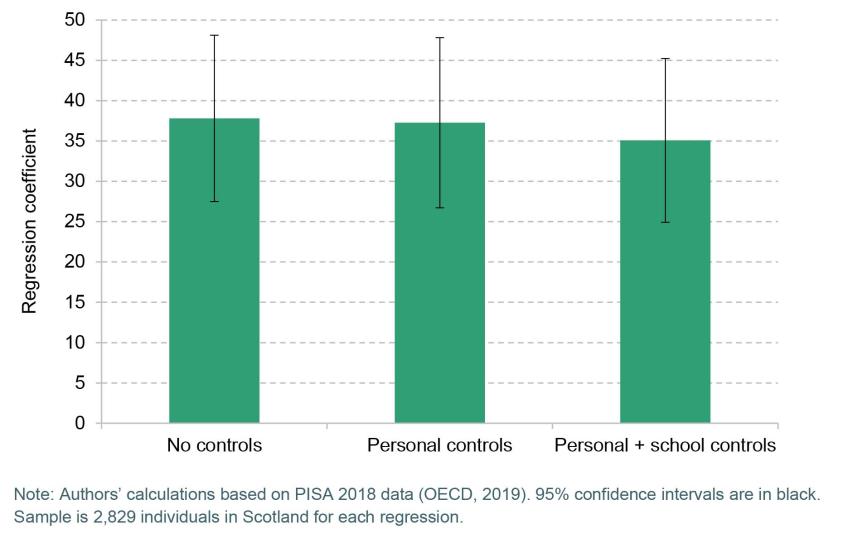
Note: Authors’ calculations based on PISA 2018 data (OECD, 2019). 95% confidence intervals are in black. Sample is 2,829 individuals in Scotland for each regression.
Figure 10 ranks each country that takes the global competence test according to the size of its coefficient on socio-economic status (ESCS). The controls are the same as in the last bar of Figure 9 – personal and school characteristics. Scotland ranks third of all countries, with a relatively high socio-economic gap.
Figure 10. Ranking coefficients – associations between ESCS and global competence score across countries that entered the global competence test
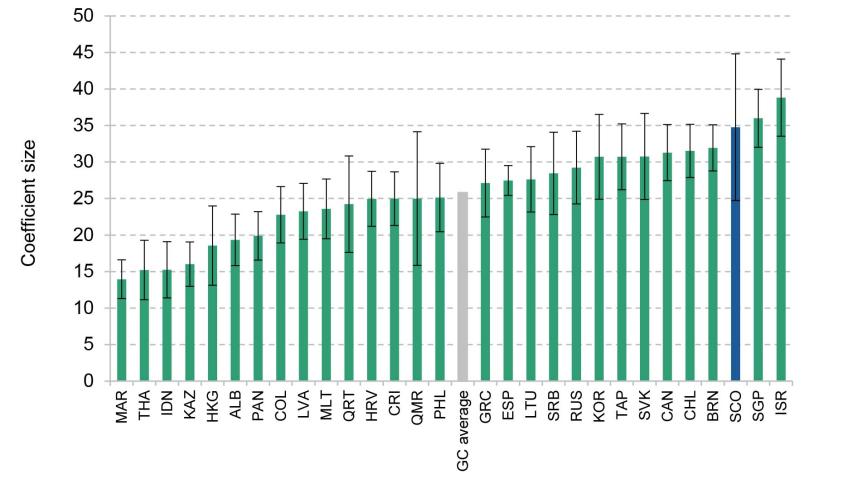
Note: Authors’ calculations based on PISA 2018 data (OECD, 2019). 95% confidence intervals are in black ‘GC average’ is the average score among all countries that take the test.
5. Discussion and conclusion
Scotland has seen worsening average PISA scores over time. In maths (since 2006) and science (since 2012), attainment has fallen by as much as the gap between the UK-wide average and Italy (in maths) or Lithuania (in science) in 2018. By 2018, Scotland had lost its place as the best-attaining UK nation in maths and fallen behind England in science. Reading scores fare better, as the more recent Scottish Government data also show (Scottish Government, 2022a).
Such trends are naturally disappointing, particularly in light of higher levels of and bigger increases in spending per pupil in Scotland. It is unwise to ascribe such trends to particular policy changes, such as the Curriculum for Excellence, as there are many factors changing over time in both policy and society. However, the trends do suggest that something, somewhere is going wrong in Scottish education.
Like most other nations, there is a wide socio-economic gap in PISA scores in Scotland. In maths, reading and science, the gap between the lowest fifth of students by socio-economic status and the top fifth stands at between 77 and 91 points. This is roughly equivalent to the gap between the UK average and Kazakhstan in maths, and between the UK and Costa Rica in science. In terms of comparisons within the UK, the Scottish PISA results show a very similar socio-economic gradient to England, though steeper than in Northern Ireland and Wales.
Scotland shows relatively high scores on the global competence domain. This is noteworthy as this test gets close to measuring the type of content that the Scottish Curriculum for Excellence was explicitly supposed to engender. However, Scotland also shows one of the steepest gradients in global competence scores. Whilst the analysis in this report does not constitute an evaluation of the Curriculum for Excellence, it may suggest that once schools explicitly seek to teach something, those students from the highest socio-economic status groups do best at it.
The latest wave of PISA data will be published in December 2023. This will provide an opportunity to examine how each of the UK nations is performing after the COVID-19 pandemic. When doing so, it is crucial to look beyond the headline debate on rankings, and to analyse actual scores on maths, reading and science in their proper historical context, and to look beyond the average to how scores differ across socio-economic backgrounds.
Appendix
Figure A1. PISA scores in maths across UK nations over time
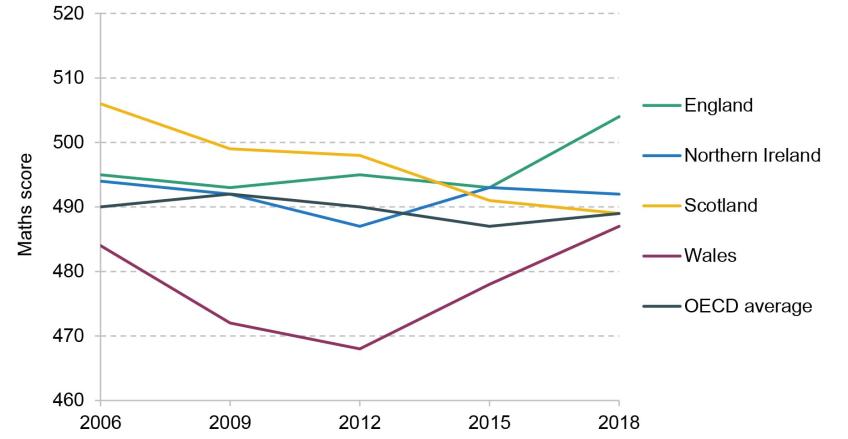
Note: Based on figure 7.15 in Sizmur et al. (2019a).
Figure A2. PISA scores in reading across UK nations over time
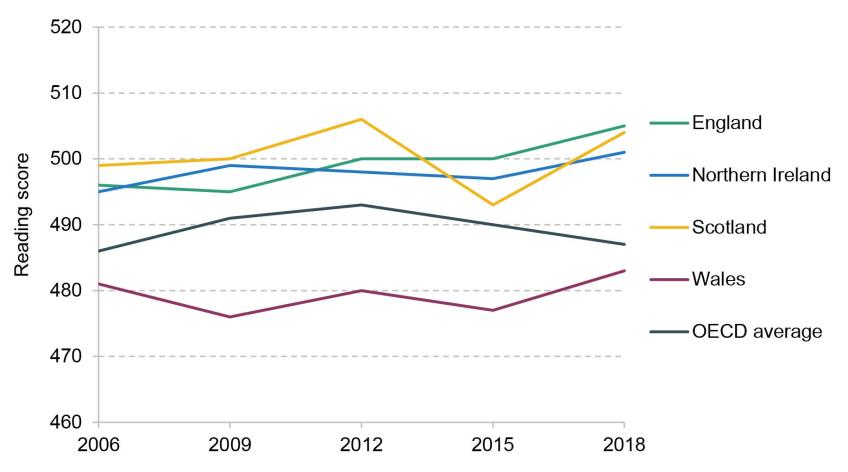
Note: Based on figure 7.13 in Sizmur et al. (2019a).
Figure A3. PISA scores in science across UK nations over time
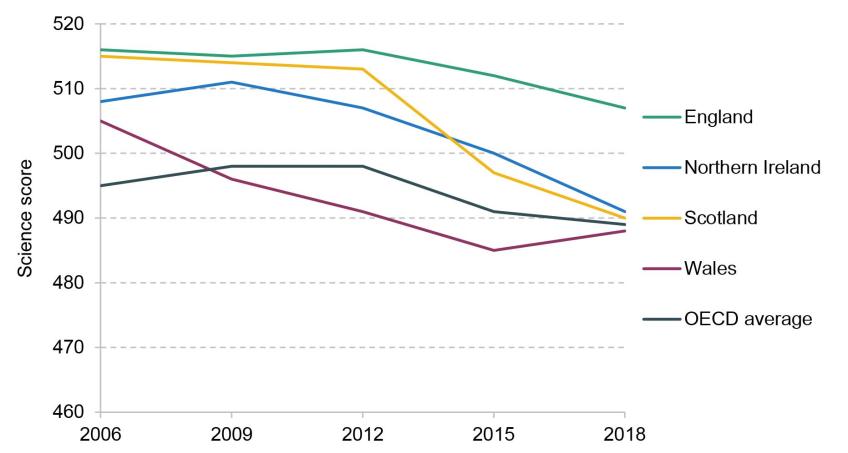
Note: Based on figure 7.14 in Sizmur et al. (2019a).
Figure A4. Ranking coefficients – associations between ESCS and PISA reading score across OECD countries
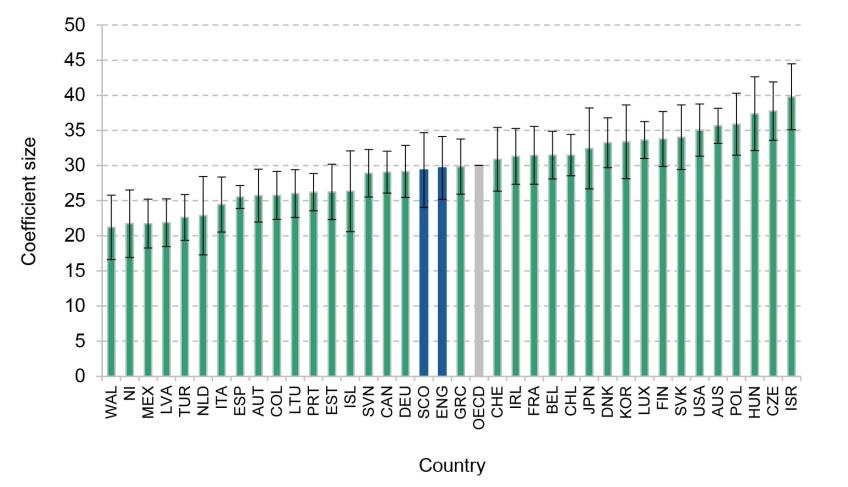
Note: Authors’ calculations using PISA 2018 data (OECD, 2019). 95% confidence intervals in black.
Figure A5. Ranking coefficients – associations between ESCS and PISA science score across OECD countries
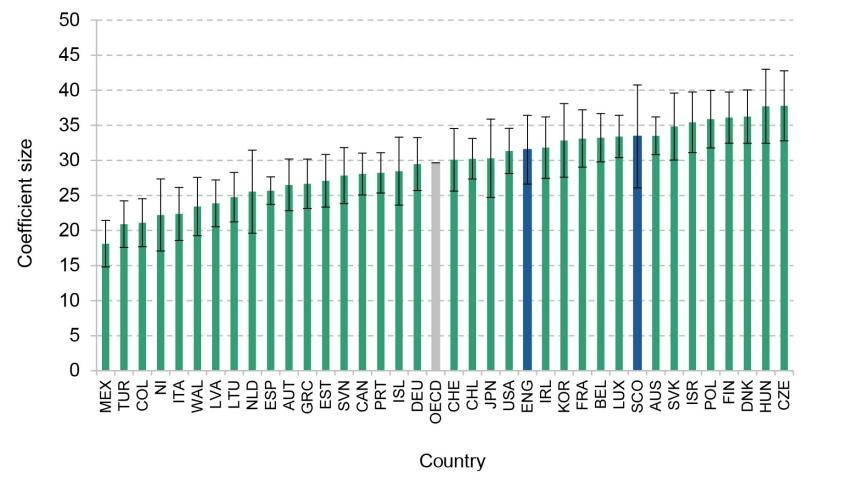
Note: Authors’ calculations using PISA 2018 data (OECD, 2019). 95% confidence intervals in black.
References
Anders, J. and Jerrim, J., 2017. The socio-economic gradient in educational attainment and labour market outcomes: a cross-national comparison. In I. Schoon and R. Silbereisen (eds), Pathways to Adulthood: Educational Opportunities, Motivation and Attainment in Times of Social Change, UCL IOE Press, London. https://discovery.ucl.ac.uk/id/eprint/10051407/.
Brunello, G., Weber, G. and Weiss, C., 2015. Books are forever: early life conditions, education and lifetime earnings in Europe. Economic Journal, 127(600), 271–96, https://doi.org/10.1111/ecoj.12307.
Buscha, F. and Dickson, M., 2018. A note on the wage effects of the 1972 raising of the school leaving age in Scotland and Northern Ireland. Scottish Journal of Political Economy, 65(5), 572–82, https://doi.org/10.1111/sjpe.12187.
Case, A. and Kraftman, L., 2022. Health inequalities. IFS Deaton Review of Inequalities, https://ifs.org.uk/inequality/health-inequalities.
Cattan, S., Fitzsimons, E., Goodman, A., Phimister, A., Ploubidis, G. B. and Wertz, J., 2022. Early childhood and inequalities. IFS Deaton Review of Inequalities, https://ifs.org.uk/inequality/early-childhood-inequalities-chapter.
Clark, D. and Royer, H., 2013. The effect of education on adult mortality and health: evidence from Britain. American Economic Review, 103(6), 2087–120, https://doi.org/10.1257/aer.103.6.2087.
Davies, N., Dickson, M., Davey Smith, G., van den Berg, G. and Windmeijer, F., 2018. The causal effects of education on health outcomes in the UK Biobank. Nature Human Behaviour, 2, 117–25, https://doi.org/10.1038/s41562-017-0279-y.
Drayton, E., Greaves, E. and Rossi, G., 2023. School and neighbourhood segregation in Scotland and England. IFS Report R276, https://ifs.org.uk/publications/school-and-neighbourhood-segregation-scotland-and-england.
Farquharson, C., McNally, S. and Tahir, I., 2022. Education inequalities. IFS Deaton Review of Inequalities, https://ifs.org.uk/inequality/education-inequalities/.
Harmon, C. and Walker, I., 1995. Estimates of the economic return to schooling for the United Kingdom. American Economic Review, 85(5), 1278–86, http://www.jstor.org/stable/2950988.
Hunt, E., 2023. Social mobility & vulnerable learners. Education Policy Institute Annual Report 2023, https://epi.org.uk/publications-and-research/annual-report-2023/.
Keskpaik, S. and Salles, F., 2013. Les élèves de 15 ans en France selon PISA 2012 en culture mathématique: baisse des performances et augmentation des inégalités depuis 2003. Ministère de l’éducation nationale, Note d’information, 13/31, https://archives-statistiques-depp.education.gouv.fr/Default/doc/SYRACUSE/9505/les-eleves-de-15-ans-en-france-selon-pisa-2012-en-culture-mathematique-baisse-des-performances-et-au?_lg=fr-FR.
OECD, 2007. PISA 2006: science competencies for tomorrow’s world – executive summary. https://www.oecd.org/pisa/pisaproducts/39725224.pdf.
OECD, 2010. PISA 2009 results: executive summary. https://www.oecd.org/pisa/pisaproducts/46619703.pdf.
OECD, 2014. PISA 2012 results in focus: what 15-year-olds know and what they can do with what they know. https://www.oecd.org/pisa/keyfindings/pisa-2012-results-overview.pdf.
OECD, 2018a. Preparing our youth for an inclusive and sustainable world: the OECD PISA global competence framework. https://www.oecd.org/pisa/Handbook-PISA-2018-Global-Competence.pdf.
OECD, 2018b. PISA 2015: results in focus. https://www.oecd.org/pisa/pisa-2015-results-in-focus.pdf.
OECD, 2019. PISA 2018 database. https://www.oecd.org/pisa/data/2018database/.
OECD, 2020a. Do all students have equal opportunities to learn global and intercultural skills at school? PISA in Focus 2020/109, https://doi.org/10.1787/2fdce668-en.
OECD, 2020b. PISA 2018 results (volume I): what students know and can do. https://www.oecd-ilibrary.org/education/pisa-2018-results-volume-i_5f07c754-en.
OECD, 2020c. PISA 2018 results (volume VI): are students ready to thrive in an interconnected world? https://doi.org/10.1787/d1e7ccf0-en.
Oreopoulos, P., 2006. Estimating average and local average treatment effects of education when compulsory schooling laws really matter. American Economic Review, 96(1), 152–75, https://doi.org/10.1257/000282806776157641.
Prenzel, M., Baumert, J., Blum, W., Lehmann, R., Leutner, D., Neubrand, M., Pekrun, R., Rost, J. and Schiefele, U. (eds), 2006. PISA 2003: Untersuchungen zur Kompetenzentwicklung im Verlauf eines Schuljahres. Waxmann Verlag GmbH, Munster.
Schleicher, A., 2019. PISA 2018 insights and interpretations. OECD, https://www.oecd.org/pisa/PISA 2018 Insights and Interpretations FINAL PDF.pdf.
Scottish Government, 2019. Programme for International Student Assessment (PISA) 2018: highlights from Scotland’s results. https://www.gov.scot/binaries/content/documents/govscot/publications/statistics/2019/12/programme-international-student-assessment-pisa-2018-highlights-scotlands-results/documents/programme-international-student-assessment-pisa-2018-highlights-scotlands-results/programme-international-student-assessment-pisa-2018-highlights-scotlands-results/govscot%3Adocument/programme-international-student-assessment-pisa-2018-highlights-scotlands-results.pdf.
Scottish Government, 2022a. Achievement of Curriculum for Excellence levels: 2021/22. Chapter 2, https://www.gov.scot/publications/achievement-curriculum-excellence-cfe-levels-2021-22/pages/3/.
Scottish Government, 2022b. Achievement of Curriculum for Excellence levels: 2021/22. Chapter 3, https://www.gov.scot/publications/achievement-curriculum-excellence-cfe-levels-2021-22/pages/4/.
Sibieta, L., 2023. How does school spending per pupil differ across the UK? IFS Report R256, https://ifs.org.uk/publications/how-does-school-spending-pupil-differ-across-uk.
Sibieta, L. and Jerrim, J., 2021. A comparison of school institutions and policies across the UK. Education Policy Institute, EPI-UK-Institutions-Comparisons-2021.pdf.
Sizmur, J., Ager, R., Bradshaw, J., Classick, R., Galvis, M., Packer, J., Thomas, D. and Wheater, R., 2019a. Achievement of 15-year-olds in England: PISA 2018 results. Department for Education, https://assets.publishing.service.gov.uk/government/uploads/system/uploads/attachment_data/file/904420/PISA_2018_England_national_report_accessible.pdf.
Sizmur, J., Ager, R., Bradshaw, J., Classick, R., Galvis, M., Packer, J., Thomas, D. and Wheater, R., 2019b. Achievement of 15-year-olds in Wales: PISA 2018 national report. Welsh Government, https://www.gov.wales/sites/default/files/statistics-and-research/2019-12/achievement-15-year-olds-program-international-student-assessment-pisa-national-report-2018_0.pdf.
Sizmur, J., Ager, R., Bradshaw, J., Classick, R., Galvis, M., Packer, J., Thomas, D. and Wheater, R., 2019c. Achievement of 15-year-old pupils in Northern Ireland: PISA 2018 national report. National Foundation for Educational Research, https://www.education-ni.gov.uk/sites/default/files/publications/education/Achievement of 15-year-old pupils in Northern Ireland PISA 2018 National Report.PDF.
