
Downloads

Download report PDF
PDF | 699.37 KB
Executive summary
Introduced in 1999, Sure Start was the first large government initiative to provide holistic support to families with children under the age of 5 in England. The policy introduced a network of local ‘one-stop shops’, which brought together a range of services to support local families with the aim of enhancing the development and life chances of children under 5. These services included health services, parenting support, early learning and childcare, and parental employment support.
Over the decade during which it was rolled out, Sure Start became an increasingly important element of the early years policy landscape in England and shifted from an initiative initially targeted at the most disadvantaged areas to a universal programme. At its peak in 2010–11, the programme received a third of the total early years budget and had a network of close to 3,500 centres throughout the country.
The change in government in 2010 brought a change of focus in early years policy – moving away from Sure Start and towards increasingly expanding funding for subsidised childcare to support parental employment. Between 2010 and 2022, funding for Sure Start decreased by over two-thirds and over 1,340 centres closed. The recent introduction of Family Hubs and the Start for Life offer points to renewed policy interest in integrated or joined-up family support programmes to support children’s outcomes, starting in the very earliest days of life. As these initiatives take shape, it is critical that they draw on lessons from Sure Start.
Despite the importance of Sure Start in the history of early years policy in England, little evidence about the impacts of the programme was known when critical policy decisions about the future of the programme were made, but research has been accumulating to better understand whether and how Sure Start served families. Previous evaluations pointed at short-term impacts on family functioning and children’s emotional development, while a recent study showed significant reductions in children’s hospitalisations up to age 15.
This report presents evidence of the short- and medium-term impacts of the programme on educational outcomes. Using a robust evaluation methodology and administrative education data covering 15 cohorts of children, we measure the impact of having had access to a Sure Start centre between ages 0 and 5 on school outcomes, including academic achievement and special educational needs. We estimate how these effects vary across different backgrounds, and shed some light onto the mechanisms that might have made Sure Start more or less effective.
Key findings
1. Access to a Sure Start centre between the ages of 0 and 5 significantly improved the educational achievement of children, with benefits lasting at least until GCSEs (age 16). Children who lived within a short distance (2.5 kilometres) of a Sure Start centre for their first five years performed 0.8 grades better in their GCSEs. These are average impacts across all children living near a centre, regardless of whether those families used the centre.
2. There are much larger impacts for those from the poorest backgrounds and those from non-white backgrounds. By the time they took their GCSEs, effects were six times higher for those eligible for free school meals than for those not eligible for them. Positive effects for those from the poorest backgrounds were spread across white and non-white children. For those not eligible for free school meals, Sure Start only significantly improved attainment amongst children from ethnic minorities.
3. Access to a nearby Sure Start centre at early ages increased the likelihood of children being recorded as having a special educational need or disability (SEND) at age 5, but significantly decreased the proportion of children recorded as having a SEND at ages 11 and 16 by 3%. By age 16, the probability of having an Education, Health and Care Plan decreased by 9% (or over 1,000 children a year). Further analysis suggests that Sure Start likely increased reporting of need for some children while reducing the actual need for support for others.
4. These positive impacts of Sure Start are entirely driven by children who lived near centres that opened between 1999 and 2003, known as Sure Start Local Programmes (SSLPs), rather than Sure Start Children’s Centres (SSCCs), which opened subsequently. This remained true even after centres that opened as SSLPs were rebranded as SSCCs. Centres opened as SSLPs had much larger budgets than SSCCs even after 2003. Much of this extra budget was spent on parental outreach, focused on reaching out to families who were less likely to use and more likely to benefit from Sure Start. Until 2003, Local Programmes also had much more community input into what programmes were offered.
5. Under the assumption that Sure Start only benefited children whose families used its services, we calculate that the benefits of using a Sure Start centre are around three times as large as the average impact on all children in the area. This is our best estimate based on service usage data for 2010, but there is uncertainty around this number due to the scarcity of historical information about Sure Start usage patterns. To better understand how area-based joined-up programmes work, we recommend that data on service offer and usage are routinely and systematically collected.
6. By its peak in 2010, total spending on Sure Start was around £2.5 billion in today’s prices, across both former SSLPs and SSCCs. The programme’s benefits in reducing the cost of SEND support for the government offset around 8% of this cost. More significant are the benefits for children from better attainment in the form of higher lifetime earnings; we estimate that for every £1 the government spent on Sure Start, there were benefits to attending children worth £1.09, solely through school outcomes.
7. These results provide further evidence that intervening in early childhood to promote child development through holistic family support can yield important dividends when programmes are well designed and funded. The cost–benefit ratio reported here is modest, but masks substantial impacts among the poorest families and among ethnic minorities. Moreover, the benefits of the programme are likely underestimated as they do not incorporate benefits to the exchequer in terms of increased tax revenue and reduced welfare spending, nor savings from reduced hospitalisations found in previous work. Future research will examine the potential impacts of Sure Start on referrals to children’s social care services and on juvenile offending and provide an overall cost–benefit analysis of the programme.
1. Introduction
Nearly 25 years ago, the government introduced the first large initiative in England to provide holistic integrated support to families with children in their early years. The ultimate aim of the policy, initially introduced as Sure Start Local Programmes in 1999, was to enhance the development and life chances of children under the age of 5 by providing holistic support to their families. This was to be achieved by developing a network of ‘one-stop shops’, serving their local communities with a variety of services, including health services, early learning, parenting support and parental employment help. For the first five years of its existence, Sure Start Local Programmes targeted highly disadvantaged neighbourhoods. In 2004, the Ten-Year Strategy for Childcare called for an expansion of the programme with the aim of delivering ‘a Sure Start Children’s Centre in every community’. The programme was rebranded as Sure Start Children’s Centres and progressively rolled out to less deprived areas of the country.
At its peak in 2009–10, the programme had over 3,000 community-based early years service points across England and accounted for £2.5 billion of public spending across current and capital spending (in 2022–23 prices), or about a third of overall spending on programmes for the under-5s (Cattan et al., 2021). With the change in government in 2010, funding stopped being ring-fenced and significant spending reductions ensued, with spending 73% lower in 2021–22 than it was in 2009–10 (Fright and Davies, 2023) and at least 1,340 centres having been closed.
In Budget 2021, it was announced that new Family Hubs would be created in 75 of the most disadvantaged local authorities in England. These have many of the same features as Sure Start centres, with a focus on the integration of services for parents and children across a variety of domains, including health and employment support. However, while Sure Start was specifically focused on supporting families with children aged 0–5, Family Hubs have a wider remit, to meet the needs of families with children of all ages, and with a greater focus on family support. Furthermore, Family Hubs do not have as clearly defined a set of services offered, and in some cases do not represent a physical hub at all.
Despite the apparent recognition of the benefits of integrated services, relatively little was known at times about the programme’s impacts when crucial decisions were made about the future of the programme. But a body of evidence is starting to build a comprehensive picture of whether and how the Sure Start programme achieved its aim of improving the life chances of young children and their families, and the lessons we can draw from such findings that might be relevant for the new Family Hubs.
While the programme was expanding, two government-commissioned evaluations of it were conducted to document impacts on short-term child outcomes and family functioning. The National Evaluation of Sure Start (NESS), which focused on Local Programmes, found no impact on children’s cognitive skills but an improvement in parenting (less chaos, improved home learning environment) and children’s health (National Evaluation of Sure Start, 2010). The second evaluation, the Evaluation of Children’s Centres in England (ECCE), was commissioned in 2010 and focused on Children’s Centres at the time. It found that Children’s Centre service use was correlated with improvements in the early home learning environment and reductions in parent–child dysfunctional interaction, chaotic environments and parental distress. The evaluation also showed that greater service use was associated with better maternal mental health and lower levels of externalising behaviour when the child was 3 years old (Sammons et al., 2015).
More recently, Cattan et al. (2021) explored the short- and medium-term impacts of the programme, exploiting the roll-out of Local Programmes and Children’s Centres across time and space to identify the causal impact of having access to a Sure Start centre. The study found strong evidence that access to Sure Start affected children’s hospitalisations. In the earliest years of life, it increased hospitalisations as families got more support to use health services and children were exposed to a wider range of infectious illnesses. But after the first few years, Sure Start prevented a substantial number of hospitalisations, and these impacts last well beyond the early years.
The current study complements this body of evidence to measure the impacts that Sure Start had on school outcomes through childhood and adolescence. We use administrative education data to estimate the impact of having access to a Sure Start centre (either Local Programmes or Children’s Centres) on achievement and the likelihood of being recorded as having special educational needs or disabilities (SEND). The fact that the programme was introduced over 20 years ago creates an opportunity to trace out impacts through almost all Key Stages of education, from age 7 to age 16, and to add to the still scarce evidence on the effectiveness and cost-effectiveness of large-scale integrated early childhood programmes.
In this report, we outline our approach and our findings from this analysis. Section 2 gives a brief background on the history of Sure Start, how it was rolled out and what services it offered. Section 3 describes the data and methodology we use to identify the causal effect of Sure Start. Section 4 presents our core results on the effect of Sure Start on academic attainment and special educational needs. Section 5 looks at which groups Sure Start was particularly effective for and Section 6 contrasts the effects by type of centre and explores possible mechanisms. Section 7 contextualises these results based on data on usage of Sure Start, while Section 8 presents a cost–benefit analysis of the roll-out of Sure Start. Section 9 concludes this report.
2. A history of Sure Start
2.1 Sure Start Local Programmes
Sure Start was introduced as a cornerstone of the New Labour government’s plan to tackle child poverty and social exclusion of children in deprived areas. Its main aim was to improve the health and well-being of young children living in the 20% most deprived areas of England. This was to be achieved by setting up around 500 community-based Sure Start Local Programmes (SSLPs) or ‘one-stop shops’ for local families with children under the age of 5. SSLPs were managed by a partnership of health, education, social services and voluntary sectors, and each Local Programme was responsible for working with the community to offer a range of services including outreach and home visits; support to families and parents; support for good-quality play, learning and childcare; primary and community healthcare; and support for children and parents with special needs, but without specification of how services should be offered (Melhuish et al., 2008).
When the programme was first announced, the government set aside three years of funding (1999–2000 to 2001–02) to set up 250 projects in areas with a very high concentration of children under 4 living in poverty. Each project was intended to run for seven to ten years and, in total, the programme would reach up to 150,000 children (Pugh, 2010).
In January 1999, the newly formed Sure Start Unit (a joint responsibility of the education and health departments) identified 60 ‘trailblazer’ districts that would be invited to submit project proposals. On 9 April 1999, the government announced the first 21 projects to go ahead, with a further 30 announced in July. By November of that year, 15 had opened their doors as Sure Start Local Programmes, across almost all regions of the country.
In 2000, the government announced that it would more than double the programme target, from 250 Local Programmes to 500. In total, the government opened 524 Local Programmes (Meadows et al., 2011).
2.2 Sure Start Children’s Centres
From 2003, the government shifted its approach to Sure Start, as outlined in two key documents published in 2003 and 2004 (Bouchal and Norris, 2014). The first, Every Child Matters, emphasised the need for joined-up services to improve children’s outcomes and proposed a shift from centrally controlled, targeted SSLPs to a universal programme controlled by local authorities and relabelled Children’s Centres. The second, the Ten-Year Childcare Strategy, argued to make Children’s Centres part of the government’s drive to increase the quality and availability of childcare for families with young children.
The government’s commitment to create ‘a Children’s Centre in every community’ by 2010 led to a rapid increase in the number of Sure Start Children’s Centres (SSCCs) from 2005 onwards, as shown in Figure 2.1. The roll-out of SSCCs was staged in three phases. The first phase, between 2004 and 2006, still prioritised the 20% most deprived wards. It mostly involved rebranding existing SSLPs (and older initiatives, such as Early Excellence Centres and Neighbourhood Nurseries) into SSCCs, but also involved extensive capital expenditure for new centres.1 The second phase, between 2006 and 2008, aimed to open centres covering the 30% most disadvantaged areas. The third phase, between 2008 and 2010, would expand even further and open centres in all but the 30% least deprived areas. There, it was expected that children’s centres would open in refurbished or converted existing facilities as opposed to new buildings (Children, Schools and Families Committee, 2010).
Figure 2.1. Number and budget of Sure Start centres in England
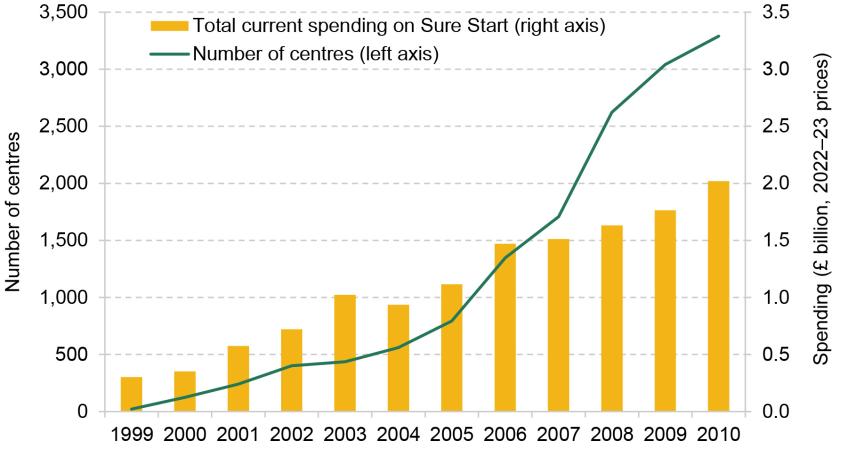
Note: The figure shows the number of centres open at the end of each calendar year. It includes both Sure Start Local Programmes and Sure Start Children’s Centres. Since the treatment of arrangements such as satellite sites was not always consistent, these numbers might not exactly match other data sources. We assume that a Sure Start Children’s Centre opening at the same postcode as a Sure Start Local Programme replaces the SSLP; otherwise, we count both SSLPs and SSCCs between 2003 and 2006, and assume all SSLPs have closed from 2007 onwards. Only current spending is included.
Source: Data on number of centres taken from authors’ calculations using data provided by the Department for Education. Data on Sure Start budget taken from Stewart (2013).
This meant there were 3,290 centres by 2010. In reality, we find that approximately 83% of children aged 4 in 2010 were covered by an SSCC, where coverage is defined by living within 2.5 kilometres of a centre.
The change from SSLPs to SSCCs also incorporated substantive changes to how services were delivered. Despite control over the management of Sure Start centres being transferred to local governments, the services provided by the centres became more uniform and standardised across centres, with less input from communities and parents. The so-called Core Offer included drop-in sessions and activities for parents, carers and children; access to child and family health services, including antenatal care; outreach and family support services; links with Jobcentre Plus for training and employment advice; support for childminders; and support for children and parents with special needs. While many of these services were common in SSLPs, the exact structure of the services provided was based on an assessment of local needs and in consultation with parents (Meadows et al., 2011). Another marked shift was around the emphasis on providing childcare in SSCCs. Phase 1 and Phase 2 centres were also required to provide early learning and childcare for 0- to 5-year-olds 10 hours a day, 5 days a week, 48 weeks a year, which SSLPs were not required to do.
Figure 2.1 also presents the progression of total non-capital spending on Sure Start throughout the roll-out. This shows that the shift to SSCCs, and the subsequent rapid increase in the number of centres, was not accompanied by anywhere near as rapid an increase in the national budget for Sure Start. In 2003, the last year of Local Programmes, there were 437 centres, and current spending on Sure Start was £1.02 billion (in 2022–23 prices). Over the next seven years, the number of centres grew to be more than seven times larger, while the budget only doubled. This meant that by 2010, the last year of the expansion of Children’s Centres, the average budget per centre was less than a third of what it had been seven years earlier, though with significant variation across centres as former SSLPs maintained much higher budgets than newer centres (National Audit Office, 2009).
2.3 Expected effects on school outcomes
Since its inception, Sure Start took a holistic view on child development and aimed to promote children’s health, cognitive and socio-emotional development. The way it aimed to do so recognised the multiple influences that affect early childhood development and the often multiple and complex needs that disadvantaged families tend to face. As a result, Sure Start offered a variety of services, including:
- pre- and post-natal health services;
- parenting support through stay-and-play sessions as well as more structured and often evidence-based programmes;
- early learning and childcare;
- support to families of children with SEND;
- support to parents for (re-)entering employment.
There are several mechanisms through which each of these services could be expected to affect the school outcomes that we study in this report – namely, academic achievement and the incidence of a child having a special educational need or disability.
First, both pre- and post-natal health services have already been shown to have had a direct positive effect on child (and to some extent maternal) health (Cattan et al., 2021), which is crucial for healthy cognitive development.
Second, Sure Start may have improved the quality of the home environment through its support for parenting and parenting practices. A vast body of work shows that a safe, stimulating and nurturing environment is key for healthy child cognitive and socio-emotional development, which are strongly related to academic achievement.
Third, Sure Start may have increased the supply of childcare places. If Sure Start induced children to spend time in higher-quality early learning environments than they would have been exposed to otherwise, then this could be another channel through which Sure Start improved child development. Indeed, the literature suggests that attendance of children in high-quality childcare settings leads to improvements in cognitive development, though there is more mixed evidence on the impact that this has on socio-emotional development (Baker, Gruber and Milligan, 2008; Drange and Havnes, 2019).
Fourth, Sure Start may have increased parental employment and wages by providing support to parents in acquiring new skills or finding employment and led to increases in childcare demand and family income. However, Cattan et al. (2022) test whether Sure Start affected parental employment and find little evidence that was the case, thus suggesting that parental employment support services were unlikely to drive the effectiveness of Sure Start.
Finally, it is important to note that Sure Start Local Programmes in particular provided services targeted at children with special needs and disabilities – such as home visiting and special playgroups – and, through their focus on outreach, made these services more accessible to families. On the one hand, the fact that Sure Start brought a lot of children and families into contact with professionals may have increased the extent to which SEND was detected (or detected earlier). On the other hand, the services targeted at children with SEND may have also meant they received more timely support with their needs.
Overall, we would therefore expect any effect Sure Start has on children’s academic outcomes to be positive, boosting their attainment. The direction of the effect on SEND support is less clear: Sure Start may have improved children’s underlying need and/or increased detection, so its overall effect on recorded SEND could be positive or negative.
3. Methodology
3.1 Evaluation approach
The objective of this study is to estimate the causal impact of families having access to a Sure Start centre (either Local Programme or Children’s Centre) during the first five years of their child’s life on their child’s educational attainment and special educational needs from ages 5 to 16. To do so, we need to define what we mean by ‘access’ to a Sure Start centre, and we need to adopt an empirical approach that allows us to be sure that having access to a Sure Start centre is the only factor driving any difference in outcomes that we might observe.
Defining access to a Sure Start centre
Sure Start did not have strict catchment areas, but rather aimed to act as ‘one-stop shops’ within ‘pram-pushing distance’ for their local communities. This means that there are many different possible definitions of having access or being exposed to Sure Start. In this study, we define families as being exposed to Sure Start if they lived within 2.5 kilometres of a centre at any point in their child’s first five years.2 To be specific, we consider all families living within a particular small neighbourhood (a lower layer super output area, LSOA)3 as being exposed to Sure Start if there was a Sure Start centre within 2.5km of all postcodes within that LSOA.
Depending on the age of the child when the centre opened, this exposure could be for one to five years, and we show how impacts of being exposed to Sure Start vary with the length of this exposure.
The estimates we derive in this analysis refer to the average impact of exposure to Sure Start on the outcomes of all children living within 2.5km of the centre. This parameter is highly policy relevant because Sure Start was an area-based programme open to all local children and families.
It is worth noting two things about this interpretation. First, not every child who lived near a Sure Start centre would have attended the centre. As a result, the impacts we report are an average of the impacts of the centres on children who used services and children who did not. Children who did not use the services may still have benefited through their interactions with children or families who used the services – though we would anticipate these impacts to be much smaller than any direct impacts from using the services. We do not have data that would allow us to disentangle direct from indirect effects – which is another reason why we focus on estimating the average impacts of Sure Start on the whole of their local communities.
Second, some children who lived more than 2.5km from a centre also attended Sure Start centres, though in much smaller proportions than those living within 2.5km (Goff et al., 2013). As a result, our main estimates should not be considered to represent the difference between living near a Sure Start centre and that centre not existing, but rather the difference between living closer to or further away from the centre. In Section 7, we set out what we can learn about the likely effect of actually attending a Sure Start centre. In Section 8, we incorporate these estimates into the assessment of the benefits of Sure Start as a whole.
Estimating the causal effect of access to a Sure Start centre
The Sure Start programme was initially targeted at the most disadvantaged areas of the country, and then gradually rolled out to less and less disadvantaged areas. This means that we cannot simply compare the outcomes of children who had access to a centre with the outcomes of children who did not to estimate the causal impact of Sure Start exposure on children’s outcomes. Doing so could confound the impact of Sure Start with the impact of other pre-existing differences in environments between children who were exposed (and tended to live in more deprived areas) and children who were not (and tended to live in less deprived areas).
To circumvent this challenge and only capture variation in children’s outcomes that can be attributed to exposure to a Sure Start centre, we use an evaluation methodology called difference-in-differences. To understand the intuition behind this methodology, consider a cohort of children residing in an area where a Sure Start centre was located (a ‘treatment area’) who were aged 0–5 when the Sure Start centre first opened, and another cohort of children residing in the same location but who turned 5 before the centre was opened and therefore could not benefit from its services.4 Using the difference across cohorts within areas before and after the opening of a centre ensures that our estimates are not contaminated by differences in outcomes across areas that would have occurred even in the absence of Sure Start, such as increases in educational spending across the country over the 2000s.
However, this approach could also pick up any trends in outcomes across cohorts that would have occurred even in the absence of a Sure Start centre opening. We estimate these common national trends from the same cohorts of children residing in areas where Sure Start centres never opened, or only opened much later so that no children in these cohorts were ever exposed to its services (‘comparison areas’). We net off the difference in outcomes over time in comparison areas from the difference in outcomes over time in treatment areas. As long as the trend in outcomes in comparison areas provides a good proxy for what would have happened to outcomes in treatment areas in the absence of a Sure Start centre opening, this should enable us to estimate the causal impact of access to a Sure Start centre on children’s outcomes.
While we use all areas of the country in our analysis, to maximise the comparability of our treatment and comparison areas, instead of treating all comparison areas similarly, we more heavily weight those areas without Sure Start centres that are of a similar level of deprivation to areas with centres, and vice versa. We also more heavily weight areas in local authorities where we observe similar trends across cohorts (prior to the opening of the Sure Start centre).
Appendix Section A.1 presents the technical details of this methodology and discusses the success of this approach in ensuring we are comparing similar areas.
3.2 Data
The analysis conducted in this study uses data derived from two administrative data sources.
Data on Sure Start
We use data provided to us by the Department for Education on the exact location and opening date of all Sure Start Local Programmes and Children’s Centres. We have no information on when Local Programmes closed and hence need to infer it. For SSLPs that match with a Children’s Centre, we assume that the Local Programme closed when the Children’s Centre opened. For other SSLPs, we assume a closure date of December 2006.5
We use data on the location of Sure Start centres to construct the distance between each postcode in England and each Sure Start centre. We then aggregate this to an LSOA level, and check whether all postcodes in an LSOA are within 2.5km of a Sure Start centre at a particular point in time, in which case we define the LSOA as a treated (exposed) area at that point in time.6
We exploit the variation in exposure to Sure Start generated by its roll-out between 1999 and 2010. We do not exploit the variation that would have been generated by the centres’ closures past then. This is because, while data on Children’s Centre closures are available, research has shown that Children’s Centres have undergone many other changes that would not be captured in these data, including mergers of centres and reductions in services and hours (Smith et al., 2018).
National Pupil Database
To study the impact of Sure Start on school outcomes, we use data from the National Pupil Database (NPD). The NPD brings together data from a census of pupils attending state schools in England, plus national achievement test scores for all those who took them. This includes attainment in Foundation Stage Profile (FSP) assessments, which take place at age 5, and Key Stage (KS) 1, 2 and 4 exams, which take place at ages 7, 11 and 16 respectively. It also includes information on whether students at each of these ages have special educational needs and on the level of support they receive.
Importantly, the NPD also includes some demographic information on pupils (gender, eligibility for free school meals, English as an additional language and ethnicity) which we use to explore whether the impact of exposure to Sure Start differs for different groups, as well as their address, from which we get the LSOA they lived in. The earliest age at which we observe this for children is 5. From this, we can construct a measure of whether a child was exposed to Sure Start, based on where they were living when they were 5 and assuming that their address at age 5 is the same as their address during the period they were eligible to use Sure Start (0- to 5-year-olds).
Outcomes of interest
We calculate average levels of attainment at ages 5, 7, 11 and 16, each of which we standardise within cohort to have mean 0 and standard deviation 1, such that all attainment outcomes are measured in standard deviations. This means that, for each stage of education, we are implicitly considering a child’s attainment relative to others in their cohort (stripping out any overall improvements in test scores over time or overall changes in the spread between high and low achievers). Using standard deviations is helpful for comparing outcomes at different ages, which are otherwise measured on different scales. It also lets us compare more easily across years, even when exams are changed.
At age 5, the attainment score covers six domains: mathematics and reasoning, language and communication, knowledge and understanding of the world, creativity, social skills, and physical skills. At age 7, it covers reading, writing and maths. At age 11, it covers maths, English and science. At age 16, it covers all GCSE subjects, including English, maths, science and all optional subjects students have taken.
We consider SEN status at the same four ages: 5, 7, 11 and 16. In the NPD, students are listed as having an SEN plan because they receive some form of additional help with learning, after a recommendation from a school, doctor or nursery, in collaboration with the child’s parents. Students can be designated as having SEN for a range of reasons, stretching from emotional and behavioural difficulties or learning difficulties to more serious conditions such as autism or serious physical conditions. Since the implementation of Sure Start, there have been two broad categories of SEN plan. The first is a School Action plan, later known as SEN Support, which is much more common, as it is designed for those with less serious needs.7 The second is an SEN Statement, later known as an Education, Health and Care (EHC) Plan. We consider whether children exposed to Sure Start are more or less likely to be classified as having a special educational need, and show how this is broken down into those receiving SEN Support and those having an EHC Plan.
To estimate the difference-in-differences model, we average each outcome by LSOA and birth year. That is, for any given year in any given LSOA, we use the mean value for each outcome for all the children born in that year who were residing in that LSOA when they were 5 years old. Combining this with information on whether a Sure Start centre had opened within 2.5km of that LSOA by that year, and with official data on the Index of Multiple Deprivation of the LSOA, we are able to use the methodology described above to estimate the impact of Sure Start on the outcomes in question. We describe in Box 3.1 the exact cohorts being used for different outcomes.
Box 3.1. Data from the National Pupil Database
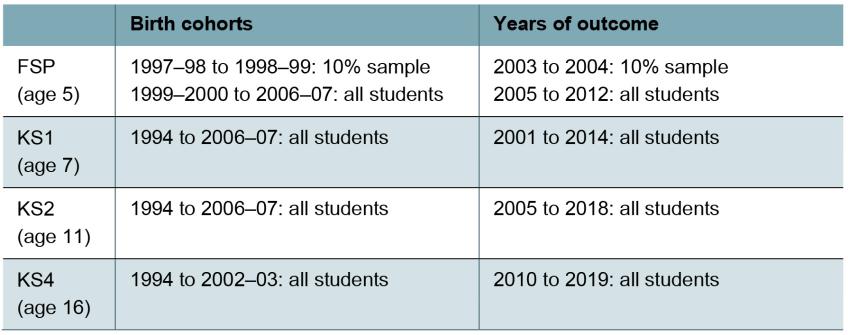
Our analysis of the impacts of Sure Start on school outcomes uses the National Pupil Database, which gathers administrative education data collected by the Department for Education about all state-educated pupils. Not all outcomes are available for all periods, so we use slightly different sets of cohorts for different outcomes. Table 3.1 describes which cohorts we use in each set of analyses presented in this report.
Table 3.1. Cohorts used in analysis of impacts on different outcomes
4. Results
We break down our results into two sections. First, we discuss the effect of Sure Start on academic outcomes at each age. Then, we document the effect of Sure Start on the reporting of special educational needs. For each outcome, we are able to show both the short- and medium-term effects of Sure Start, so that we can see how the roll-out of Sure Start affected children’s development over time.
4.1 Academic attainment
Figure 4.1 reports the estimates of access to Sure Start on academic results at ages 5, 7, 11 and 16. In each case, results are reported in standard deviations. This means that in each case, results are scaled according to the distribution of grades in that year. To put this into context, for those born in the first year a Sure Start centre opened in their location of residence, a 1 standard deviation increase in grades would correspond to an improvement of 25.7 total grades across all GCSE subjects (equivalent to doing two to three grades better in each subject for someone taking 10 GCSEs).
Figure 4.1. Effect of Sure Start on test scores
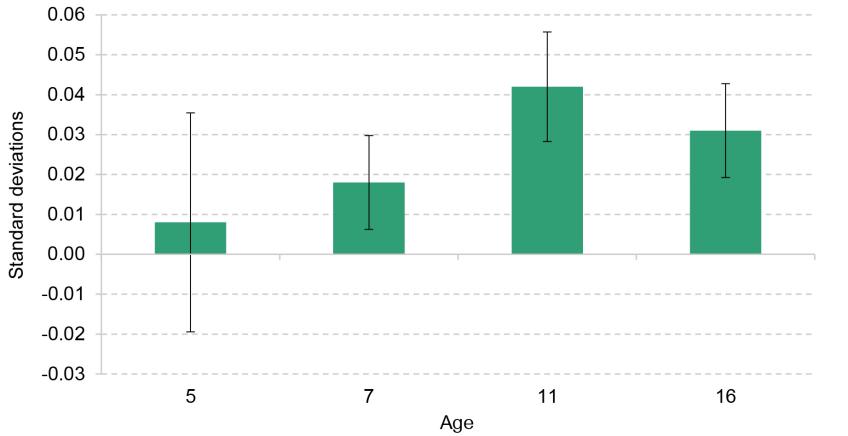
Note: At each age, results represent the difference in test scores as a result of living within 2.5km of a Sure Start centre, relative to living further away. Error bars represent 95% confidence intervals. The set of cohorts used is different for each age group; see Table 3.1 for details.
Source: ONS. Authors’ calculations using data from the National Pupil Database.
The figure shows that children who lived close to Sure Start centres did not have significantly better aggregate developmental scores at age 5, around the time most children would have stopped being eligible to use Sure Start services. While the effect size is positive at 0.008 standard deviations, it is very small and statistically insignificant (which means we cannot be confident that the true impact is different from zero). This aggregate score consists of language and mathematics skills, but also creativity, personal development and physical ability, so does not necessarily reflect the same skills as tested at older ages.
Two years later, students did significantly better in Key Stage 1 assessments because of their exposure to Sure Start – their results are 0.018 standard deviations higher than they would have been had they not been exposed to Sure Start. This is even clearer in the results at age 11, where we see a 0.042 standard deviation increase in results in Key Stage 2 exams, the largest we see at any point. The effect of Sure Start on school performance is not quite as large at age 16, but is still significant and positive. The effect size of 0.031 standard deviations is equal to an increase of 0.8 grades across all subjects.
We attempt to dig further into the mechanisms through which Sure Start improves long-run academic performance. To do this, we break down the FSP results (at age 5) into the different domains of school readiness on which children are assessed and estimate the effect of Sure Start on each of them individually. The six categories are mathematics and reasoning, language and communication, knowledge and understanding of the world, creativity, social skills, and physical skills. Figure 4.2 presents the effect of attending Sure Start on each developmental category. The largest effect by far, and the only statistically significant effect, is on communication and language skills, which were improved by Sure Start. The effect on other developmental scores cannot be statistically distinguished from zero across the whole population.
Figure 4.2. Effect of Sure Start on developmental scores at age 5
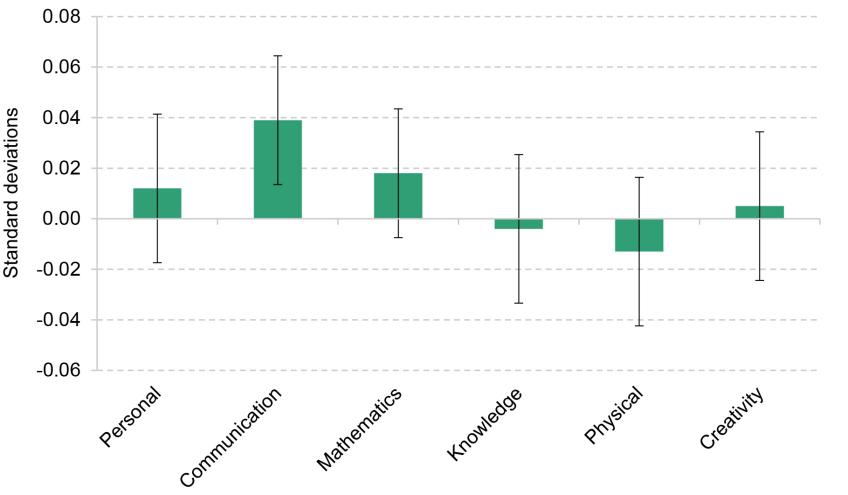
Note: Results represent the difference in each category of developmental scores as a result of living within 2.5km of a Sure Start centre, relative to living further away. Error bars represent 95% confidence intervals.
Source: ONS. Authors’ calculations using data from the National Pupil Database.
Perhaps the most relevant comparison at FSP to later academic attainment would be the effect of Sure Start on a combination of mathematics and language skills. The effect in that case is statistically significant, with proximity to Sure Start significantly improving mathematics and language skills combined by 0.028 standard deviations. This suggests that the lower developmental scores are reflective of a lack of effect on less academic skills, but do contain evidence of improved academic ability in the short term as well as the medium term.
4.2 Special educational needs
As with academic attainment, we examine the effect of Sure Start on children’s SEN status at ages 5, 7, 11 and 16. We break down the overall effect into those receiving SEN Support (with typically less severe needs) and those with EHC Plans (with typically more severe needs).
Figure 4.3 presents the causal impact of exposure to Sure Start on the probability of students being identified with special educational needs at each age, broken down into the two categories of SEN. This shows that at age 5, students were significantly more likely to be having SEN Support (the less severe category) if they were exposed to Sure Start than if they had not been exposed to it. One plausible explanation for this result is that the extra support Sure Start incorporated for those with special educational needs may have helped with detection of additional needs, or simply made it easier for children identified to access support at an earlier age. In other words, it is possible that this is primarily due to an increase in diagnoses of SEN and offering services to children who need them, as opposed to an increase in the proportion of children who have special educational needs. This effect continues at age 7, with children exposed to Sure Start 0.6 percentage points more likely to be identified with SEN than those not exposed.
Figure 4.3. Effect of Sure Start on SEN status
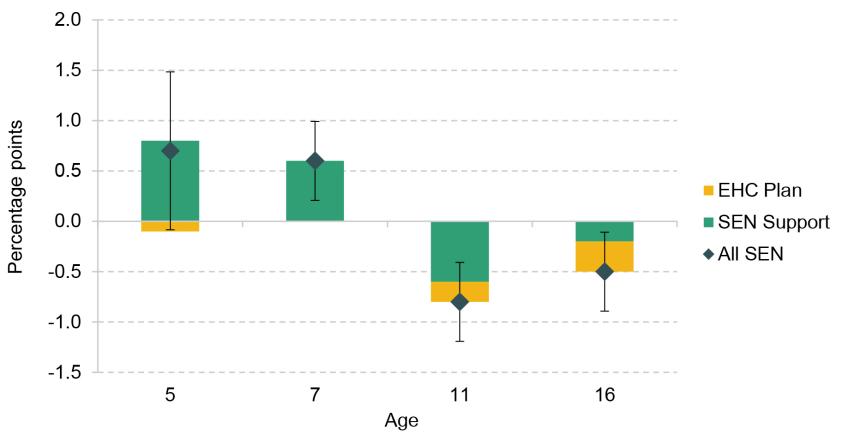
Note: Results represent the difference in the likelihood of being classified as having special educational needs as a result of living within 2.5km of a Sure Start centre, relative to living further away. Error bars represent 95% confidence intervals and apply to the effect of Sure Start on having either an EHC Plan or SEN Support. The effect on having SEN Support is statistically significantly different from zero at all ages except 16, and the effect on having an EHC Plan is statistically significant at ages 11 and 16. The set of cohorts used is different for each age group; see Table 3.1 for details.
Source: ONS. Authors’ calculations using data from the National Pupil Database.
By age 11, the story is very different. We see a significant decline of 0.8 percentage points in the proportion of children with SEN because of Sure Start, larger than the original increase at age 5. This suggests that Sure Start reduces the proportion of children recorded as having special educational needs in the medium run. At age 16, this pattern continues, with the probability of being recorded as having SEN reduced for those who were exposed to Sure Start. Interestingly, this effect is particularly strong for EHC Plans, the probability of which drops by 0.3 percentage points. This is important for several reasons. First, EHC Plans are much rarer, so in percentage terms this decrease represents a much larger drop in the number of children who needed an EHC Plan – approximately 9%. Second, provision for a student with an EHC Plan is twice as expensive as SEN Support in mainstream schools, so a reduction in the number of EHC Plans is particularly valuable from a cost–benefit perspective.8 Finally, EHC Plans are often provided for permanent conditions, which are unlikely to be prevented by Sure Start exposure.
We break down the effect of Sure Start by looking at the effect on different types of SEN (such as behavioural difficulties, ADHD, autism or dyslexia). We see no clear drivers of either the increases at young ages, nor the decreases at older ages, suggesting that the effect of Sure Start on SEN was not a result of Sure Start helping particularly with some conditions. This suggests that those on EHC Plans needed less support in adolescence as a result of Sure Start.
4.3 Summary
Exposure to Sure Start had a significant effect on a range of school-based outcomes for children, both in the short term and in the medium term.
In terms of both grades and SEN, we see the same pattern as children get older: Sure Start appears to have given children a foundation to succeed later in childhood. By age 11, academic outcomes were much improved because of Sure Start, a phenomenon that persisted at age 16. Early increases in support for SEN reverse by the end of primary school, with reductions across different levels of support. Taken together, these results give an impression of Sure Start as a programme that had beneficial effects across several developmental domains. It is also clear that while Sure Start had positive effects, they did not happen instantaneously, and perhaps were a consequence of giving both parents and children the tools to succeed throughout childhood, rather than offering quick fixes for problems at young ages, as suggested by findings from NESS and ECCE that Sure Start improved the home learning environment (National Evaluation of Sure Start, 2010; Sammons et al., 2015).
5. Who benefited most from Sure Start?
5.1 Impacts by household income
Sure Start was introduced with a specific aim of ameliorating the impact of poverty on children, and the initial roll-out of Sure Start Local Programmes was explicitly targeted to areas with higher levels of local deprivation and areas with high levels of low birthweight and teen pregnancy (Department for Education and Employment, 1999). Over the years we analyse, students from low-income backgrounds had lower academic attainment and had higher rates of special educational needs (see Appendix Section A.2 for more details). Therefore, it is important to consider whether Sure Start was as or even more effective for those from low-income backgrounds.
There are plenty of reasons to think that Sure Start may have been more effective for these children. Some Sure Start services were particularly relevant to low-income families, such as Job Centre links, meaning that they could have made more use of the centres. It is also possible that there was more outreach in more deprived areas to encourage families to use services. Cattan et al. (2021) use data from the Evaluation of Children’s Centres in England to show that the poorest families did indeed spend more time in centres than other families, particularly for those programmes focusing on parenting and adult support.
Another reason to expect Sure Start to have had more impact on children from low-income backgrounds is that we are comparing Sure Start with the kind of services and environment that children would have experienced otherwise. Currie (2009) shows that disadvantaged children grow up in less safe and stimulating environments, while Bolt et al. (2021) show that much of the advantage that children from higher-income backgrounds get comes from higher parental investments of both time and money. We might expect Sure Start to partly substitute, as well as improve, deprived home environments for lower-income children, and thus be more effective for those children.
To check this, we run the same analysis presented so far separately for those from low-income households and for the rest of the population. We use eligibility for free school meals (FSM) at age 5 as an indicator of low income, for which 17% of the population we consider qualify.9
Figure 5.1 shows academic results at each age, broken down by whether students are eligible for FSM or not. This shows that at all ages, Sure Start was particularly effective for children from low-income backgrounds. Unlike the whole population, the low-income population’s academic achievement was dramatically improved by Sure Start at age 5, with an increase in FSP scores of 0.114 standard deviations. This suggests that Sure Start helped to reduce inequalities in development from an early age, as it helped those with lower baseline levels of support and lower developmental scores do better.
Figure 5.1. Effect of Sure Start on test scores, by income
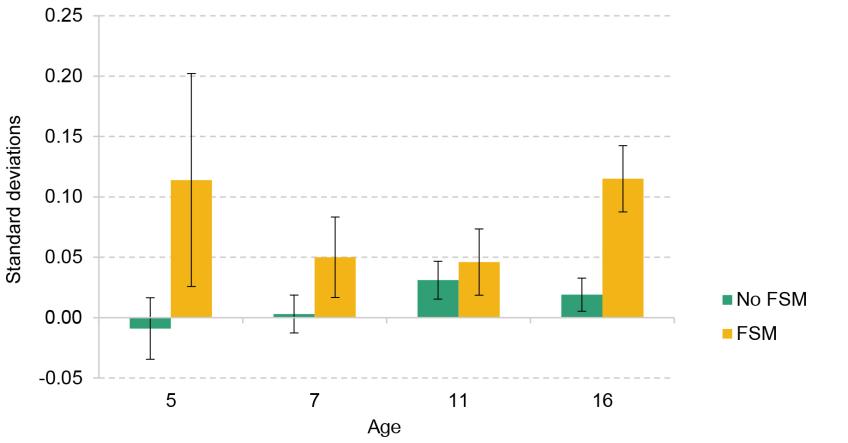
Note: At each age, results represent the difference in test scores as a result of living within 2.5km of a Sure Start centre, relative to living further away. Error bars represent 95% confidence intervals. The set of cohorts used is different for each age group; see Table 3.1 for details.
Source: ONS. Authors’ calculations using data from the National Pupil Database.
Throughout childhood, we continue to see larger effects for those from lower-income backgrounds: at age 7, we see a 0.050 standard deviation increase; at age 11, we see a 0.046 standard deviation increase; and at age 16, we see a 0.115 standard deviation increase, which is very large: it represents an average improvement of 3.0 GCSE grades as a result of exposure to Sure Start.
Figure 5.2 shows the breakdown of FSP scores for children eligible for free school meals. It highlights that this was a relatively broad developmental improvement. Despite the lack of precision of our estimates due to a smaller sample size, we find statistically significant improvements in developmental scores in three of the six categories: personal, social and emotional development; communication and language, which still has the biggest improvement; and mathematics and reasoning. We also see positive and large, though not significant, effects on knowledge and creativity.
Figure 5.2. Effect of Sure Start on developmental scores for FSM-eligible children
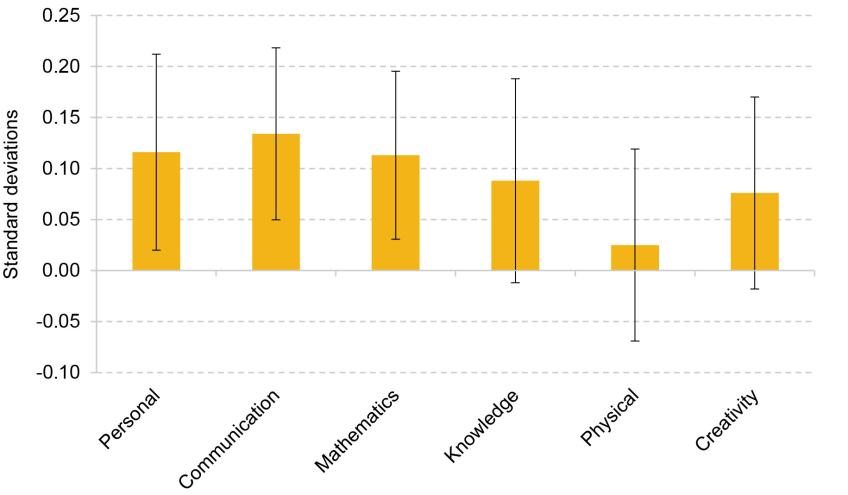
Note: Results represent the difference in each category of developmental scores as a result of living within 2.5km of a Sure Start centre, relative to living further away. Error bars represent 95% confidence intervals.
Note: Results represent the difference in each category of developmental scores as a result of living within 2.5km of a Sure Start centre, relative to living further away. Error bars represent 95% confidence intervals.
We also appear to see differences for those from low-income backgrounds for effects on SEN status. Figure 5.3 shows the difference in the effect of Sure Start on any type of SEN throughout childhood, broken down by whether children were eligible for free school meals or not. While none of the differences between ‘FSM’ and ‘No FSM’ is statistically significant (because of the small number of FSM-eligible children in our sample, and thus the wide error bars), there is a clear disparity in the patterns of the estimates between the two groups. For children not receiving free school meals, the estimates of the effect of Sure Start on SEN are positive at three of the four ages considered. Meanwhile, for children from low-income backgrounds, the estimated effect of Sure Start was a reduction in SEN at all ages.
Figure 5.3. Effect of Sure Start on SEN, by income
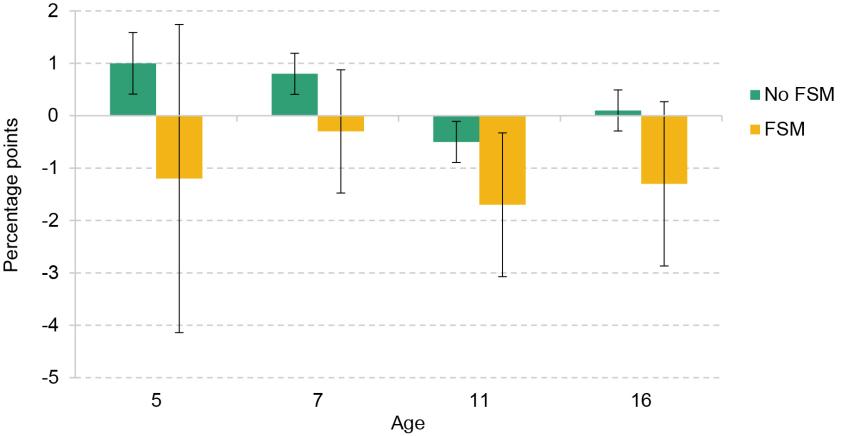
Note: At each age, results represent the difference in SEN overall (including both SEN Support and EHC Plans) as a result of living within 2.5km of a Sure Start centre, relative to living further away. Error bars represent 95% confidence intervals. The set of cohorts used is different for each age group; see Table 3.1 for details.
Source: ONS. Authors’ calculations using data from the National Pupil Database.
The disparity in the results for the two groups also suggests, though does not prove conclusively, that the positive overall effect of Sure Start on SEN at young ages and the negative overall effect of Sure Start on SEN at older ages (seen in Figure 4.3) are not focused on the same children: it appears that the positive effect at younger ages was driven by higher-income children, while the negative effect at older ages was driven by those from lower-income backgrounds. This makes it less likely that the story is one of earlier diagnosis leading to a reduction in need in the medium run for the same children.
5.2 Impacts by gender
Figure 5.4 shows the effect of exposure to Sure Start by gender on academic outcomes. The effects are broadly similar for boys and for girls.
Figure 5.4. Effect of Sure Start on test scores, by gender
Note: At each age, results represent the difference in test scores as a result of living within 2.5km of a Sure Start centre, relative to living further away. Error bars represent 95% confidence intervals. The set of cohorts used is different for each age group; see Table 3.1 for details.
Source: ONS. Authors’ calculations using data from the National Pupil Database.
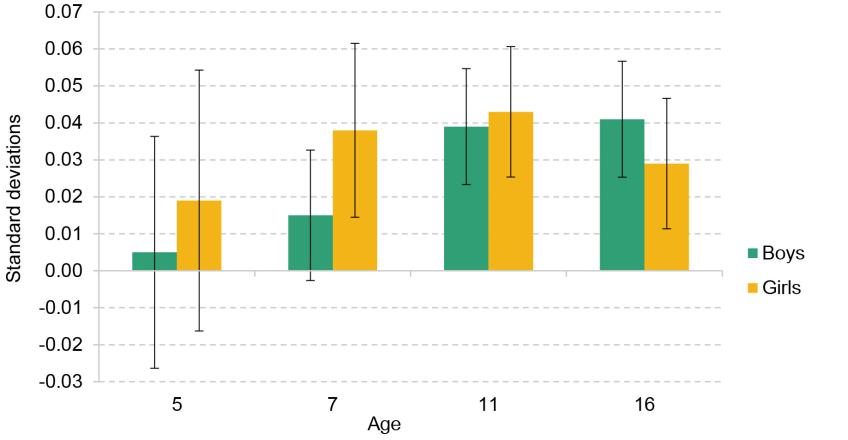
There are more visible gender differences when it comes to the effect of Sure Start on SEN, shown in Figure 5.5, though these differences are not statistically significant. Once again, the results point to the positive and negative effects of Sure Start on SEN not being driven by the same children. At age 5, the increase in SEN appears to be driven more by boys than by girls, indicating that any increased diagnosis effect from Sure Start is likely to come from boys. However, the longer-run decrease in SEN seems to be driven mostly by a reduction in recorded needs amongst girls specifically.
Figure 5.5. Effect of Sure Start on SEN, by gender
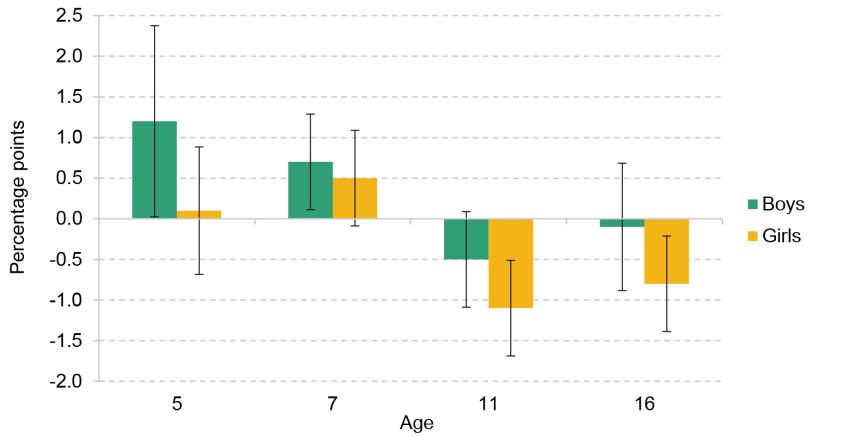
Note: At each age, results represent the difference in SEN overall (including both SEN Support and EHC Plans) as a result of living within 2.5km of a Sure Start centre, relative to living further away. Error bars represent 95% confidence intervals. The set of cohorts used is different for each age group; see Table 3.1 for details.
Source: ONS. Authors’ calculations using data from the National Pupil Database.
5.3 Impacts by ethnicity
Figure 5.6 breaks down the impact of Sure Start on academic outcomes by ethnicity. To ensure our results are precise, we produce estimates of the effect for white students and for students from non-white backgrounds. These demonstrate that the academic effect is much larger for non-white students. At most ages, these students receive large positive and significant effects from having attended Sure Start, while the effect on white students is very small. The effect of Sure Start on those from non-white backgrounds, while not as large as the effect on those eligible for free school meals, is still considerable – at Key Stage 4, it is equivalent to 1.8 GCSE grades. These larger-magnitude effects do not seem to present themselves in the effect of Sure Start on SEN, where there are no significant differences by ethnicity.
Figure 5.6. Effect of Sure Start on test scores, by ethnicity
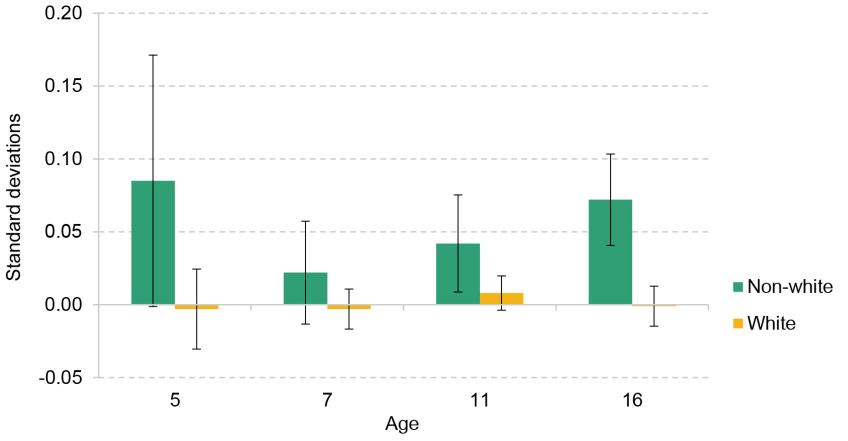
Note: At each age, results represent the difference in test scores as a result of living within 2.5km of a Sure Start centre, relative to living further away. Error bars represent 95% confidence intervals. The set of cohorts used is different for each age group; see Table 3.1 for details.
Source: ONS. Authors’ calculations using data from the National Pupil Database.
Looking at only the white subsample of children, we see no significant effects on academic performance at any age. Children from ethnic minorities are overrepresented among children from low-income backgrounds, so it is not easy to disentangle the two effects. We break the results down further and examine the effect of Sure Start on two other subgroups: white children who were eligible for free school meals and children from non-white backgrounds who were not eligible for them. For both these subgroups, Sure Start had significant positive effects on GCSE results. This suggests that neither ethnicity nor income can fully explain the disparity in effects that we see across both dimensions. It also implies that for the subset of white children who were not from low-income backgrounds, there was no effect.
To consider another possible mechanism that might help explain these results, we examine how the effect of speaking English as a first language interacts with exposure to Sure Start. Those who do not speak English as a first language are more likely to be non-white than the population as a whole and, given the effectiveness of Sure Start at improving language and communication skills, it seems reasonable to think that Sure Start might therefore be most effective amongst those who spent less time speaking English at home at a young age. Figure 5.7 contrasts the effect sizes for those who do not speak English as their first language with results for the whole population.
Figure 5.7. Comparison of academic effects by first language
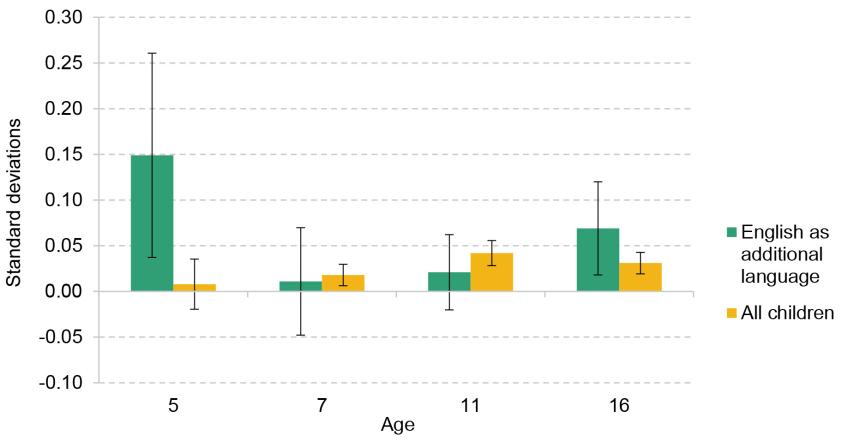
Note: At each age, results represent the difference in test scores as a result of living within 2.5km of a Sure Start centre, relative to living further away. Error bars represent 95% confidence intervals. Results given for all children are identical to those shown in Figure 4.1 and are included here for comparison. The set of cohorts used is different for each age group; see Table 3.1 for details.
Source: ONS. Authors’ calculations using data from the National Pupil Database.
The results show that the large effects for non-white children cannot be explained by differences in first language. While the effect for those who do not speak English as a first language is significantly higher at age 5, this does not translate into an effect size as big as for non-white students in later years. Given that the proportion of non-native English speakers is much smaller than the proportion of non-white students, and there are lots of non-native speakers who are white, this suggests the role of non-native English speakers is not sufficient to explain the large difference between non-white and white students.
6. Local Programmes, Children’s Centres, and mechanisms
There is another comparison we can draw, which is between the two eras of Sure Start centres: Local Programmes and Children’s Centres. There are many reasons to believe that the two types of centres would have different effects on different outcomes. As discussed in Section 2, SSLPs had much larger budgets per centre than SSCCs, which meant they spent much more on some services and on outreach. SSLPs also gave local communities a lot more freedom to decide what services they offered, while SSCCs needed to follow the ‘Core Offer’ and engaged their communities less in choosing the services they would offer.
6.1 Impacts by centre type
In order to estimate the differential effects of SSLPs and SSCCs, we consider separately the effect of living near a Sure Start centre that opened before and after 2003, when Sure Start Children’s Centres were introduced. This means that we will be including Children’s Centres that were initially Local Programmes as SSLPs. This is still beneficial, as records from the National Audit Office (2006 and 2009) and from Stewart (2013) show that former SSLPs that converted to SSCCs acted quite differently from newer SSCCs, meaning that we are also estimating the effect of this difference in behaviour between the two types of SSCCs.
The effect of Sure Start on academic effects, broken down by centre type, is given in Figure 6.1. There is no significant effect up to age 7 (and in fact, the point estimate for the effect of SSLPs on developmental scores at age 5 is negative), but there is a large and significant difference in the effect on academic performance at ages 11 and 16. In both cases, the effects are much larger for SSLPs, while the effects for SSCCs are insignificant at all ages. It therefore appears that our overall results are driven almost entirely by the effectiveness of centres that opened as Local Programmes. These centres were effective at improving attainment both in the period when they were known as SSLPs and once they had been converted to SSCCs and other SSCCs had opened.10
Figure 6.1. Effects on test scores of centres that opened as SSLPs and as SSCCs
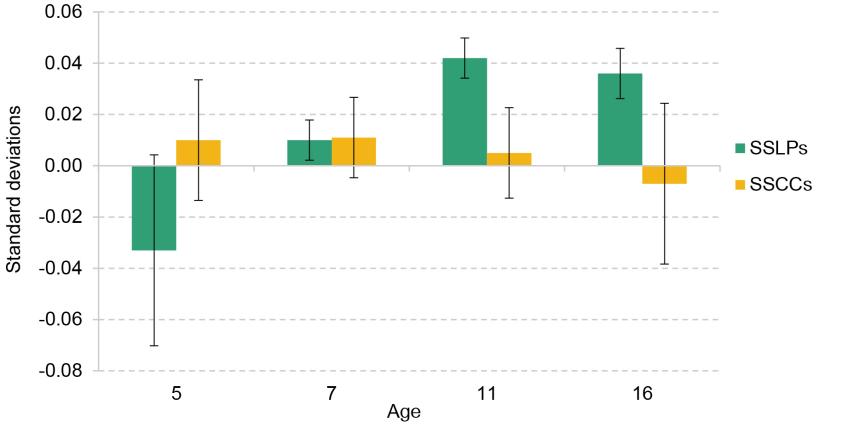
Note: At each age, results represent the difference in test scores as a result of living within 2.5km of a Sure Start centre, relative to living further away. Error bars represent 95% confidence intervals. The set of cohorts used is different for each age group; see Table 3.1 for details.
Source: ONS. Authors’ calculations using data from the National Pupil Database.
6.2 Potential mechanisms
Changing comparison group
One could perhaps expect our method to show larger effects for Sure Start Local Programmes than for Sure Start Children’s Centres. This is because in each case we are examining the effect of a Sure Start centre opening within 2.5km of someone relative to those in the cohort before them, who did not live within 2.5km of a Sure Start centre, and just missed out. In 1998, the year before the first SSLPs opened, those cohorts that just missed out would have had no ability at all to visit a Sure Start centre. However, by 2005, when SSCCs were opening, those who just missed out might have had the opportunity to attend another Sure Start centre that was more than 2.5km away. If some of them had done this, the opening of an SSCC would only affect those who were not already using a Sure Start centre, and using one would be much more common than in the early years of SSLPs. Using data on the take-up of free childcare from Sure Start centres, we estimate that this could explain the effect of Sure Start Local Programmes being up to twice as large as the effect of Sure Start Children’s Centres.11 Therefore, it is not sufficient to explain all of the difference we see at age 11 or 16, where the effect of SSLPs is up to eight times that of SSCCs.
Different budgets, services and outreach
Because the difference in effect sizes cannot be explained by the changing comparison group, it is necessary to consider other explanations for why centres that started off as SSLPs were so much more effective than new SSCCs, and continued to be as they were converted to SSCCs. One potentially important factor is the relative budget of the two programmes. In Section 2, we demonstrated that the budget per centre fell dramatically between 2003, the last year of Local Programmes, and 2010, the last year of the expansion of Children’s Centres. Stewart (2013) shows that this disparity in budget between centres that opened as SSLPs and those that opened as SSCCs continued for former SSLPs, as their budgets remained about double those of centres opened between 2004 and 2006. This strongly suggests that Sure Start centres were much more effective when they had larger budgets. In fact, we are not able to find statistically significant effects from exposure to later centres, which had smaller budgets.
Different budgets may have allowed centres to offer different services (in both breadth and depth) and to engage more or less actively in outreach to ensure that those services were used by those families who would benefit the most. A deeper understanding of what drove differential effectiveness between centres that opened before 2003 and after 2003 therefore requires analysis of which services were more prominent across different types of centres. A report from the National Audit Office (NAO) in 2009 counts which services were used more in former Local Programmes than in Phase 1 and Phase 2 Children’s Centres. All types of centres had similar numbers of children attending day care and other forms of early learning, though former SSLPs spent much more on staffing resources for teacher input in learning development. Former SSLPs also came into contact with more families for two reasons: parental outreach and family health.12 This provides suggestive evidence that these factors may have been significant for the effectiveness of Sure Start.
Parental outreach, in which centre staff travelled to assist families with Sure Start services, such as health services and special needs support, was a particularly resource-intensive service. The NAO found that it was by far the most expensive service per hour for Sure Start centres, which was likely why it was so much more common in better-funded centres. Given the effectiveness of Sure Start for children of parents with low incomes, it may well be that additional outreach was important for reaching these families in particular. In turn, this would have meant that SSLPs and former SSLPs were particularly effective, because they were able to ensure that those who could benefit most from Sure Start were using it. Of course, SSLPs generally served very deprived areas, so it may be that parental outreach was only effective in these areas, where there may have been more families who needed more support in accessing Sure Start services, but also could benefit a lot from these services if they did access them. It is also possible that higher spending (per participant) on other services, such as early learning and family support, may have improved the quality of Local Programmes.
6.3 Summary
The combination of a changing control group and large differences in budgets between SSLPs and SSCCs is likely sufficient to explain most of the drop-off in effectiveness we observe from Local Programmes to Children’s Centres, although it is plausible that enhanced outreach to parents was also important. It is also possible that other factors may have played a role too: for example, up until 2003, SSLPs were much more locally driven, with greater community input, which might be an additional factor increasing the effectiveness of Sure Start amongst those centres.
7. How do we measure the effect on those who used Sure Start?
Up to this point, this report has focused solely on the effect of living near a Sure Start centre relative to living further away. This is an ‘intention to treat’ effect of the Sure Start programme on individual outcomes. However, there will have been some children who lived within 2.5 kilometres of a Sure Start centre who had no interaction at all with the centre, as well as some children who lived further away who will have used a centre. This means that the comparison we are making is not between one group (those living within 2.5km) in which everyone uses a centre and another (those living further away) in which no one uses a centre, but rather a comparison between one group with a higher probability of attendance than the other.
While, as we discussed earlier, this ‘intention to treat’ effect is highly policy relevant, it is also of interest to understand how much an individual who actually used a Sure Start centre may have benefited from doing so, relative to someone who did not. This can provide insight into the benefits of encouraging people to use an existing service, for example.
To estimate the impact of Sure Start on those who actually used these services, we require an estimate of the impact of living within 2.5km of a Sure Start centre (as opposed to living further away) on the probability of using these services. This information is not readily available in any existing data sources, but we use data from surveys in 2012 of both families and centres from the ECCE reports on children who were registered at a Sure Start Children’s Centre at that time, together with figures on the total population size from the National Pupil Database, to produce approximate estimates for these participation rates. Full details of how we do so are set out in Appendix Section A.5.
Our best estimates are that living within 2.5km of a Sure Start centre made children between 28 and 41 percentage points more likely to attend than children living further away. If we assume that all of the difference in outcomes that arises because of living near a Sure Start centre is because of the increased likelihood of using the services – and we assume that the effects of attending a Sure Start centre are the same regardless of whether you live nearer or further away – then we can say that the results we find are concentrated amongst the 28–41% of the population who only attend Sure Start because they live near a centre. Adjusting for this means multiplying each effect by 2.4 to 3.6 in order to get the effect of Sure Start specifically on those who attended.13
This implies that the effect of Sure Start on those who attended is much larger than the effect of living nearby. For example, we estimate that the effect of using Sure Start on GCSE grades at age 16 is between 0.08 and 0.11 standard deviations, so between 2.0 and 2.8 grades. Meanwhile, the effect of using Sure Start on SEN status at age 16 is between 1.3 and 1.8 percentage points, indicating a reduction in special educational needs of between 7% and 9%.
8. Cost–benefit analysis
In this section, we provide a simple estimate of the financial benefits of the educational effects of Sure Start and contrast them with the cost of Sure Start. We combine official estimates of the cost of Sure Start with the estimates provided in this report, which we value using official government estimates of the costs and benefits of academic attainment and support for special educational needs.
If Sure Start centres had clearly defined catchment areas, with only children living inside those areas able to use the services and those living outside unable to use them, estimating the total benefit of Sure Start would be a straightforward exercise. It would mean that all of the costs of the centre – all of the government funding – would be spent on children living inside the catchment area and that all of the benefits would be attributable to them as well. However, as we discussed in Section 7, a large number of children living outside of the 2.5km radius we consider used Sure Start services as well. We therefore calculate costs and benefits per child who actually used Sure Start services.
8.1 Costs
We follow Cattan et al. (2021) in estimating the effect, and the cost, of Sure Start across both SSLPs and SSCCs, but we report the cost relative to the number of children who attended Sure Start centres. Using survey data from the ECCE reports, we estimate that as a central estimate, 68% of young children had used a Sure Start centre from 2011 to 2012, just after the peak of Sure Start.14 This translates to just over 100 children per cohort attending each centre, which in turn implies that by 2010 approximately 380,000 children per cohort used a Sure Start centre.15
The total cost of Sure Start in 2010, including both current and capital spending, was £2.52 billion.16 Therefore, the cost per child attending Sure Start in 2010 was approximately £1,300, across the five cohorts eligible for Sure Start in 2010.
8.2 Benefits
The economic and fiscal benefits that need to be weighed against the cost of the programme are twofold: reductions in the number of children recorded with SEN entail savings for the government, while improvements in educational attainment have implications for lifetime earnings for children who attended Sure Start. In each case, when estimating the benefits, we follow the HM Treasury approach specified in the ‘Green Book’, discounting all future benefits at an annual rate of 3.5%.17
To obtain a central estimate of the benefits of Sure Start for each child who attends, we follow the method outlined in Section 7 to transform the effect of living near a Sure Start centre into the effect of attending a Sure Start centre. In the central estimate of Sure Start attendance, living near a Sure Start centre increased the probability of attendance by 35 percentage points. Therefore, to get the effect of attendance, we multiply results in Section 4 by 2.9.18
The first effects we consider are the cost reductions to the government that come from reduced demand for SEN Support and EHC Plans as a result of Sure Start, as well as the extra costs where provision of these became more common because of Sure Start. Data on the costs of this support are taken from the notional SEN budget for mainstream schools, for both SEN Support and EHC Plans.19 The notional SEN budget assumes that the average cost for supporting a child with SEN is £3,000 per year, while the average EHC Plan in a mainstream school costs £6,000 per year.
Only incorporating effects that are statistically significant, we estimate that the net effect of Sure Start meant that the government had to spend £504 less per child (over the course of their primary and secondary schooling) on additional support for those with special educational needs for those who attended a Sure Start centre.
In addition to estimating the cost reductions of Sure Start, we also estimate the benefits to students of increases in expected lifetime earnings. Research from the Department for Education (Hodge, Little and Weldon, 2021) estimates that a 1 standard deviation increase in GCSE results will translate to an increase in discounted lifetime income of £96,111 (or £109,836 in 2022–23 prices). Using our central estimate of the effect of attending Sure Start, we estimate that attending Sure Start increased GCSE results by 0.09 standard deviations. From this, we estimate that attending Sure Start would have increased the average child’s discounted lifetime earnings by £6,659.20 Following Hodge et al., we do not consider what proportion of this income would take the form of returns for the exchequer, due to the complexity of assessing what proportion of increased gross earnings would be taken in tax.
8.3 Costs versus benefits
We use these figures to construct a cost–benefit analysis for the cohort that used Sure Start centres from 2006 (at age 0) to 2010 (at age 4). We use 2010 as our final year as it was the peak of the spread of Sure Start, which means that there were very few children in this cohort who were only partly exposed to Sure Start. In doing this, we best capture the effect of Sure Start running as an established programme. However, this means that our analysis of the benefits to some degree overestimates the effect of Sure Start in earlier years, when many children were only partially exposed to Sure Start.21 There are other factors that may influence whether Sure Start would have been more cost-effective in earlier years: it was more expensive per attendee, but more of the centres were Local Programmes, which would have made it more effective. Our method does not easily allow us to construct estimates of the effect of Sure Start in each year, so we are unable to say whether it would have been more or less effective.
In 2009–10, the UK government spent £2.52 billion on Sure Start (in 2022–23 prices), across both current and capital budgets. For the cohort born in 2006, we estimate that of this cost, £192 million, or 7.6%, was averted in the medium run due to a reduction in spending on SEN. Furthermore, we estimate that Sure Start created £2.53 billion extra in discounted lifetime earnings for this cohort of children who used a centre in 2010.22 These private benefits are very similar to the total up-front cost of Sure Start at its peak. When the reduction in costs from SEN are taken away from the total cost, the total financial benefit from Sure Start is 109% of the cost, representing a positive return to Sure Start, just from the school outcomes of the policy.
Table 8.1. Estimated costs and benefits of Sure Start per cohort, 2010
| Total costs | £2,520 million |
| Costs averted | £192 million |
| Total benefits | £2,533 million |
Note: 2022–23 prices.
These estimates rely on a key assumption. This is that those who attended Sure Start centres but lived more than 2.5km from a centre were impacted by attending Sure Start equally to those who lived closer to a centre. This is a reasonable assumption, though it is plausible that those who lived further away might have been affected less strongly. To account for this, we estimate a lower bound on the possible benefits and averted costs of Sure Start, in the scenario where no children living more than 2.5km from a centre benefited from Sure Start. The implication of this would be that the effects shown in Sections 4 and 5 represent the entire effect of Sure Start, rather than just the difference between living and not living nearby. In this scenario, the averted costs comprise only £67 million for the cohort born in 2006, while benefits amount to £951 million for the same cohort. This is significantly smaller, but still amounts to benefits equal to almost 40% of the total up-front cost.
The results of Cattan et al. (2021) should also be considered when looking at the total cost of Sure Start. They estimate that almost a third of the cost of Sure Start is taken away by the savings made on long-run health spending. Combined with savings from the reduction in the cost of SEN provision, we estimate that the proportion of the total cost that is averted is 39% before consideration of increased tax receipts for the exchequer. Given the private benefits we find, the combination of the hospitalisation and academic effects of Sure Start implies a much larger private benefit than the government cost. Meanwhile, other research is ongoing to consider the impact of Sure Start on children’s social care usage and on youth offending – beneficial effects there would also imply a reduced cost to the government. Therefore, there is still more to say with regards to the costs and benefits of this programme.
9. Conclusion
In England, Sure Start pioneered the concept of an early years programme that provided a comprehensive range of services under one roof, incorporating health services, parenting support and childcare in the same centre. Despite the winding down of Sure Start since 2010, the recent introduction of Family Hubs – which also seek to join up family support services, though for children aged 0–18 and not necessarily all within an actual centre – means that understanding whether, for which children and in which situations integrated service provision is effective remains an important and topical policy issue.
Following recent work by Cattan et al. (2021) on health outcomes, this report adds to the evidence base regarding the short- and medium-run impact of the Sure Start programme by focusing on children’s education outcomes. Using administrative data spanning many cohorts and following children over a long period, we explore the effects of Sure Start on national achievement test scores and special educational needs status both in the immediate aftermath of Sure Start usage and over 10 years later.
We find strong evidence for the benefits of Sure Start on academic performance, particularly at older ages, with the effects especially large for children from low-income families and those from a non-white background. The effects on performance seem to grow over time as children get older. There are many plausible explanations for these rising effects, with one possibility being that improvements in communication skills at age 5 for children exposed to Sure Start play a role in helping children to better access the curriculum from an early age, developing stronger foundations on which to build throughout school.
We also find that Sure Start had significant effects on the proportion of children recorded as having special educational needs. At younger ages, more boys and more children not eligible for free school meals were identified as needing extra support with SEN, while at older ages, fewer girls and fewer children from lower-income backgrounds had an Education and Health Care Plan. The fact that the results differ across gender and income suggests that this is not necessarily a case of early detection helping to reduce long-term need. Overall, however, the net effect of these findings is that Sure Start reduced the financial outlay by the government in relation to children with SEN, in no small part because of the reduction in need for more severe plans at later ages.
Importantly, the evidence from this study (in line with that from Cattan et al. (2021)) also shows that the benefits of the programme were concentrated among disadvantaged families – suggesting that the programme was inequality-reducing from early childhood all the way through adolescence.
We find that centres originally opened as Sure Start Local Programmes were much more effective at improving children’s education outcomes than centres opened later under the Sure Start Children’s Centre programme. The difference in effectiveness is broadly proportional to the difference in budget per centre between the two programmes, suggesting that the generous funding that SSLPs received was likely a driver of the positive effects they created. It is also worth noting that SSLPs spent much of their extra funding on parental outreach, which likely ensured that Sure Start services reached those less likely to seek them out – and potentially more likely to benefit from accessing them – highlighting the potential importance of this channel for the effectiveness of the programme as a whole and for low-income families in particular.
Our results imply that, even without accounting for the full range of potential effects, the benefits to society from the improvements in education outcomes reported herein equate to more than the costs of the programme at its peak in 2010. These benefits are primarily driven by a significant increase in lifetime earnings from improved academic performance at age 16, with the net reductions in spending on SEN making a small additional contribution. If we were to consider the reduction in hospitalisations identified in Cattan et al. (2021) and any additional benefits identified in ongoing research on the effect of Sure Start on children’s social care provision and juvenile offending, the cost–benefit figures might improve even further. And there may well have been other benefits of Sure Start that cannot be readily measured in monetary terms.
Our findings suggest that integrating services in deprived areas can make a material difference to children’s outcomes, but only if they are properly funded. Family Hubs have been given much less funding: just over £100 million per year, compared with £300 million per year in the first year of Sure Start (and £2.5 billion per year at its peak). It is unclear to what extent the early years focus was integral to the success of the Sure Start programme; Family Hubs have been given broader responsibilities for all children, not just those under 5. On the one hand, a wealth of evidence has highlighted the importance of the early years for later outcomes, as well as the relative cost-effectiveness of investing earlier rather than later, suggesting that a continued focus on early years may be warranted even within the broader age remit of the new Family Hubs. On the other hand, if Family Hubs provide a vehicle through which to back up similarly strong investments in early years with continued investments as children get older, it may be possible for the effects to be even larger.
The results presented here highlight that providing effective family support in the early years, and ensuring that the families most likely to benefit from the services are accessing them, will be very difficult to deliver on a shoestring. And replicating the kinds of medium-term benefits outlined in this report would certainly require policymakers to make further investments in the network of Family Hubs they are creating. However, it is important to remember that while spending on many public services has shrunk since 2010, the early years are one of the few branches of the welfare state that has carried on growing, primarily because of the expansion of the free entitlement policy. Sure Start represented a third of all early years spending at its peak in 2010–11; that amount would only represent a quarter of current overall spending and a sixth of planned spending by 2026 when the expansion of the free entitlement announced at Budget 2023 should be fully implemented.
While it is clear that policymakers need to make further investments in the network of Family Hubs to replicate the kinds of medium-term benefits outlined in this report, whether they wish to invest additional money or reallocate spending on existing policy will essentially come down to the objectives they are seeking to achieve and the families they are aiming to support. The research on Sure Start to date demonstrates that investing in integrated early years support programmes can deliver individual and social benefits that outweigh their cost and reduce socio-economic inequalities in a range of outcomes in a lasting fashion.
Appendix
A.1 Difference-in-differences specification
The difference-in-differences method estimates the effect of a Sure Start centre opening (in our case, the treatment) by calculating the difference between the change in outcomes over time in areas where Sure Start centres opened and the change in outcomes over time in areas where no centres opened. This relies on the assumption that there is no other reason why the outcomes in areas with Sure Start centres might have changed in a different way from those in other areas.
The most common reason why this might not be true is if the pre-treatment trends in areas with and without centre openings are not parallel. For example, if Key Stage 2 results were improving quickly in areas where Sure Start centres opened even before the centres opened, but were not changing in areas where Sure Start centres did not open, then our difference-in-differences method would pick up that difference as part of the effect of Sure Start. This could plausibly be happening, as Sure Start’s roll-out was specifically targeted to areas with higher deprivation, higher teen pregnancy rates and higher levels of low birthweight. Areas with these features might have been changing differently from other areas, perhaps because they were catching up with areas with better outcomes.
To account for this, we control for deprivation of each LSOA, to ensure we are not capturing the effects driven by deprivation. Additionally, we calculate the pre-treatment trends in each outcome by local authority, a larger geographical area, and control for these trends. This gives more emphasis to the comparison in the differences for those treated areas that have more similar trends to untreated areas, and vice versa. This resembles the synthetic difference-in-differences method proposed by Archangelsky et al. (2021), but using the method for aggregating staggered difference-in-differences proposed in Callaway and Sant’anna (2021). With the latter estimator, controls are implemented using propensity score matching of pre-treatment values only.
Figure A.1 shows that with these controls, there are parallel pre-treatment trends between treated and untreated LSOAs. The chart shows the difference between those with and without Sure Start centres in the difference in trends between year t–1 and each year. The fact that there is no trend in the values before year 0 (when the Sure Start centre opened) indicates that GCSE outcomes for those too old for Sure Start were not changing in different ways in the two types of area. Figure A.2 shows that the same is true for the effect on SEN status at age 16. These parallel trends hold for all our headline results (except for those at age 5, where we are unable to see pre-treatment trends due to a lack of data from earlier years).
Figure A.1. Effect of Sure Start on academic outcomes at age 16, by treatment length
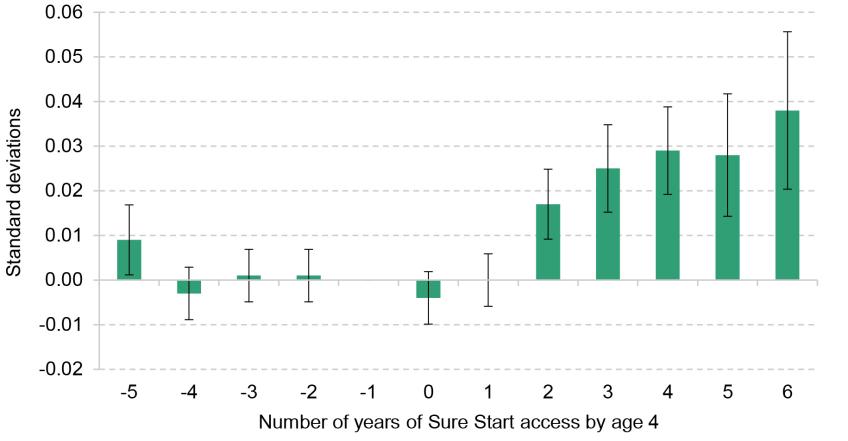
Note: Children born after a Sure Start centre opened near them are displayed as having five or six years of Sure Start access, even though some of these years are before their birth.
Source: ONS. Authors’ calculations using data from the National Pupil Database.
Figure A.2. Effect of Sure Start on SEN status at age 16, by treatment length
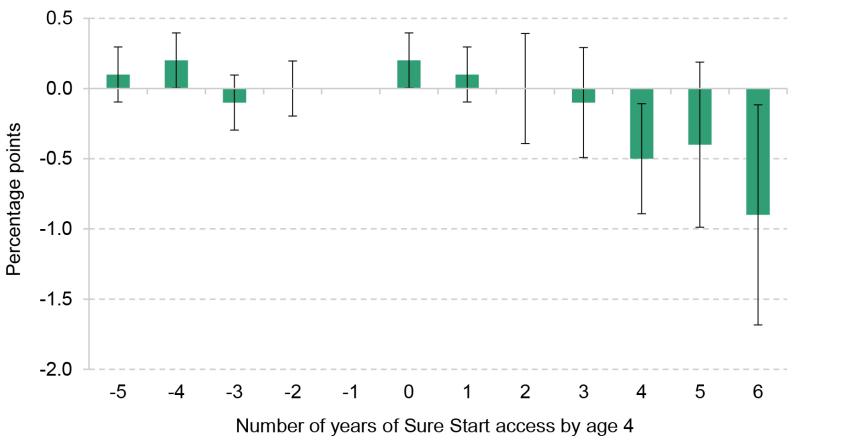
Note: Children born after a Sure Start centre opened near them are displayed as having five or six years of Sure Start access, even though some of these years are before their birth.
Source: ONS. Authors’ calculations using data from the National Pupil Database.
These event studies also demonstrate interesting dynamics with regards to the effect of a Sure Start centre opening on children who were between 0 and 4 when it opened. In both charts, the estimate at ‘0’ represents the effect on those who were aged 4 when a Sure Start centre first opened near them. Meanwhile, the estimate at ‘4’ represents the effect on those who were born the year the centre opened, and years beyond that represent the effect on those who were born in the years after a centre opened. Therefore, those who are fully treated are those from ‘4’ onwards, while those who are partially treated by Sure Start are those who were aged between 1 and 4 when a Sure Start centre opened, and so had between 0 and 3 years of Sure Start access on the chart.
Figures A.1 and A.2 show that the effects were much smaller for partially treated children than for fully treated children. Being partially exposed to Sure Start only increases GCSE grades by 0.007 standard deviations, equivalent to only 0.2 grades, less than a quarter of the effect on those fully exposed. The drop-off is even more stark for SEN status, perhaps providing suggestive evidence that the full programme is more important for the reduction in special educational needs than it is for educational improvement. We see no decrease at all in these needs at age 16 (or age 11) for those who only have some exposure to Sure Start.
The other potential confounder of the difference-in-differences method that might cause our results to not capture the true effect of a Sure Start centre opening is if something else happened in areas where Sure Start centres opened at a similar time. In this case, we might be capturing the effect of these changes rather than of Sure Start. To test this, Cattan et al. (2022) estimate the link between the opening of Sure Start centres and a wide range of other impacts in the local area, which one would not expect to be affected by Sure Start. They find no clear effects, which suggests that our results are not capturing any other latent trends in local communities, or any other policy impacts.
A.2 Summary statistics
Table A.1 shows educational outcomes at different ages for those unaffected by Sure Start, both for the whole sample and for different groups. There are large gaps by income (as measured by eligibility for free school meals) in academic and SEN outcomes, and smaller gaps by gender, with girls having better outcomes than boys. There are limited differences in outcomes between white and non-white children.
Table A.1. Educational outcomes across different groups
| Percentage with... | ||||||
|---|---|---|---|---|---|---|
| Group | Good development, | 5 A*–C, age 16 | SEN, | SEN, | SEN, | SEN, |
| All | 55% | 57% | 8% | 20% | 23% | 20% |
| Boys | 46% | 53% | 10% | 26% | 29% | 24% |
| Girls | 63% | 62% | 5% | 14% | 17% | 16% |
| No FSM | 57% | 61% | 7% | 18% | 20% | 17% |
| FSM | 33% | 33% | 16% | 35% | 39% | 36% |
| White | 55% | 56% | 8% | 20% | 23% | 20% |
| Non-white | 51% | 61% | 8% | 21% | 23% | 20% |
Note: All results reported for children in the sample not living near a Sure Start centre. Children are defined as having a good level of development at age 5 if they are at the expected level for the 12 Early Learning Goals within the five areas of learning relating to: communication and language; personal, social and emotional development; physical development; literacy; and mathematics.
Source: ONS. Authors’ calculations using data from the National Pupil Database.
A.3 Effect of former SSLPs
The analysis in Section 6 focuses on the difference in effect between SSLPs and former SSLPs, which opened between 1999 and 2003, and SSCCs, which opened between 2004 and 2010. In 2004, SSLPs converted to SSCCs, but maintained several differences in funding and practice, as outlined in Section 6. Therefore, to understand whether these differences made a difference to the effect of Sure Start, it is necessary to show that it was not just that SSLPs were effective from 1999 to 2003, but also that former SSLPs were more effective than newer SSCCs from 2004 onwards. To do this, we show the event study plot of the effect of Sure Start, purely for those who lived near a centre that was once an SSLP. These results are shown in Figure A.3. The effect for those with four years of Sure Start access by age 4 is the effect for those who were born in the year a Sure Start Local Programme opened. (This will cover some of the children born between 1999 and 2003, the years in which an SSLP could have opened.) For these individuals, the effect of Sure Start on Key Stage 2 grades (which we use to include data on those born in later years) was 0.036 standard deviations. Meanwhile, the effect for those four years later, with eight years of Sure Start ‘access by age 4’, is for those born four years after a centre opened. This means that they lived near a centre that opened as an SSLP, but were born between 2003 and 2007. Therefore, if the effect of SSLPs tailed off when they became Children’s Centres, we should expect the effect to be lower for these children than for those born four years earlier. In fact, it is bigger, with a 0.048 standard deviation increase in KS2 results for those who lived near an SSLP, relative to those who did not live near any Sure Start centre. This suggests that the effect of centres that opened as SSLPs is not just driven by the pre-2003 cohorts, but also by those who attended in the years when they were known as Sure Start Children’s Centres, but had larger budgets and different spending patterns.
Figure A.3. Effect of SSLPs on Key Stage 2 grades, by treatment length
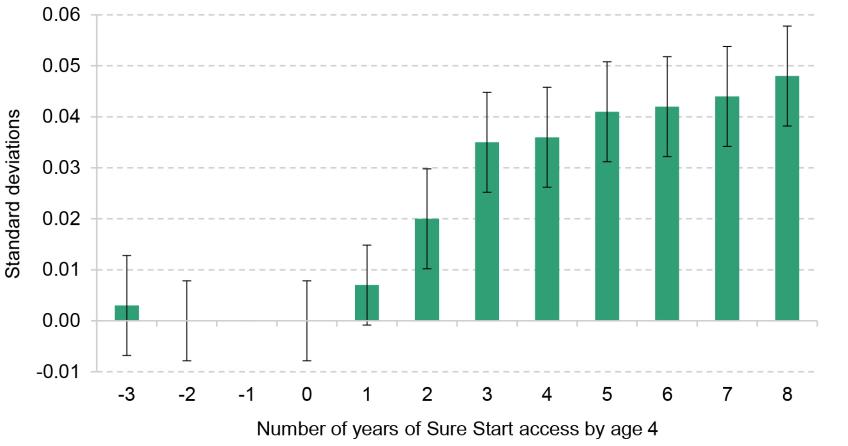
Note: Children born after a Sure Start Local Programme started near them are displayed as having five, six, seven or eight years of Sure Start access, even though some of these years are before their birth.
Source: ONS. Authors’ calculations using data from the National Pupil Database.
A.4 The mechanical differences between SSLPs and SSCCs
As discussed in Section 6, there is reason to think that we would find smaller effect sizes in SSCCs than in SSLPs, because of the changing control group. We examine the size of this potential confounding effect by using a combination of data from the Early Years Census from 2008 to 2010, a dataset included in the NPD, and locations of Sure Start centres. We use this to construct a dataset of those who took up their free childcare entitlement at Sure Start centres, and then estimate the effect of living different distances from a Sure Start centre on the probability of using it for childcare services. We assume that those who attend school nurseries or childcare centres in the exact same postcode as a Sure Start centre are using the Sure Start centre for childcare.
Table A.2 shows that living within 2.5km of a Sure Start centre makes you 2.3 percentage points more likely to use Sure Start for childcare than those living more than 10km away, but only 1.1 percentage points more likely to than those living between 2.5km and 5km away, an effect half the size. Getting your free entitlement through Sure Start centres was relatively rare, so these effect sizes are small. We assume here that patterns of childcare usage through Sure Start are similar to patterns of usage for other services in relation to the distance lived from the centre.
Table A.2. Effect of Sure Start on childcare usage by distance
| Distance comparison | Difference in childcare usage |
| Within 2.5km compared with 2.5–5km | 1.1 percentage points |
| Within 2.5km compared with 5–10km | 2.0 percentage points |
| Within 2.5km compared with >10km | 2.3 percentage points |
Note: ‘Difference in childcare usage’ represents how much more likely those living within 2.5km of a Sure Start centre are to use Sure Start for childcare than those who live different distances away.
Source: ONS. Authors’ calculations based on the Early Years Census, 2008–10.
Therefore, we should expect that the effect of living within 2.5km of an SSLP relative to not should be at most twice as big as the effect of living within 2.5km of an SSCC relative to not, as the maximum possible effect of living nearby on attending is twice as large as the minimum possible effect.
A.5 Details of the first-stage estimation
To compute the effect of living near Sure Start on attending a Sure Start centre, we collect information on the number of children registered at the average centre (Smith et al., 2014), survey answers on what proportion of those registered ever used Sure Start (Maisey et al., 2013), and how far registered users lived from the Sure Start centre (Goff et al., 2013). From the National Pupil Database, we also use data on the number of children in each cohort who did and did not live within 2.5km of a Sure Start centre.
Using these sources, we first compute the proportion of children aged 0–4 in England who used Sure Start services. Data from surveys of all Sure Start centres show that the average centre had 770 children registered at it in 2012. Multiplying across the number of centres, this means that over 2.5 million children aged 0–4, or about 90% of the total population, were registered at a Sure Start centre. However, in many cases children and families were automatically registered, such as when registration was closely linked to universal health visitor programmes, and in some cases they would never have had any contact with the children’s centre. The ECCE reports referenced in the previous paragraph provide two different interpretations of usage: the first comes from data from centres, who report that 55% of the 0–4 age group had used the centre in the last year. This may be an underestimate of total usage, since some may have used it more than a year ago, perhaps to benefit from the services targeted at newborn children, and then not used it again. Meanwhile, the survey of registered users reports that only 11% of them had never used the centre, implying that approximately 89% of the registered population and 80% of the total population used a Sure Start centre at some point. This should be thought of as an upper bound on total usage, since it is based on a survey of registered users that did not have a 100% response rate, and we expect those who never used the centre to have been much less likely to respond to the survey. Therefore, our best estimate is that the proportion of children aged 0–4 using Sure Start in 2012 was between 55% and 80%.
Using these bounds, data from the NPD on the proportion of children who lived within 2.5km of a Sure Start centre, and the proportion of Sure Start users who lived within 2.5km (which Goff et al. (2013) estimate to be approximately 90%), we now estimate the impact of living within 2.5km (as opposed to further away) on the probability of using Sure Start services. To do this, we use data on where children lived from the last cohort we have detailed data on (those born in 2006, whose exposure to Sure Start would have ended in 2010). There were about 563,000 children born in 2006 who appear in our Key Stage 2 sample. From our lower and upper bounds, we estimate that between 310,000 and 450,000 of them attended a Sure Start centre. If 90% of attendees lived within 2.5km of a centre, that means that, in the upper-bound case, around 405,000 children lived near a centre and attended, and about 45,000 did not live nearby but attended anyway. Of the 563,000 children born in 2006 who appear in our Key Stage 2 sample, around 465,000 lived near a centre and around 98,000 did not (based on our calculations in the NPD). This implies that about 87% of those who lived nearby attended and that about 46% of those who did not live nearby attended. This, in turn, implies that living near a Sure Start centre made children 41 percentage points more likely to attend. In the lower bound case, the equivalent figure is 28 percentage points.
References
Archangelsky, D., Athey, S., Hirshberg, D. A., Imbens, G. W. and Wager, S., 2021. Synthetic difference-in-differences. American Economic Review, 111(12), 4088–118.
Baker, M., Gruber, J. and Milligan, K, 2008. Universal child care, maternal labour supply and family well-being. Journal of Political Economy, 116(4), 709–45.
Bolt, U., French, E., Hentall-MacCuish, J. and O’Dea, C., 2021. The intergenerational elasticity of earnings: exploring the mechanisms. IFS Working Paper W21/07, https://ifs.org.uk/publications/intergenerational-elasticity-earnings-exploring-mechanisms.
Bouchal, P. and Norris, E., 2014. Implementing Sure Start Children’s Centres. Institute for Government, https://www.instituteforgovernment.org.uk/sites/default/files/publications/Implementing%20Sure%20Start%20Childrens%20Centres%20-%20final_0.pdf.
Callaway, B. and Sant’anna, P. H. C., 2021. Difference-in-differences with multiple time periods. Journal of Econometrics, 225(2), 200–30.
Cattan, S., Conti, G., Ginja, R., Farquharson, C. and Pecher, M., 2021. The health impacts of Sure Start. IFS Briefing Note 332, https://ifs.org.uk/publications/health-impacts-sure-start.
Cattan, S., Conti, G., Ginja, R., Farquharson, C. and Pecher, M., 2022. The health effects of universal early childhood interventions: evidence from Sure Start. IFS Working Paper W22/43, https://ifs.org.uk/publications/health-effects-universal-early-childhood-interventions-evidence-sure-start.
Children, Schools and Families Committee, 2010. Sure Start Children’s Centres. Fifth Report of Session 2009–10, House of Commons, https://publications.parliament.uk/pa/cm200910/cmselect/cmchilsch/130/13002.htm.
Currie, J., 2009. Healthy, wealthy, and wise: socioeconomic status, poor health in childhood, and human capital development. Journal of Economic Literature, 47, 87–122.
Department for Education and Employment, 1999. Sure Start: a guide for trailblazers.
Drange, N. and Havnes, T., 2019. Early childcare and cognitive development: evidence from an assignment lottery. Journal of Labor Economics, 37(2), 581–620.
Fright, M. and Davies, N., 2023. Performance tracker 2023: children’s social care. Institute for Government, https://www.instituteforgovernment.org.uk/publication/performance-tracker-2023/childrens-social-care.
Goff, J., Hall, J., Sylva, K., Smith, T., Smith, G., Eisenstadt, N., Sammons, P., Evangelou, M., Smees, R. and Chu, K., 2013. Evaluation of Children’s Centres in England (ECCE): Strand 3: delivery of family services by Children’s Centres. Department for Education, Research Report DFE-RR297, https://assets.publishing.service.gov.uk/media/5a7cc90fe5274a2f304f00f4/DFE-RR297.pdf.
Hodge, L., Little, A. and Weldon, M., 2021. GCSE attainment and lifetime earnings. Department for Education, Research Report DFE-RR1131, https://assets.publishing.service.gov.uk/media/60c36f0cd3bf7f4bd11a2326/GCSE_Attainment_and_Lifetime_Earnings_PDF3A.pdf.
Maisey, R., Speight, S. and Haywood, S. with Hall, J., Sammons, P., Hussey, D., Goff, J., Evangelou, M. and Sylva, K., 2013. Evaluation of Children’s Centres in England (ECCE): Strand 2: baseline survey of families using Children’s Centres in the most disadvantaged areas. Department for Education, Research Report DFE-RR260, https://assets.publishing.service.gov.uk/media/5a7a3a8140f0b66a2fc00d2e/DFE-RR260.pdf.
Meadows, P. et al., 2011. National Evaluation of Sure Start Local Programmes: an economic perspective. Department for Education, Research Report DFE-RR073, http://www.ness.bbk.ac.uk/cost-effectiveness/documents/DFE-RR073_full.pdf.
Melhuish, E., Belsky, J., Leyland, A. H. and Barnes, J., 2008. Effects of fully-established Sure Start Local Programmes on 3-year-old children and their families living in England: a quasi-experimental observational study. The Lancet, 372, 1641–7.
National Audit Office, 2006. Sure Start Children’s Centres. HC 104 Session 2006–07, https://www.nao.org.uk/wp-content/uploads/2006/12/0607104.pdf.
National Audit Office, 2009. Sure Start Children’s Centres. Memorandum for the Children, Schools and Families Committee.
National Evaluation of Sure Start, 2010. The impact of Sure Start Local Programmes on five year olds and their families. Department for Education, Research Report DFE-RR067, https://assets.publishing.service.gov.uk/media/5a7ae2d8e5274a319e77b6ac/DFE-RR067.pdf
Pugh, G., 2010. The policy agenda for early childhood services. In G. Pugh and B. Duffy (eds), Contemporary Issues in the Early Years (5th edition), SAGE Publications Ltd.
Sammons, P., Hall, J., Smees, R. and Goff, J. with Sylva, K., Smith, T., Evangelou, M., Eisenstadt, N. and Smith, G., 2015. The impact of Children’s Centres: studying the effects of Children’s Centres in promoting better outcomes for young children and their families. Department for Education, Research Report DFE-RR495, https://assets.publishing.service.gov.uk/media/5a80acdb40f0b62305b8c838/DFE-RR495_Evaluation_of_children_s_centres_in_England__the_impact_of_children_s_centres.pdf.
Smith, G., Field, K., Smith, T., Noble, S., Smith, T. and Plunkett, E., 2014. Evaluation of Children’s Centres in England (ECCE): the extent to which centres ‘reach’ eligible families, their neighbourhood characteristics and levels of use. Department for Education, Research Report DFE-RR358, https://assets.publishing.service.gov.uk/media/5a7ee6a240f0b6230268c3fd/RR358_-_FINALrevisedReachReport07042014.pdf.
Smith, G., Sylva, K., Smith, T., Sammons, P. and Omonigho, A., 2018. Stop start: survival, decline or closure? Children’s centres in England, 2018. Sutton Trust, https://www.suttontrust.com/wp-content/uploads/2018/04/StopStart-FINAL.pdf.
Stewart, K., 2013. Labour’s record on the under fives: policy, spending and outcomes 1997-2010. Social Policy in a Cold Climate, Working Paper 4, https://sticerd.lse.ac.uk/dps/case/spcc/wp04.pdf.
Endnotes
Authors

Pedro Carneiro
Pedro is a Professor of Economics at University College London and an economist in the IFS' Centre for Microdata Methods and Practice (cemmap).

Sarah Cattan
Sarah is an Associate Director in the Education and Skills sector at the IFS, holding a British Academy Postdoctoral Fellowship.

Nick Ridpath
Nick joined the IFS in 2023 and works in the Education and Skills sector, focusing on the long-run impacts of education policy.
More from IFS
Understand this issue


Policy analysis


Academic research


