
Downloads
Download the report
PDF | 583.29 KB
The author gratefully acknowledges the support of the Economic and Social Research Council via the ESRC Centre for the Microeconomic Analysis of Public Policy. This report also draws heavily on analysis and knowledge gained by the author in his work as a Research Fellow at the Education Policy Institute.
Executive summary
Last December, the OECD published the latest round of PISA tests in reading, maths and science skills. These international comparisons always prompt public debate. Most countries saw declining scores, reflecting the effects of the pandemic. In Wales, the declines were particularly large, erasing all the progress seen since 2012. This report argues that low scores in Wales are a major concern and challenge for the new First Minister. Low educational outcomes are not likely to be a reflection of higher poverty in Wales, a different ethnic mix of pupils, statistical biases or differences in resources. They are more likely to reflect differences in policy and approach. We recommend that policymakers and educators in Wales pause, and in some cases rethink, past and ongoing reforms in the following areas:
- The new Curriculum for Wales should place greater emphasis on specific knowledge.
- Reforms to GCSEs should be delayed to give proper time to consider their effects on long-term outcomes, teacher workload and inequalities.
- More data on pupil skill levels and the degree of inequality in attainment are needed and should be published regularly.
- A move towards school report cards, alongside existing school inspections, could be an effective way to provide greater information for parents without a return to league tables.
Key findings
- PISA scores declined by more in Wales than in most other countries in 2022, with scores declining by about 20 points (equivalent to about 20% of a standard deviation, which is a big decline). This brought scores in Wales to their lowest ever level, significantly below the average across OECD countries and significantly below those seen across the rest of the UK. Scotland and Northern Ireland also saw declines in PISA scores in 2022, whilst scores were relatively stable in England.
- Lower scores in Wales cannot be explained by higher levels of poverty. In PISA, disadvantaged children in England score about 30 points higher, on average, than disadvantaged children in Wales. This is a large gap and equivalent to about 30% of a standard deviation. Even more remarkably, the performance of disadvantaged children in England is either above or similar to the average for all children in Wales.
- These differences extend to GCSE results. In England, the gap in GCSE results between disadvantaged and other pupils was equivalent to 18 months of educational progress, which is already substantial, in 2019 before the pandemic. In Wales, it was even larger at 22–23 months in 2019 and has hardly changed since 2009. The picture is worse at a local level. Across England and Wales, the local areas with the lowest performance for disadvantaged pupils are practically all in Wales. There are many areas of England with higher or similar levels of poverty to local areas in Wales, but which achieve significantly higher GCSE results for disadvantaged pupils, e.g. Liverpool, Gateshead and Barnsley.
- A larger share of pupils in England are from minority ethnic or immigrant backgrounds than in Wales. Such pupils tend to show higher levels of performance. However, even this cannot explain lower scores in Wales, as second-generation immigrants also tend to show lower levels of performance in Wales than in England.
- The differences in educational performance between England and Wales are unlikely to be explained by differences in resources and spending. Spending per pupil is similar in the two countries, in terms of current levels, recent cuts and recent trends over time.
- There are worse post-16 educational outcomes in Wales, with a higher share of young people not in education, employment or training than in the rest of the UK (11% compared with 5–9%), lower levels of participation in higher education (particularly amongst boys) and lower levels of employment and earnings for those from disadvantaged backgrounds.
- The explanation for lower educational performance is much more likely to reflect longstanding differences in policy and approach, such as lower levels of external accountability and less use of data.
- There are important lessons for policymakers in Wales from across the UK. The new Curriculum for Wales is partly based on the Scottish Curriculum for Excellence, with both having noble aims to broaden the curriculum, improve well-being and focus on skills. However, there is now evidence arguing that these quite general skills-based curricula might not be effective ways to develop those skills. New GCSEs are due to be taught in Wales from 2025, including greater use of assessment, a broader range of subjects and the removal of triple science as an option. These reforms run the risk of widening inequalities, increasing teacher workload and limiting future education opportunities. There is much greater use of data to understand differences in outcomes and inequalities in England. This could easily be emulated in Wales without a return to school league tables.
1. Introduction
In December 2023, the OECD published the latest round of PISA scores (OECD, 2023). These international comparisons of reading, maths and science skills always prompt significant public debate, particularly in countries seeing declining scores. The latest tests were taken in 2022. Most countries saw declining scores, reflecting the effects of school closures during the pandemic.
In Wales, scores declined significantly, with the lowest test scores across the four nations of the UK. This erased all the increases seen in Wales since 2012, when low PISA test scores last prompted soul-searching in the Welsh education system. This time, concern about low scores within Wales has been relatively brief, with the Minister emphasising ongoing reforms (Miles, 2023). This contrasts with the picture elsewhere in the UK. In Scotland, low and declining scores have prompted significant public debate and have led the Minister to promise improvements to the system (Gilruth, 2023). In England, ministers have claimed credit for relatively high scores and an improvement in relative scores compared with other countries. There were also declines in Northern Ireland, though public debate has been mostly focused on the restoration of the Northern Ireland Executive.
This short report argues that low education outcomes, high levels of inequality and their consequences for children’s life chances represent a major challenge for the new First Minister of Wales. Improving this situation should be an urgent priority for his new government.
2. Overall performance and inequalities in Wales
This section sets out the overall performance of pupils in Wales in PISA tests over time, overall levels of inequality and how this compares with the rest of the UK.
Large declines in reading, maths and science skills in Wales
Starting with the overall picture, Figure 1 shows that PISA test scores in Wales fell significantly in maths, reading and science in 2022. To some extent, this matches the decline seen across other OECD countries following the global pandemic. However, there was a steeper fall in Wales in reading and science. Scores in Wales are also now lower than in any previous PISA cycle. The declines in Wales represented about 20 PISA points, on average. This is equivalent to about 20% of a standard deviation, which is a substantial decline.
Figure 1. PISA scores across UK nations over time
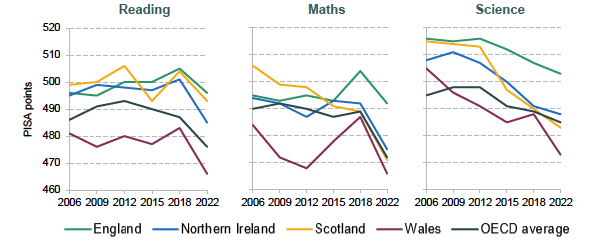
Source: Based on figures 7.13–7.15 in Sizmur et al. (2019); OECD (2023).
We also saw large falls over time in maths and science in Scotland and Northern Ireland. Across both nations, there were smaller falls in reading scores, which remain above the OECD average.
In England, we see a different picture. Reading and maths skills were increasing gradually between 2006 and 2018. There was then a relatively small decline in both reading and maths scores in 2022, taking them back to the same levels as around 2012/2015. Given the scale of disruption to education during the pandemic and the declines seen across other OECD countries, a small decline and general stable pattern over the last 10 years is likely to be a positive sign of resilience in England.
Whilst there were declines in science scores in England in 2022, Jerrim (2024) argues that this decline is seen across most OECD countries and may reflect methodological changes in the survey over time. Science scores in England also remain well above the OECD average.
Larger inequalities in Wales
Equally concerning are the level of performance of disadvantaged pupils and the state of educational inequalities in Wales, which are visible in both PISA and GCSE results. Figure 2 shows the mean PISA scores in each nation and subject for those in the most and least disadvantaged groups (bottom and top quartiles of the OECD’s index of economic, social and cultural status, ESCS), together with the mean scores for all children, in 2022.
Figure 2. Average PISA scores for most disadvantaged, least disadvantaged and all by nation and subject area in 2022
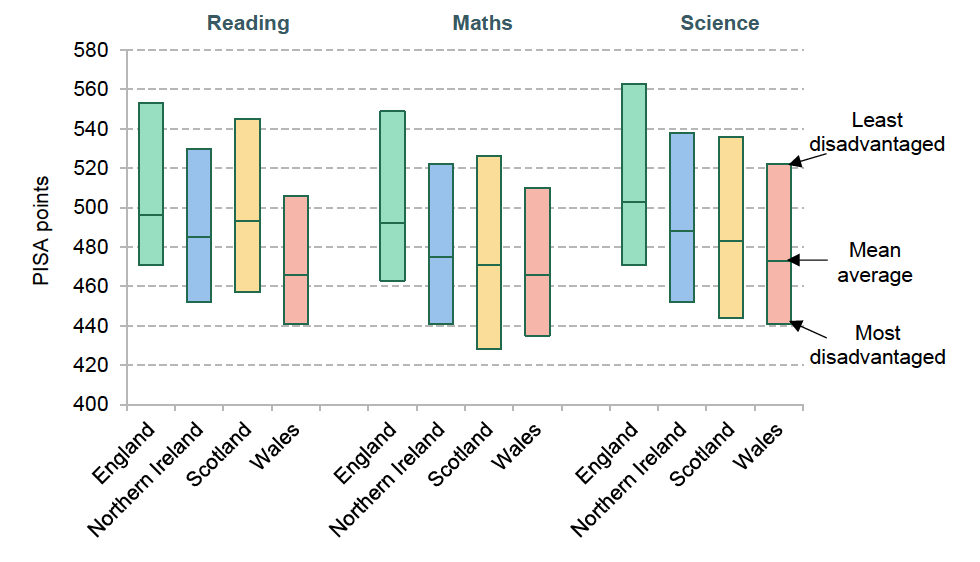
Source: Department for Education, 2023.
The gaps in performance between the most and least disadvantaged groups are broadly similar across England, Wales and Northern Ireland, and are perhaps a little larger for Scotland in reading and maths. However, the difference in levels between England and other nations of the UK by level of disadvantage is very stark. For the least disadvantaged group, we see that scores in England are about 25–30 PISA points higher than in the other nations of the UK, on average. Some of this is likely to be explained by higher incomes at the top end of the spectrum in England. However, it is notable that scores for the least disadvantaged 25% of children in Wales are only barely above the average for all children in England.
At the other end of the distribution, disadvantaged children in Wales have the lowest scores across all four nations for reading and science (and the second-lowest for maths, just above the very low maths scores for disadvantaged children in Scotland). Disadvantaged children in England score about 30 points higher, on average, than disadvantaged children in Wales. This is a large gap and equivalent to about 30% of a standard deviation. Indeed, the performance of disadvantaged children in England is either above or similar to the average for all children in Wales.
Why we should care about the reasons for low PISA scores
Before thinking about the factors driving low PISA scores in Wales and policy implications, it is important to ask whether PISA scores actually matter. There are no prizes for a high PISA ranking, except kudos, and there are no immediate consequences, except pressure on policymakers. It is also important to focus on the actual scores, rather than rankings or relative performance. Education is not a zero-sum game. If all countries saw an equally large rise in scores, we are all likely to be better off.
PISA scores matter because they are a valuable and comparable indicator of young people’s skills in reading, numeracy and science. These are fundamental skills for accessing the rest of the curriculum and for achieving education qualifications. There is an enormous body of evidence that shows how skills and educational qualifications lead to greater chances of employment, higher earnings, higher productivity, improved health outcomes, lower crime, and the list goes on as evidence improves (Hanushek et al., 2015; Psacharopoulos and Patrinos, 2018).
Furthermore, there is a great deal of evidence showing that Welsh young people experience worse educational and labour market outcomes after leaving school than young people in the rest of the UK. A recent EPI/SKOPE report shows that young people in Wales have the lowest participation in higher education across the UK, with Welsh boys seeing particularly poor trends over the last 15 years (Robson et al., 2024). We also see that the share of young people who are not in education, employment or training (NEET) is higher in Wales than in the rest of the UK. In 2022–23, 11% of 16- to 18-year-olds in Wales were NEET, as compared with 5–9% across the rest of the UK. A similar picture emerges for 19- to 24-year-olds. In the labour market, we also see that Welsh young people from working-class backgrounds have lower earnings and lower employment levels than working-class young people from other UK nations.
The inescapable truth is that disadvantaged pupils in Wales have low skill levels and low levels of educational attainment. This drives a high disadvantage gap, reduces opportunities in the labour market and perpetuates inequalities. This will act as a drag on growth and living standards.
3. Explanations for lower performance in Wales
In this section, we gradually examine the potential explanations for lower levels of educational performance in Wales, including the statistical biases and the roles of poverty, ethnic mix, resources, the curriculum, accountability and assessments.
Statistical concerns and biases
To what extent do lower PISA scores in Wales reflect statistical concerns and biases? Some caution is always needed when interpreting exact changes across countries over time, particularly as PISA scores are based on a sample of children in each nation across each cycle. There are also sources of potential bias specific to the UK and Wales, with the OECD warning that low response rates could be creating biases within the UK this year. Jerrim (2023) has written about the curious issue of the implausibly low scores of pupils taking the test in Welsh, which could be biasing Welsh scores downwards. However, such biases are likely to be modest (less than 10 points) and have been known to affect previous years (Jerrim, Lopez-Agudo and Marcenaro-Gutierrez, 2022).
In general, one should focus on the general trends and levels over time. For Wales, this is a picture of low test scores across all three subject areas, below the OECD average and lower than the rest of the UK. Furthermore, as shown below, the fact that we see higher GCSE inequalities and worse post-16 educational and labour market outcomes in Wales strongly suggests that PISA is capturing a real issue in the Welsh education system.
Higher poverty is not the explanation
There will be differences between disadvantaged children in Wales and England that explain some of these differences in skill levels. However, there is likely to be a high degree of socio-economic similarity between the disadvantaged groups across England and Wales (we look at differences by ethnic background below). These groups are mainly made up of families reliant on means-tested benefits or on minimum wage levels, which will be very similar across the two nations. As of January 2019, the share of children eligible for free school meals was about 18% in Wales, which is only slightly larger than the 15% in England. Furthermore, about 8–9% of pupils were persistently eligible for free school meals (FSM) across both nations, suggesting similar levels of persistent poverty (Cardim-Dias and Sibieta, 2022). Transitional protections under universal credit make it difficult to present more recent statistics in a comparable way.
Differences in GCSE specifications between England and Wales make it difficult to compare absolute or raw results. However, Cardim-Dias and Sibieta (2022) show that one can produce reliable comparisons of inequalities in GCSE results, and the gap in performance between disadvantaged and other pupils. This analysis presents the disadvantage gap in terms of months of educational progress, where 11 months would be the expected difference in performance between a child born in September and one born in August.
As shown in Figure 3, Cardim-Dias and Sibieta (2022) show higher inequalities in GCSE results in Wales than in England. Before the pandemic, disadvantaged pupils in Wales were the equivalent of 22–23 months of educational progress behind their peers, compared with a gap of 18 months in England.
Figure 3.Disadvantage gap in GCSE results in Wales and England over time (months of educational progress; disadvantaged defined as ever eligible for FSM in past six years)
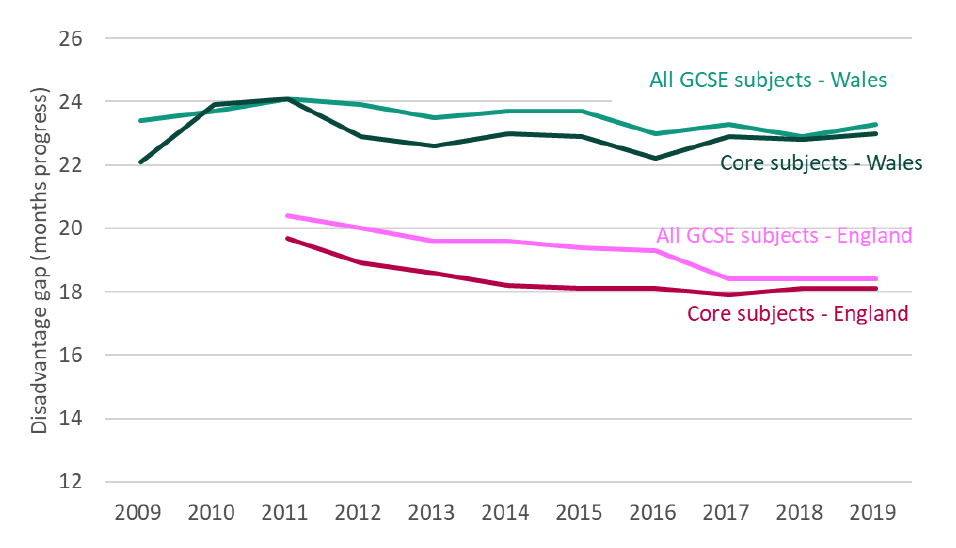
Note: Core subjects are English/Welsh, maths and science.
Source: Reproduced from Cardim-Dias and Sibieta (2022) with kind permission.
The results are even more stark at a local level, as shown in Figure 4. Across England and Wales, the local authorities with the worst performance for disadvantaged pupils are practically all in Wales. Before the pandemic, there were seven local authorities in Wales where disadvantaged pupils were at least 25 months behind their peers at the national level: Torfaen, Wrexham, Blaenau Gwent, Merthyr Tydfil, Neath Port Talbot, Rhondda Cynon Taf and Pembrokeshire. In England, this was only the case for Blackpool. Furthermore, there are many local authorities in England with similar levels of deprivation and demographics to deprived areas in Wales, but which manage to achieve a lower disadvantage gap – for example, Salford, Gateshead and Portsmouth. There are also places with much higher levels of persistent disadvantage that achieve lower disadvantage gaps, such as Liverpool and Newcastle. The low performance of disadvantaged pupils in Wales is simply not an inevitable result of high levels of deprivation.
Figure 4. Relationship between persistent disadvantage and the disadvantage gap across local authorities in Wales and England
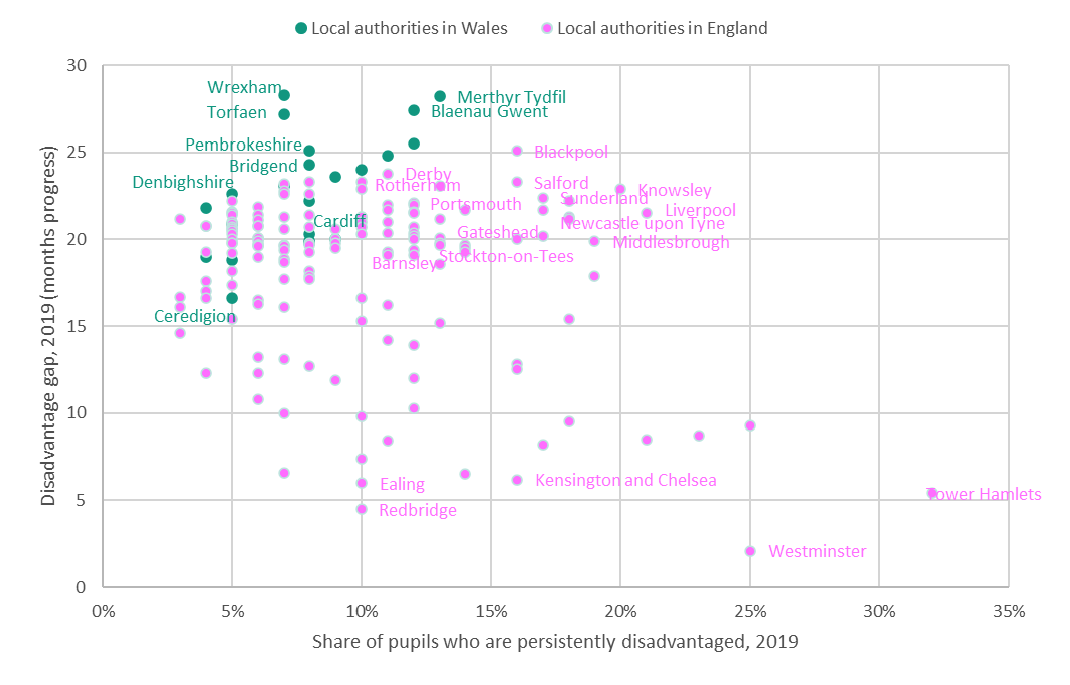
Note: Pupils are classed as persistently disadvantaged if they were eligible for free school meals for 80% of their time in school. Disadvantage gap is measured in terms of GCSE results.
Source: Reproduced from Cardim-Dias and Sibieta (2022) with kind permission.
To be clear, the overall level of the disadvantage gap and educational inequalities in England are substantial, with a national disadvantage gap of 18 months before the pandemic and much evidence to suggest that this has been getting even worse over recent years (Babbini et al., 2023). But the picture in Wales looks even worse than this. This greater disadvantage gap cannot be explained by higher levels of disadvantage in Wales. Areas of England with similar or higher levels of disadvantage manage to achieve lower levels of educational inequality. The explanation must lie elsewhere.
Role of immigrants and ethnic make-up
Perhaps the most significant difference is the ethnic make-up of each nation. Over 30% of pupils in England are from minority ethnic backgrounds, compared with about 10% in Wales. Over 20% of 15-year-olds in England were from first- or second-generation immigrant backgrounds in 2022, compared with 10% in Wales (OECD, 2023). This matters, as the evidence clearly shows that ethnic minorities and those from immigrant backgrounds generally perform very well in England (Wilson, Burgess and Briggs, 2011; OECD, 2023). These differences seem likely to be accentuated amongst the disadvantaged group, and may explain some of the lower performance in Wales. However, there are reasons to doubt that this explains a large element of lower skill levels in Wales.
According to PISA, non-immigrants in England score about 30 PISA points higher in maths than non-immigrants in Wales. We also see that immigrants score about 20 PISA points higher in England than in Wales. Immigrants and non-immigrants alike have higher levels of performance in England. Indeed, the high performance of immigrants is an under-appreciated success of the English education system. As Freedman (2024) has pointed out, England is the only European country where second-generation immigrants outperform non-immigrants in PISA. If second-generation immigrants in England were a country, they would have similar maths scores to high-performing countries such as Canada and Estonia, and be not far behind Korea and Japan.
How much do resources matter?
Resources and spending also differ across the UK (Sibieta, 2023). In Scotland, spending per pupil has long been higher and class sizes lower than in the rest of the UK (Jerrim and Sibieta, 2021). Following a further boost since 2018, spending per pupil in Scotland is at least 18% or £1,300 higher than elsewhere in the UK. Spending levels and trends are more similar in Wales, England and Northern Ireland. There were real-terms cuts to spending per pupil between 2010 and 2019, which are now being gradually reversed (Sibieta, 2023).
With England showing higher levels of skills than high-spending Scotland, one naturally asks whether school spending matters all that much. The answer is still yes. Correlations of spending across time and countries provide little information on the true effects of higher spending on educational outcomes. We have excellent evidence showing increasing levels of school spending does improve educational outcomes, and probably more so for disadvantaged students (Jackson and Mackevicius, 2024). This remains relevant and can help us interpret differences across nations.
In Scotland, we see historical levels of higher spending and recent large increases. An entirely plausible explanation is that higher levels of skills in Scotland in the past could be partly explained by greater resources. Recent declines could be explained by negative effects of reforms outweighing the effects of extra spending, and potentially by reforms reducing the bang-for-buck from extra resources.
In England, we see stable scores at a time of reduced spending per pupil and resilience in the face of a global pandemic. A very plausible explanation is that reforms to the system, such as the knowledge-rich curriculum and focus on basic literacy and numeracy, could have had positive effects, which may have been slightly diminished by reduced spending. This has the additional implication that the current English system may well be characterised by high bang-for-buck from extra spending.
This has some important lessons for policymakers in Wales considering the role of extra resources. How much you spend and how you spend it are often seen as competing factors. This is an entirely false trade-off. They both matter in complementary ways. A well-functioning and high-performing system is likely to generate large gains from extra spending. Throwing money at a poorly-performing system will likely produce disappointing results.
Curriculum changes: knowledge versus skills
One of the biggest school policy differences across the four nations of the UK has been curriculum reform. Scotland (from 2010) and Northern Ireland (from 2007) have already implemented skills-based curricula, which focus on the development of skills and competencies. The new Curriculum for Wales, implemented from 2022 onwards, takes a similar approach and is partly modelled on the Scottish Curriculum for Excellence. The National Curriculum in England is very different. The most recent version was implemented from 2014 onwards and focuses on whether pupils have specific elements of knowledge.
The Curriculum for Wales aims to develop general skills and defines four key purposes:
- ambitious, capable learners, ready to learn throughout their lives;
- enterprising, creative contributors, ready to play a full part in life and work;
- ethical, informed citizens of Wales and the world;
- healthy, confident individuals, ready to lead fulfilling lives as valued members of society.
Learning is organised into six different areas of learning (combining many traditional subject domains). A high emphasis is also placed on health and well-being. Schools then have significant autonomy to define the specific elements of their own curriculum as long as they are progressing towards the general definitions of skills. This is intended to achieve a broad and balanced curriculum.
These are of course very noble and sensible aims. The trouble is that defining the curriculum in terms of general skills might not actually be a good way to develop those skills in the first place. Whilst many of the skills seem like good long-term goals for an education system, Christodoulou (2023) argues that it is more effective to break those skills down into the teaching of specific elements of knowledge. Assessing generic skills is also incredibly difficult. As a result, skill-based curricula can lead to significant inequalities in the curriculum content that pupils are exposed to, and in the ways in which they are assessed. Indeed, based on pilots of the new curriculum, education researchers in Wales have already warned that the new curriculum risks exacerbating existing inequalities without external accountability on curriculum design and assessment, and extra investment (Power, Newton and Taylor, 2020).
Paterson (2023) also argues that the reduction in science and maths scores in Scotland and Northern Ireland, alongside stable reading scores, is the pattern one might expect following the introduction of skills-based curricula. Reading is a relatively general skill that parents can assist with. Maths and science require more specific knowledge that parents might find harder to impart. This seems like a reasonable conclusion. However, it would be near impossible to definitively conclude that it is the adoption of skills-based curricula that has led to lower scores in Scotland and Northern Ireland, and that a knowledge-based curriculum has improved scores in England. Correlation is not causation. Furthermore, the improvements in reading in England appear longstanding, dating back to 2006 at least, and might not just be about the adoption of the new National Curriculum. The improvements may reflect the widespread adoption of synthetic phonics following the Rose Report in 2006, which has been shown to have had positive effects(Machin, McNally and Viarengo, 2018).
The trouble is, as argued by Crehan (2023), declines have happened in essentially every country that has adopted such skills-based curricula – for example, France, Finland, Australia and New Zealand, with the last thinking about ways to introduce specific knowledge elements into its curriculum.
Lastly, there is also no evidence to suggest that policymakers in Wales have been successful in achieving the broader aim of maximising pupil well-being. The 2022 PISA report for Wales (Ingram et al., 2023) shows that pupils in Wales report a lower score for overall life satisfaction than the OECD average and that a lower-than-average share of pupils felt like they belonged in school. Pupils reporting higher levels of life satisfaction and belonging tended to be those achieving higher scores on PISA tests.
At the very least, all this must leave us wary about the introduction of the skills-based Curriculum for Wales. Maybe Wales will totally buck the international trend. However, there is no good evidence showing that a skills-based curriculum will be able to turn around low scores and high inequalities seen in Wales.
Accountability and assessment: not measuring up
Another key difference across the four nations has been approaches to accountability and assessment. In England, there has long been a focus on high-stakes accountability, either through league tables, school-by-school data comparisons or Ofsted inspections with single-word judgements (often with high consequences for schools and their leadership teams). This can have benefits, in terms of high levels of accountability, but can also create perverse incentives to teach to the test, and the problems associated with high-pressured school inspections are now well known.
Wales, Scotland and Northern Ireland abolished league tables long ago. Some evidence suggests this had a small negative effect in Wales (Burgess, Wilson and Worth, 2013), and a more general school categorisation system was introduced about 10 years ago. This has since been abolished and replaced by a system of self-evaluation by schools.
Since 2013, pupils aged 7–14 have sat literacy and numeracy tests of one form or another in Wales. However, the results from these have rarely been published in ways that allow us to track average skills levels or inequalities over time. For England, we have significant data on pupil skill levels from tests such as the phonics check and Key Stage 2 tests, and there are clear metrics comparing school performance with national and low benchmarks at pretty much every stage of education. Historically, such test scores have been used as part of school league tables. However, more important are the ways in which the data are used to track overall performance over time, to understand inequalities across pupils and areas, and for schools to compare their own levels with those of others. This approach to data on school comparisons was briefly part of the Welsh school system, but is not really encouraged any more. The Welsh Government has recently published data showing falling numeracy and reading levels since the pandemic, and it plans to publish more on inequalities in Spring 2024. This should ideally become a regular and systematic overview of skills levels and inequalities across time and place and enable schools to do comparisons to aid their understanding.
Accountability through school inspections occurs throughout Wales, Scotland and Northern Ireland. However, the immediate consequences from poor school inspection outcomes are less severe in Wales, except in the case of very poor inspection reports which can result in special measures. Single-word summary judgements have also been abolished, making it quite hard to discern the overall quality of schools from inspection reports. To be fair, policy and debate in England are also moving away from narrow, single-word judgements towards more holistic school report cards. It would be entirely feasible and sensible for Wales to adopt such an approach. It could include summaries from different parts of inspection reports, data on pupil attainment and inequalities, and wider aspects about the school environment and pupil well-being.
Assessments and exams have also been moving in different directions across the four nations of the UK. In Wales, the key developments have been retaining A*–G grades (instead of the numbers used in England), maintaining AS levels and creating GCSE specifications specific to Wales. This makes it harder, but not impossible, to undertake comparisons across the UK. New GCSEs in Wales will be taught from September 2025. These will be available in more vocational subjects and make more use of continuous assessments (e.g. coursework), and it will no longer be possible to study triple-science subjects of biology, chemistry and physics. These changes are being undertaken to broaden the set of available subjects and to align with the aims of the new curriculum. However, there are also clear risks with this approach. The benefits and returns to vocational GCSEs in England in the 2000s were pretty weak (see the 2011 Wolf Report), high levels of continuous assessment can increase inequalities (Kelly, 2023) and create more workload for teachers, and removing triple-science subjects risks capping the future educational opportunities of Welsh learners in science, medical and technological subjects.
4. Conclusions
The overwhelming conclusion is that the overall level of educational performance in Wales is low, and inequalities are high and persistent. Policymakers should be doing more to address the underlying reasons driving this disappointing set of results. At present, the most prominent education policies of the Welsh Government are the new Curriculum for Wales, free school meals in primary schools and a potential change in the school year. However, there is very little evidence that any of these policies will improve educational attainment or narrow inequalities.
The picture on schools in England appears rosier. However, it is important not to treat England as a perfect benchmark. There are also real problems in England. Inequalities are wide (and probably widening), there are significant problems recruiting and retaining teachers, there is huge pressure on the special educational needs system and there are also obvious concerns about a narrowing of the curriculum. This being said, there are still important lessons for policymakers in Wales.
Whilst it is important that policymakers in Wales make changes, it is also important that they do not panic. Now is the time for policymakers and educators to pause and in some cases rethink past and ongoing reforms to Welsh education in the following areas:
- The Curriculum for Wales should place greater emphasis on specific knowledge than it does now.
- The reform to GCSEs should be delayed to give proper time to consider how its aims and the evidence base fit with addressing poor performance and wide inequalities.
- More data on pupil skill levels and the degree of inequality in attainment are needed and should be published regularly.
- A move towards school report cards, alongside the existing school inspections, could be an effective way to provide greater information for parents without a return to league tables.
Conversations on changes to the curriculum should happen with policymakers, teachers and schools inside and outside Wales. Rather than repeat mistakes, it is crucial to learn lessons from the Curriculum for Excellence alongside the Scottish Government. Much can be learnt from the current rethink in New Zealand, as well as other countries that are thinking about rowing back from skills-based curricula. There is also much that can be learnt from individual teachers and schools in England who have been at the forefront of the knowledge-rich curriculum.
The planned reforms to GCSEs in Wales are significant, with the introduction of more continuous assessment and changes to subjects. Key questions to ask include whether there is strong evidence that increased use of continuous assessment for GCSEs will improve educational performance and narrow gaping inequalities. Or will it increase workloads and inequalities? Are there better ways to achieve improvements? An open and evidence-based conversation will ultimately point to the right directions.
Policymakers should also publish better and more regular data on overall skills levels across young people in Wales at different ages, and the levels of inequality across pupils from different backgrounds and areas. Schools should be able and encouraged to compare themselves with other schools, as used to be the case. If this is not possible within the existing ways that literacy and numeracy test results are collected, then this should be changed to make it possible. Given the relatively low reading scores in Wales, a phonics check for children in Year 1 or Year 2 might be a very sensible addition too.
The movement towards school report cards in England also seems like a positive step that Wales could lead on. They could be incorporated into existing school inspections to provide parents with a clear summary of the performance and well-being of their children.
Publishing more data does not have to mean a return to school league tables, which have mostly been superseded by better and more sophisticated ways of using data. It is instead a confirmation for schools, parents and taxpayers that pupils are mastering key skills that are required to access the rest of the curriculum and wider education opportunities. One objection to focusing on tests in literacy and numeracy is that it narrows the curriculum, and there has been clear criticism in England of the way the English Baccalaureate has narrowed the curriculum (see Long and Danechi (2019)). However, this is not an inevitable consequence. Done right, skill tests and comparisons can ensure that pupils acquire foundational skills that enable them to access a wider curriculum and set of qualifications. Without basic skills and knowledge, a wider curriculum is a pipe dream.
Fundamentally, if you do not like the surprises from PISA every three years, then fill the void with better annual data so that PISA just ends up confirming what you already know. Ideally, this would be a picture of improving skills, lower inequalities and pupils accessing a wider curriculum. However, without reform or good data, there could be an even nastier surprise for Welsh policymakers when the next PISA results are published three years from now.
Authors

Luke Sibieta
Luke is a Research Fellow at the IFS and his general research interests include education policy, political economy and poverty and inequality.
More from IFS
Understand this issue


Policy analysis


Academic research


