
Downloads
Download 'Public sector net worth as a fiscal target'
PDF | 664.33 KB
Key findings
1. The government has made a welcome investment in the development of a wider set of measures of the public sector balance sheet. There have been numerous calls for the UK to adapt its fiscal rules to place weight on a particular one of these balance sheet measures, public sector net worth. This is a statistical measure that aims to summarise what the government owns and what it owes: it captures both the government’s assets (financial and non-financial) and its liabilities. It attempts to provide a broader and more comprehensive picture of the public finances than commonly used measures of debt and borrowing.
2. UK public sector net worth is relatively low by international standards. This is driven by the UK having unusually low levels of public sector assets and unusually high public sector pension liabilities. We should be careful, though, not to equate public sector net worth with the country’s net worth, and should not over-read into such comparisons (which partly reflect different boundaries of the state and the precise set of assets and liabilities included). Nonetheless, the UK’s position at the back of the international pack is often pointed to by proponents of a public sector net worth target.
3. This is a debate worth having. Public sector net worth is a valuable additionto the set of information about the financial position and assets of the government, and to the set of measures estimated by the Office for National Statistics (ONS) and forecast by the Office for Budget Responsibility (OBR). Recent improvements in the quality and timeliness of public sector net worth measures have the potential to contribute to better policymaking.
4. In particular, there are reasons to suppose that a public sector net worth target might be preferable to a simple target for public sector net debt. Most obviously, by capturing a more comprehensive range of liabilities and assets, it can provide a more complete picture of the impacts of government action (or inaction). This is particularly advantageous when the government is considering asset purchases (such as nationalisations) or asset sales (such as of the student loan book), when a narrow focus on debt can be particularly misleading and/or unhelpful.
5. More generally, a public sector net worth target could helpfully strengthen the incentive for governments to focus on investing in high-quality projects where the value of assets created is expected to exceed the cost of financing, and could provide a framework for holding the government to account when it promises to ‘borrow to invest’ (often under the implicit assumption that such investments will pay for themselves). It could also encourage decision-makers to think more about how well public sector assets are managed and maintained, and to confront longer-term liabilities that might otherwise be ‘out of sight and out of mind’ (such as public sector pension liabilities, or the costs of decommissioning nuclear sites).
6. There are, however, good reasons to be cautious, and to suppose that – whatever its theoretical attractions – a public sector net worth target might work rather less well in practice.
7. One issue is that performance against a public sector net worth target will not necessarily tell us much – if anything – about the government’s ability to access capital markets or service its debt. That is particularly true if the change in net worth is driven by a change in the value of non-financial assets. These assets (such as the road network) are extremely difficult to value, both practically and conceptually. In many cases, the recorded value (the ‘replacement cost’) bears little relevance to the economic or social value of the asset, or to assessments of fiscal sustainability. Importantly, these assets cannot generally be sold to meet financing needs – or if they can, it would presumably be because the new private owners would be able to start charging for something (e.g. driving on a motorway) that was previously free to the public. Put differently, should an increase in the estimated value of an asset the government cannot sell really be taken as a signal that the government can afford to borrow more?
8. For that reason, more traditional measures of debt, debt interest and borrowing will remain important for fiscal policy, and ought to be considered alongside any target for public sector net worth when setting policy. Under current circumstances, traditional measures of debt and/or debt interest are at such high levels that it is they which are likely to be the binding constraint on fiscal policy, irrespective of any target for, or change in, public sector net worth.
9. A further issue is that choices over definitions and modelling assumptions matter enormously for estimates of net worth – more so than in the case of a debt target. Different definitions would likely send different signals to fiscal policymakers. Under one measure, rising interest rates (and falling market prices for gilts) have improved the UK’s public sector net worth by 40% of GDP over the past two years. On the face of it, and if we were to rely on such a measure alone, that might point to space for a substantial debt-fuelled fiscal expansion – even as borrowing costs surge and markets are being asked to absorb more gilt issuance than at any point in recent history. But under a different measure, net worth has remained effectively flat, suggesting no substantive change in the amount of fiscal headroom.
10. Whichever measure of public sector net worth is used, it would be complex and difficult to communicate. It also would not be truly comprehensive: public sector net worth ignores the state’s single greatest asset (its ability to tax future generations) and its greatest liabilities (the implicit promise to provide healthcare, pensions, education and security to future generations). For that reason, forecasts of future spending flows on things such as healthcare and pensions – as already produced by the OBR – are a more valuable tool for assessing the long-run sustainability of the public finances. We might also worry about the volatility of forecasts for public sector net worth, and the fact that they can be subject to large shifts in levels following changes in accounting parameters.
11. In our view, many of the potential advantages of a public sector net worth target stem from the fact that it would reduce the incentives for governments to engage in certain types of ‘bad fiscal behaviour’ (such as selling off public sector assets for less than they are worth in an effort to reduce public sector net debt). It would not, however, eliminate all incentives for Chancellors to engage in ‘short-termism’ or for them to allow accounting treatment to determine economic policy. And it would be possible to improve some incentives (e.g. for governments to invest only in high-return projects) without adopting a net worth target.
12. The fiscal fundamentals would remain unchanged, in any case. There would still be a need for a well-designed ‘escape clause’ to allow for countercyclical fiscal policy in a crisis; the UK would still face daunting public finance pressures; and there would still be a need for fiscal policy to be tighter in the ‘good’ times to build up fiscal buffers and provide the space to respond to adverse shocks when they arrive.
13. All things considered, our view is that the benefits of moving to balance sheet targeting might be insufficient to justify the potential costs involved. In other words, wholesale adoption of a public sector net worth target could prove to be a long walk for a small sandwich: there might be simpler and less complicated ways of achieving some of the policy objectives espoused by its proponents, and it would likely create as many problems as it solved. There is, nonetheless, a strong case for considering public sector net worth as part of a broader suite of fiscal metrics – particularly when assessing asset sales and purchases, and other balance sheet policies. The government’s Charter for Budget Responsibility already includes a commitment to do this. Labour’s proposal to ‘take greater account’ of public sector net worth appears sensible. But public sector net worth ought not, in our judgement, to be at the centre of the UK fiscal framework.
6.1 Introduction
There have been numerous calls for the UK to alter its fiscal framework to place greater weight on improving the net worthof the public sector, rather than overly focusing on the level of public sector debt. Supporters of such a shift include the current Chair of the Office for Budget Responsibility (OBR) and a former Chief Economist at the Bank of England (e.g. Hughes, 2019; Hughes et al., 2019; Haldane, 2023; Wren-Lewis, 2023; Odamtten and Smith, 2023). At the 2019 general election, the Labour party pledged to ‘improve public sector net worth over the course of the Parliament’ (McDonnell, 2019), and it has more recently made a softer pledge to ‘take greater account of public sector assets as well as debt in fiscal policy’ (Labour Party, 2022). This comes on the back of more than a decade of work within government to develop better and more timely measures of both sides of the public sector balance sheet.
This debate, and the investment in and development of a broader suite of public sector balance sheet measures, is welcome. Public sector net worth is a valuable addition to the set of fiscal aggregates estimated by the Office for National Statistics (ONS) and forecast by the OBR, and has the potential to contribute to better fiscal policymaking.
There are also several theoretical reasons to suppose that targeting public sector net worth might represent an improvement over a simple target for public sector net debt. Most obviously, by capturing a more comprehensive range of liabilitiesandassets, it can provide a more complete picture of the impacts of government action (or inaction), and reduce the incentive for Chancellors to pursue certain types of short-term policymaking. It would also provide a better framework for holding governments to account when they promise to ‘borrow to invest’, often under the implicit assumption that such investments will more than pay for themselves, and could strengthen the incentive for public sector assets to be well managed in the interests of future generations.
Theoretical attractions are one thing, but there are reasons to suppose that a public sector net worth target might work less well in practice. The key difference between a net debt measure and a net worth measure is that the latter incorporates the value of non-financial assets (such as physical infrastructure like roads and buildings).1 Estimating the value of these assets is fraught with difficulty – how much is a road worth? – and such estimates can be extremely sensitive to changes in accounting parameters, and not especially informative about fiscal sustainability. Choices over definitions and modelling assumptions can be hugely consequential: under one measure, rising interest rates (and falling market prices for gilts) have improved the UK’s public sector net worth by 40% of GDP over the past two years. On the face of it, that might point to space for a substantial debt-fuelled fiscal expansion – even as borrowing costs surge and markets are being asked to absorb more gilt issuance than at any point in recent history. Under a different measure, though, net worth has remained effectively flat, suggesting no change in fiscal headroom.
This relates to two broader problems with a net worth target. First, the choice of definition matters hugely – more so than in the case of a debt target. Even the more comprehensive measures, which include unfunded public sector pension liabilities, are not truly comprehensive: a government’s greatest asset is its ability to levy future taxes, and its greatest liability is its implicit promise to provide healthcare, education, pensions and security to future generations. These are not captured in public sector net worth. Whatever measure is chosen, it will be complex and difficult to communicate.
Second, changes in a country’s public sector net worth will not necessarily tell us much – if anything – about the government’s ability to access capital markets or service its debt. That is particularly true if the change in net worth is driven by a change in the value of assets that cannot be sold to meet financing needs. Put differently, should an increase in the estimated value of an asset the government is unlikely to – or simply cannot – sell really be taken as a signal that the government can afford to borrow more? Furthermore, it is not difficult to imagine a world where a deterioration in public sector net worth is disregarded as being caused by a ‘technical measurement issue’, but where tax cuts and/or spending increases are announced when the reverse happens. That would exacerbate the asymmetric behaviour described in Chapter 5 of this Green Budget.
Together, this ought to give us pause. The UK government’s current debt target is poorly designed and should be reconsidered. But rather than disregard debt entirely, a better outcome might be to retain some sort of debt or debt interest target alongsidea greater focus on public sector net worth – particularly when the government is considering nationalisations or asset sales, at which point a narrow focus on debt can be especially unhelpful. Even if public sector net worth were to be given greater prominence, there would still need to be an ‘escape clause’ of some kind in the face of major shocks: strict adherence to a public sector net worth target would almost certainly have (inappropriately) precluded borrowing for the COVID-19 furlough scheme, for instance. Labour’s proposal to ‘take greater account’ of public sector net worth therefore appears sensible, but we would urge caution about going much further than that.
More generally, it is worth considering whether there are alternative solutions to the problems a public sector net worth target is intended to address. A wholesale shift to targeting public sector net worth could prove to be a long walk for a small sandwich. It is true that the UK has relatively low public sector net worth by international standards.2 But we note that governments in other comparator countries have managed to achieve higher public sector net worth without a public sector net worth target. Similarly, other governments have managed to spend more than the UK on public investment over past decades without such a target. And though the UK has unusually large unfunded public sector pension liabilities (by international standards), this is not because it was the only country without a public sector net worth target.3 Something else has clearly driven those policy decisions.
We might also worry that moving to a net worth target would simply shift the ‘fiddling’ and creative accounting from one boundary (what is included/excluded from public sector net debt?) to another (what is included/excluded from public sector net worth?). If the ultimate concern is that Chancellors are prone to short-termism and inappropriately letting accounting treatment guide economic policymaking, then perhaps the answer is for independent watchdogs to call this out (even) more forcefully – or for parliament and ultimately voters to demand better behaviour from them.
The aim of this chapter is not to provide firm recommendations about what the ideal set of fiscal rules would look like, but to assess the relative merits of public sector net worth as a fiscal target. We proceed as follows. Section 6.2 provides definitions and both historical and international context for the strength of the UK public sector balance sheet. Section 6.3 outlines the case for targeting public sector net worth rather than public sector net debt. Section 6.4 considers some of the concerns we might harbour about such an approach. Section 6.5 concludes.
6.2 Definitions and context
What is public sector net worth?
Public sector net worth (PSNW) is an accounting measure that attempts to summarise the total value of public sector assets and public sector liabilities. In simple terms, it attempts to capture the total value of what the government owns (including both financial and non-financial assets), minus the total value of everything it owes. It is therefore a snapshot measure of the government’s balance sheet.
PSNW is not the only measure of the public sector balance sheet but it is, in the words of the OBR, ‘the broadest balance sheet aggregate that can be produced under existing statistical accounting frameworks’ (Ebdon and Khatun, 2021).
The most commonly used balance sheet measure is much narrower: public sector net debt (PSND), which nets off the value of liquid financial assets (such as foreign exchange reserves) from the value of the national debt (defined as the public sector’s loan liabilities, debt securities, currency and deposit holdings). Public sector net financial liabilities (PSNFL) provides a slightly broader picture, by also including illiquid financial assets (such as the student loan book) and a broader range of financial liabilities (such as the liabilities associated with funded pension schemes). PSNW provides a broader picture still, by also including the estimated value of non-financial assets (such as buildings and transport infrastructure). The differences between these measures are summarised in Figure 6.1, and the interested reader seeking more detail is encouraged to read ONS’s excellent summary (Office for National Statistics, 2021).
Figure 6.1. Assets and liabilities included in different public sector balance sheet measures
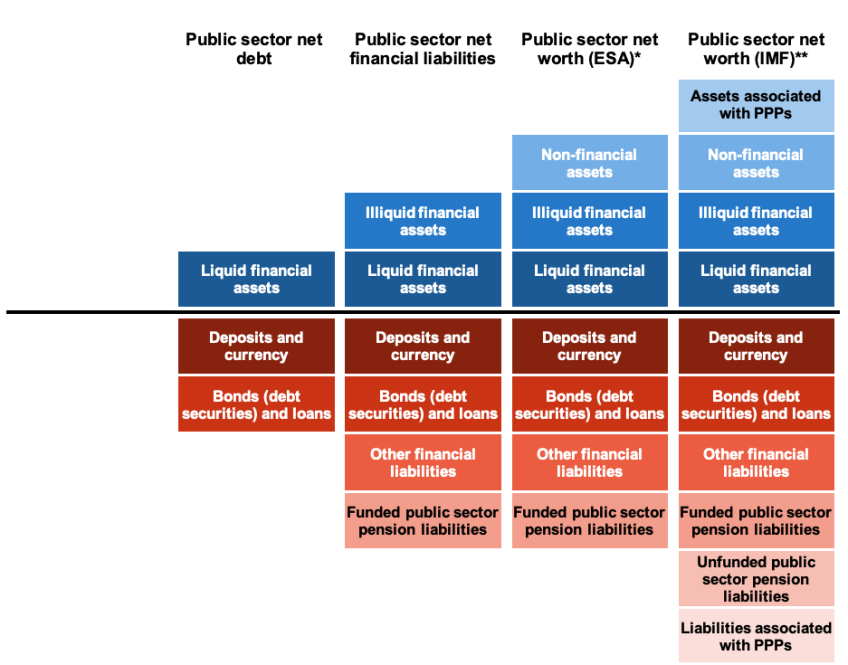
* Produced in accordance with the European System of Accounts 2010 (ESA 2010).
** Produced in accordance with the International Monetary Fund’s Government Finance Statistics Manual 2014 (IMF-GFSM 2014).
Note: ‘PPPs’ denotes public–private partnerships, which include Private Finance Initiative (PFI) deals; these are considered ‘off balance sheet’ under the ESA 2010 framework. The ESA 2010 and GFSM 2014 measures also differ in how they value debt securities (the former valuing securities at face value and the latter at market value).
Source: Adapted from Office for National Statistics (2021).
In sum, because it brings together both sides of the balance sheet, and because it attempts to capture both financial and non-financial assets, PSNW provides a broader and more comprehensive picture of a government’s fiscal position than commonly used ‘flow measures’ (of, for example, government borrowing) and other measures of the balance sheet. There are two further things worth emphasising at this point.
The first is that there is more than one way to calculate PSNW, under different statistical frameworks. The ONS currently publishes two different measures: a measure consistent with the European System of Accounts 2010 (ESA 2010) and a measure consistent with the International Monetary Fund’s Government Finance Statistics Manual 2014 (IMF-GFSM 2014).5 The latter is a broader measure (as summarised in Figure 6.1), because it also includes unfunded public sector pension liabilities, and assets and liabilities associated with public–private partnerships. And, among other differences, the two measures take alternative approaches in how they value debt securities (an issue to which we return below).
The second is that even PSNW – the broadest and most comprehensive measure available – does not and cannot comprehensively capture the assets and liabilities of a government. The government’s greatest asset is its ability to levy future taxes. Its greatest liability is its (implicit) promise to protect the country from attack and to provide public services and social security to future generations. PSNW captures neither of these. An even more ambitiously comprehensive (and complex) measure would be the ‘intertemporal public sector balance sheet’, which adds the net present value of all future revenue and spending flows to the static, ‘snapshot’ measure of PSNW (International Monetary Fund, 2018). Estimating this is a useful exercise, and it rightly features in the OBR’s long-term fiscal sustainability analysis (e.g. Office for Budget Responsibility, 2023). Assessments of the long-term health of the public finances should absolutely enter tax and spending decisions. But, whatever the merits of such a measure, it is unrealistic to expect it to be re-estimated on a sufficiently frequent basis for it to be of much practical use in real-time fiscal monitoring or decision-making.
Estimates of PSNW, on the other hand, are now published on a monthly basis by the ONS (without long lags), and forecasts are produced by the OBR at fiscal events. This represents a significant advance. A ‘quiet revolution in government financial reporting’ (Hughes, 2019) has improved the timeliness, comprehensiveness and reliability of government balance sheet data. This has led some to argue that ‘balance sheet targeting in fiscal policy is a practical proposition for the first time in our history’ (Hughes et al., 2019). This may be so, but it would not be the first attempt to place greater weight and focus on the measurement of public sector assets. William the Conqueror was something of a fiscal trailblazer, having commissioned the Domesday Book in 1086. A further advance came along some time later, in November 1997, when the newly elected Labour government published a National Asset Register to document the fixed assets held by government departments. This was driven by a concern that, as Ed Balls and Gus O’Donnell later recalled:
‘In 1997 the Government was faced with a large structural deficit, low net investment, rising public debt and falling public sector net worth’ [emphasis added]
Balls and O’Donnell (2002, 134–5)
The next subsection explores how public sector net worth is estimated to have evolved since then.
How has UK public sector net worth evolved over time?
Headline figures for public sector net worth
ONS estimates for PSNW (under both the ESA 2010 and IMF GSM 2014 measures) begin in 1998–99.6 These are presented in Figure 6.2. Both suggest that the net worth position is currently negative – i.e. the estimated value of (included) public sector liabilities exceeds the estimated value of (included) public sector assets. There are three key takeaways.
Figure 6.2. UK public sector net worth and public sector net debt
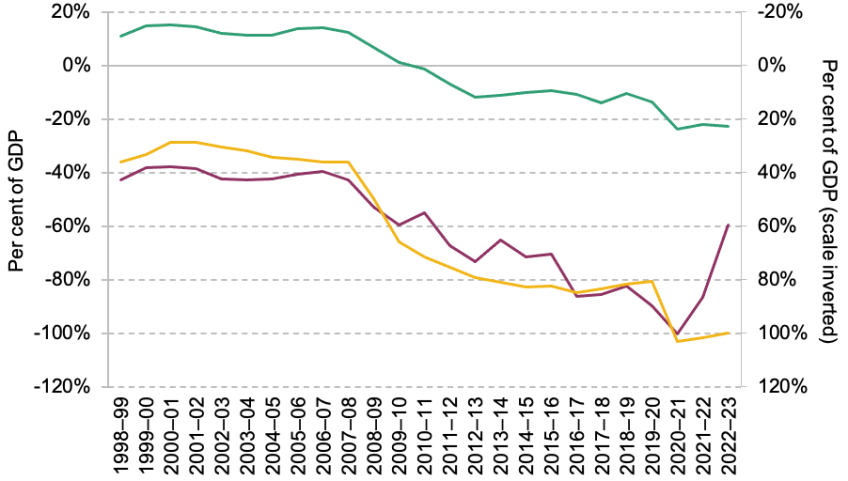
Note: See Figure 6.1 for further details on the difference between the two measures of PSNW.
Source: Author’s calculations using Office for Budget Responsibility, ‘Public finances databank’, and Office for National Statistics, ‘Public sector net worth: Appendix O’, both accessed August 2023.
First, PSNW is considerably higher when measured under the ESA 2010 definition. That is primarily (but not only) because the ESA-consistent measure of PSNW excludes unfunded public sector pension liabilities, whereas these are included in the IMF-consistent measure (see Figure 6.1). The ONS estimates that in 2022–23, PSNW stood at minus 23% of GDP (minus £577 billion) under the ESA measure and at minus 60% of GDP (minus £1,513 billion) under the IMF measure.
Second, while the two measures differ in levels, they have (until recent years) followed similar trends. Net worth was more or less flat between 1998–99 and 2007–08, before starting to steadily deteriorate over the late 2000s and 2010s. By 2020–21, PSNW was 36% (57%) of GDP lower than in 2007–08 under the ESA (IMF) measure.
Third, there is a striking divergence between the two measures in what has happened over the past couple of years. Whereas PSNW has remained essentially flat as a percentage of GDP under the ESA definition, it has improved by a remarkable 41% of GDP under the IMF definition.
Looking under the hood
To better understand these trends in PSNW, and the divergence in recent trends, Figure 6.3 decomposes PSNW into different types of assets and liabilities, under the ESA (Panel A) and IMF (Panel B) measures. The broad picture in both cases is that though both assets and liabilities have grown as a percentage of GDP since the Great Financial Crisis, liabilities have grown more quickly, leading to an overall deterioration in public sector net worth. This increase in liabilities has been driven by an increase in the level of government debt (the two red-shaded bars).7
Figure 6.3. Decomposition of public sector net worth as a percentage of GDP, by types of asset and liability
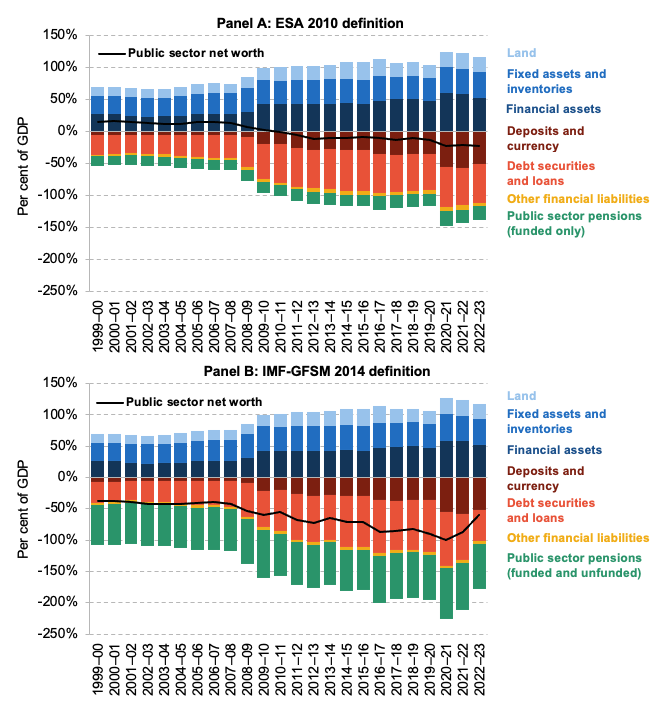
Note: ‘Other financial liabilities’ includes special drawing rights, equity and investment fund shares, financial derivatives and employee stock options, and other accounts payable. ‘Public sector pensions’ is used here as shorthand for insurance, pensions and standardised guarantee schemes. Unfunded public sector pension schemes are excluded from the ESA definition and included in the IMF definition. Under the ESA framework, debt securities are valued at their face value. Under the IMF-GFSM framework, debt securities are valued at their market value.
Source: Author’s calculations using Office for Budget Responsibility, ‘Public finances databank’, and Office for National Statistics, ‘Public sector net worth: Appendix O’ and ‘International Monetary Fund’s Government Finance Statistics framework in the public sector finances: Appendix E’, all accessed August 2023.
Comparing the two panels, we can also see that the differential post-2020 trends between the ESA and IMF measures have been primarily driven by reductions in the value of debt securities and public sector pension liabilities under the IMF (but not the ESA) measure. Under the ESA-consistent measure, the liabilities associated with debt securities and loans fell by 2.1% of GDP between 2020–21 and 2022–23; under the IMF-consistent measure, they fell by 34.2% of GDP. Similarly, the value of (funded) pension liabilities under the ESA measure fell by 3.0% of GDP over that two-year period; the value of (funded and unfunded) pension liabilities under the IMF measure fell by 11.1% of GDP.
This remarkable divergence is the consequence of the rapid increase in interest rates over the past two years, through two main channels. One, higher interest rates mean a higher discount rate used for the valuation of unfunded pension liabilities (the higher the discount rate, the lower the net present value of those future payments – see O’Brien and Zaranko (2023) for a discussion). Two, higher interest rates reduce the market value of government debt (used in the IMF framework), but not the face value (used in the ESA framework) – see Box 6.1.
-----------------------------------------------------
Box 6.1. Valuing debt securities
Debt securities represent a sizeable chunk of the UK government’s overall liabilities. These are bonds issued by the government, often referred to simply as ‘gilts’ (short for ‘gilt-edged securities’), upon which regular payments (known as ‘coupons’) are paid until the bond’s maturity (or redemption) date. At that point, the government repays the principal to the holder of the bond. They can be valued in different ways for the purposes of calculating public sector net worth:
- Face value:the amount paid to the bond holder at redemption (i.e. the amount the bond will be worth at maturity).
- Market value:the prevailing price of that bond in the market at that particular moment in time (which will depend, among other things, on market interest rates and the time to maturity).
- Nominal value: the market price at the point when the bond was issued.
At maturity, the value under all three methodologies is identical. Before that point, the three can and do differ. In the core ONS public sector finance statistics, and under the ESA-2010-consistent PSNW statistics, debt securities are recorded at face value. Under the IMF-GFSM-consistent methodology, debt securities are recorded at market value.
An appraisal of the relative merits of these methodologies is beyond the scope of this chapter (see box 2.1 of Ebdon and Khatun (2021) for a discussion). Here, it is sufficient to note that when market interest rates increase (as they have in the recent past), the market value of the government’s gilt liabilities will fall, but the face and nominal value will not. According to the supplementary statistics published by the ONS, between 2020–21 and 2022–23, as government borrowing rose sharply during the pandemic, the nominal value of gross public sector debt increased by £457 billion; the face value increased by £473 billion; while increases in interest rates were sufficient to push the market value down by £239 billion.(a) This explains a large proportion of the divergence in PSNW under the ESA and IMF measures shown in Figures 6.2 and 6.3.
a Office for National Statistics, ‘International Monetary Fund’s Government Finance Statistics framework in the public sector finances: Appendix E’.
-----------------------------------------------------
The big picture, then, is that the global shift towards higher interest rates has dramatically improved the UK’s measured public sector net worth under one statistical definition, but not under another. This illustrates the importance of the choice of definition for the message sent by a PSNW measure. It is difficult to look at the current economic and fiscal environment and conclude that conditions are ripe for a large debt-fuelled fiscal expansion: inflation is high, unemployment is low, borrowing costs are high, and – with the Bank of England now selling rather than buying government bonds – the market is already being asked to absorb historically high levels of gilt issuance.8 Yet that is what a naïve reading of the data might suggest. We return to this issue in Section 9.4.
How does the UK compare internationally?
Figure 6.4 places the UK’s PSNW (under the IMF-GFSM definition) in international context. By international standards, the UK’s PSNW is low. This is driven both by the UK public sector having relatively low assets (the second-lowest among the countries examined) and by it having relatively high liabilities (the fifth-highest). The precise ordering moves around somewhat depending on which year is chosen for the analysis, but the overall conclusion is robust – for example, Odamtten and Smith (2023) show something similar using 2018 data and a slightly broader set of countries.
Figure 6.4. UK public sector net worth in an international context (selected countries, 2020)
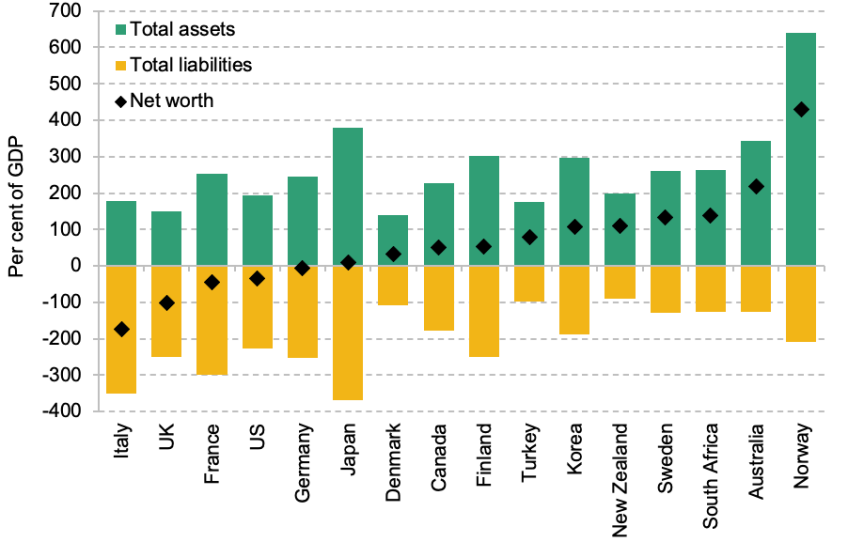
Note: Data for 2020 used for consistency, as 2021 data are available only for a subset of countries.
Source: IMF Public Sector Balance Sheet Database, accessed August 2023.
What explains the UK’s comparatively poor net worth position? To examine this, Figure 6.5 shows how the levels of different types of public sector assets and liabilities compare across G7 countries. The UK is an outlier in two respects. First, it has unusually low levels of both financial and non-financial assets. Second, the UK has unusually high public sector pension liabilities. It is these two factors – and not an unusually high level of government debt – which account for the UK having a lower PSNW than its international peers.
Figure 6.5. Public sector assets and liabilities in G7 countries (2020)
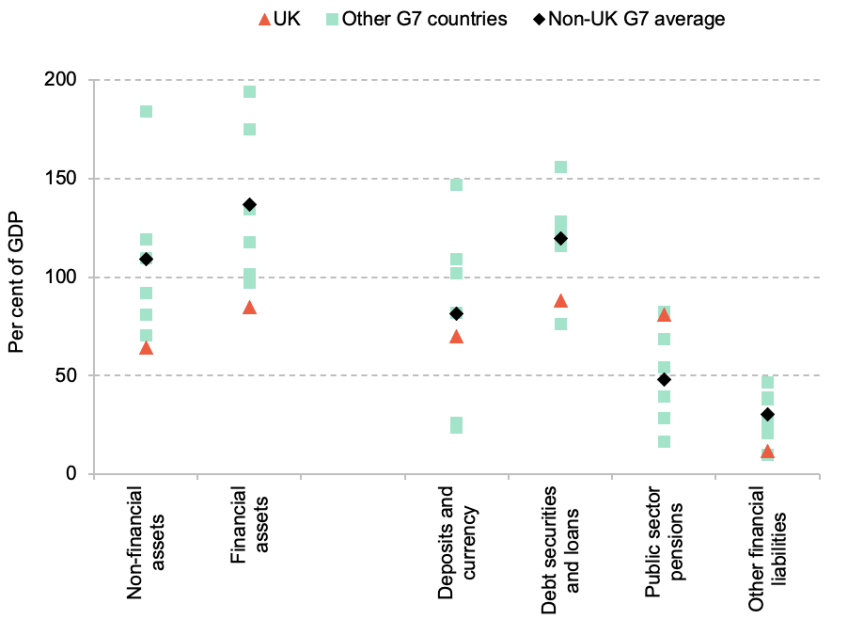
Note: G7 countries are Canada, France, Germany, Italy, Japan, the UK and the US. The non-UK G7 average is the unweighted mean of the six countries other than the UK. Values shown are for 2020, because 2021 data were unavailable for France and Japan at the time of writing.
Source: Author’s calculations using IMF Public Sector Balance Sheet Database, accessed August 2023.
These international comparisons are helpful and informative, but we should be careful not to over-read into the UK’s position at the back of the pack, and should not equate public sector net worth with the net worth of the country as a whole. Differences in the level of public sector assets are likely, in part, to reflect different boundaries of the state: the UK is relatively unusual, for instance, in having a privately owned water industry (in England and Wales) – at least compared with Western Europe (EurEau, 2020). The assets of this (infrastructure-heavy) industry will largely sit outside of the public sector in the UK, whereas they would appear as additional non-financial public sector assets in many EU countries. (The substantial liabilities of the private water industry will not appear on the public sector balance sheet either.) The decision to privatise the water industry may or may not have been a wise policy choice. But the decision of whether or not to have a publicly owned water industry should not be made on the basis of whether it would improve the UK’s position in the international PSNW rankings.9
Furthermore, the precise set of assets and liabilities that are included (or not) could skew the comparisons. The UK is more reliant on occupational and personal pensions for pensioner income than many other advanced economies (Cribb et al., 2023); this is reflected in its large unfunded public sector pension liabilities (the liabilities associated with the occupational pensions of government employees, past and present). The UK also (and relatedly) devotes a smaller percentage of its GDP to state pensions than most other advanced economies (Harker, 2022; Cribb et al., 2023). But the fact that the UK has, in effect, smaller state pension liabilities than many other countries is not reflected in PSNW. A simple comparison between the UK and, for example, France would not therefore provide a complete picture of each state’s ‘true’ fiscal position. We ought not, therefore, to view the UK’s low PSNW relative to other countries as necessarily casting past policy choices in a negative light.
6.3. Advantages of a public sector net worth target
We now consider some of the arguments for why a PSNW target might be a desirable feature of UK fiscal policy. Perhaps the most convincing case for targeting PSNW was made by a team at the Resolution Foundation, including Richard Hughes, prior to his appointment as Chair of the OBR (Hughes et al., 2019). This built upon some of the arguments made in the October 2018 IMF Fiscal Monitor (International Monetary Fund, 2018). Here, we provide a less comprehensive summary of the key points.
Advantages over a debt target
All else being equal, we might think that aiming for higher PSNW is a ‘good thing’. For example, there is some evidence that countries with stronger public sector balance sheets face lower borrowing costs and experience shorter and shallower recessions (Yousefi, 2019). It is certainly difficult to think of a good reason why we would wish to deliberately aim to reduce net worth over an extended period.
But beyond that, many of the ‘pro-PSNW’ arguments could instead be cast as ‘anti-PSND’ arguments. In particular, there are four key reasons to suppose that a net worth target might be more desirable than a debt target.This subsection draws heavily on the arguments made by Hughes (2019) and Hughes et al. (2019).10
It is more comprehensive
As outlined in Section 9.2, PSNW provides a more comprehensive picture of the government’s fiscal position than PSND. It additionally captures financial assets (such as student loans), non-financial assets (such as the road network) and a broader set of (non-debt) liabilities (such as unfunded public sector pension liabilities, under some definitions of PSNW). PSND captures none of these (see Figure 6.1).
For proponents, this is one of the key attractions of a PSNW target. In 2019, the then Shadow Chancellor John McDonnell adopted a PSNW target ‘so that when we [borrow to] invest in the infrastructure our country desperately needs it’s recognised both as a cost and as a benefit … adding to the government’s debt, but also adding to the government’s assets’ (McDonnell, 2019). On the opposite end of the political spectrum, Julian Jessop notes that ‘fiscal conservatives are attracted [to PSNW] by the hope that it would encourage governments to face up to longer-term liabilities that might otherwise be hidden “off-balance sheet”, such as the future cost of some public sector pensions’ (Jessop, 2023). The hope is that expanding the fiscal information available to decision-makers will result in better policy.
It better captures the fiscal implications of financial transactions
When the government sells or purchases an asset, this has an impact on PSND. Governments might be tempted to sell assets to improve their measured debt position, and be discouraged from purchasing assets that would mean adding to debt (see the next subsection for examples). By capturing both sides of the balance sheet, PSNW allows such transactions to be considered under more appropriate tests, and eliminates certain ‘fiscal illusions’. It also better captures policies such as loans and loan guarantees, which have become increasingly common in recent years (e.g. the Mortgage Guarantee Scheme aimed at promoting homeownership) and are excluded from PSND but (largely) included in PSNW.
It provides a framework for assessing the quality of government investment
Fiscal targets often treat investment spending differently from day-to-day spending. Gordon Brown’s ‘Golden Rule’, for instance, stipulated that the government would only borrow to invest over the economic cycle. Governments have at various times targeted a current budget surplus, whereby all day-to-day spending would be funded out of revenues but borrowing would be permitted for investment. This is also current Labour party policy.
The implicit – and sometimes explicit – assumption underpinning promises to ‘borrow to invest’ is that these investments will bring future benefits. Indeed, the assumption is often that these investments will be done so well that they will more than pay for themselves – particularly when borrowing costs are low. In theory, by showing both sides of the balance sheet, PSNW would show how the value of the assets acquired through public investment compare with the value of the debt liabilities used to finance said investment.11 In other words, PSNW targeting would provide a framework for holding such promises to account (on the assumption that these assets are accurately valued in PSNW). This might be more desirable than excluding investment spending from the fiscal rules and then simply hoping for the best.
It can provide better incentives
Relatedly, because the value of assets created through government investment shows up in PSNW, it creates a greater incentive for governments to pursue only high-quality (net-worth-enhancing) investment, or to invest where the returns are greatest. Richard Hughes suggested that, to promote such incentives, the government could publish the cost–benefit analyses for all projects, mandate a National Infrastructure Commission assessment of the value-for-money case for all large projects, and require a minimum benefit–cost ratio for all major investment projects (Hughes, 2019). That might help provide the information necessary for the government to invest only where there is a compelling economic case that the value of assets created would exceed the cost of financing.12
In addition, a PSNW target could increase the incentive to manage and maintain public sector assets (to the extent that the measurement of individual asset values actually reflects how well they are being managed – for instance, the extent to which a deterioration in the condition of the further education estate is felt in declining PSNW). If the government opted for a more comprehensive measure of PSNW, it would also create a greater incentive for policymakers to reckon with growing non-debt liabilities, such as unfunded public sector pensions and clinical negligence claims against the NHS.13
Some concrete examples of when a net worth target would be preferable to a narrow focus on debt
We now consider some specific examples of where a narrow focus on public sector net debt might be especially unhelpful, and where a greater focus on public sector net worth might encourage better policymaking (or discourage bad policymaking).
Nationalisations
At the 2017 and 2019 general elections, the Labour party proposed a large programme of nationalisations. The 2019 manifesto, for example, pledged to ‘bring rail, mail, water and energy into public ownership’, alongside ‘the broadband-relevant parts of BT’.14 Analysis at IFS at the time suggested that this would have added at least £150 billion of debt to the public sector balance sheet (Crossman, Emmerson and Kraftman, 2019).
The impact on public sector net debt is not a helpful guide to assessing the merits of such a policy programme. If the government were to acquire (for instance) an energy company for what it is worth, then the addition to debt would be offset by an increase in public sector assets, leaving PSNW unchanged. The company could always be re-privatised in future, which would reduce public sector assets and liabilities. And if one believes that the asset would be better managed in the public sector, the value of the asset might even increase post-nationalisation, leading to an improvement in PSNW (the converse is true if one thinks that the public sector would do a worse job than the private sector of running the company).
The key question, in short, is whether the asset would be better managed in the public or private sector. A PSNW target cannot tell us the answer to that, but it at least accounts for the acquisition of the assets of the company as well as the debt, and provides a framework for assessing whether those assets were being well managed over time. In that sense, it is a more useful tool than a simple debt target for determining whether nationalisations are a ‘good idea’.
Selling off the student loan book
During the 2010s, the government sold £3.6 billion of student loans as part of a dedicated student loan sale programme. This policy was explicitly motivated by a desire to ‘reduce public sector net debt, while not having a significant impact on public sector net borrowing’ (HM Treasury, 2020a). In other words, the government deliberately decided to sell off a financial asset (the right to an uncertain flow of future revenue, as students repay their loans) in return for an up-front sum which would reduce public sector net debt. This was couched in terms of restoring the public finances to health. Yet, as the OBR noted in 2018, ‘[selling student loans] does not strengthen the public finances in any meaningful sense – it is simply an alternative way to finance the budget deficit, and a relatively expensive one at that given current borrowing costs’ (Office for Budget Responsibility, 2018). The government was instead guided by its desire to reduce the headline measure of public sector net debt.
Had the government of the day instead focused on the impact on PSNW, it would have faced different incentives: a reduction in debt would have been offset by a corresponding reduction in financial assets. If the asset was intrinsically worth more in the hands of the private sector, and the sale price reflected that, the sale could still have improved the net worth of the public sector. But in this case, the ownership would not be expected to affect the economic value of the asset – the future loan repayments of former university students will not depend on who ultimately owns the loan book. If anything, because the government (as a highly creditworthy and immortal entity) has a lower discount rate and lower borrowing costs than private sector institutions, the value of the student loan book could in fact be greater in the hands of the public sector. It was also subsequently alleged (e.g. Public Accounts Committee, 2018) that the government received too little in its student loan sales: another reason to think that the policy might even have decreased PSNW.
A subsequent HM Treasury Balance Sheet Review rightly recommended that the government ought also to consider how selling student loans (and other assets) would affect the broader balance sheet (HM Treasury, 2020b). Policy might have evolved differently and more sensibly if the government had done so sooner.
Public sector pension reform
Public sector pensions are considerably more generous than what is available in virtually all of the private sector, and a far greater share of overall public sector remuneration is deferred compared with the private sector. In the face of recruitment and retention challenges in many public services, last year’s IFS Green Budget concluded that there is a strong case for rebalancing public sector remuneration away from pensions and towards pay (Boileau, O’Brien and Zaranko, 2022). This could be done in an actuarially fair way, such that the overall generosity of the package is unchanged, but is composed of higher up-front pay and lower pension payments in retirement.
Aside from the challenge of agreeing such a change with public sector employees and their unions, one reason HM Treasury might resist such a change is that the increase in pay would show up immediately in the pay bill (and in departmental budgets), but the savings from reduced payments would not materialise for many years. Although fiscally neutral in the long term, the short-term effect would be higher spending and (unless offset by higher taxes) higher borrowing and debt. A reduction in the generosity of public sector pensions would, however, show up as lower (unfunded) public sector pension liabilities, which are captured in some measures of PSNW. A government focused on its net worth might therefore be more likely to pursue such a policy – one that would leave the government’s long-run fiscal position broadly unchanged, but could help address recruitment issues in the short term.
Summary
There are compelling theoretical reasons to suppose that targeting PSNW might improve (at least some aspects of) UK fiscal policymaking, relative to a target for PSND. These would, in large part, come from discouraging certain kinds of what we might call ‘bad fiscal behaviour’ – such as selling off public sector assets for less than they are worth, due to a motivation to reduce debt. Because it captures assets as well as liabilities, it is easy to see the appeal of a PSNW target to a government wishing to embark on a nationalisation programme, or a large programme of debt-financed investment. PSNW and other balance sheet metrics could provide a framework for assessing the case for those programmes, and for holding politicians and policymakers to account over the quality of their investment decisions and their management of public assets.
6.4. Reasons to be cautious
We now consider a range of (related) arguments for why we might wish to be cautious about the adoption of a PSNW target.
It is not necessarily informative about the government’s ability to access capital markets or service its debt
Fiscal rules are a means to an end. The government’s fiscal policy is ultimately constrained by the need to service its debt. While a sovereign country with an independent central bank could in theory print money to meet debt servicing costs, there are good reasons not to do so. This means that the government is constrained by what financial markets are willing to lend it and at what price. Fiscal rules are one (imperfect) means of trying to ensure that government policy remains consistent with that constraint.
It is questionable, though, whether a target for PSNW would help serve that purpose, because a change in net worth does not necessarily contain useful information about the government’s ability to service its debt. This is perhaps the fundamental problem with a net worth target, at least if not set alongside other targets, rules or constraints which take account of this purpose. An increase in the estimated value of non-financial assets (such as land or buildings, which make up the majority of government assets – see Figure 6.3) would increase PSNW, and thus could be taken as a signal that the government is able to borrow more and take on more debt. But those assets cannot, in many cases, be sold to meet the financing costs associated with that debt.15 If they could be sold, it would presumably be because the new private owners would be able to start charging for something (e.g. driving on a motorway) that was previously free to the public (Giles, 2023). And, as discussed below, an increase in the estimated value of (for instance) the road network does not necessarily mean that it will be making a greater indirect contribution towards the government’s ability to service its debt, via economic activity and growth, nor that the government’s fiscal position has meaningfully improved.
A PSNW target could, as a result, send perverse signals about what a government can ‘afford’ to borrow. Section 9.2 described how rising interest rates and falling gilt values have, under one measure, led to an improvement in the UK government’s PSNW of some 40% of GDP over the past two years. Does that point to space for lots more borrowing? That would disregard rising government borrowing costs, and the fact that a combination of elevated borrowing and the Bank of England’s quantitative tightening programme means that the market is being asked to absorb what one market participant described as a ‘cataclysmic’ volume of gilt issuance this year.16 While PSNW offers a more comprehensive picture of the public finances, it might tell us less about what is most relevant for real-time fiscal policymaking.
At a minimum, this suggests that assessments of PSNW need to come alongside traditional assessments of debt, debt interest and deficits (International Monetary Fund, 2018).
Valuing non-financial assets is difficult
The most significant difference between PSNW and other balance sheet measures is its inclusion of non-financial assets. Putting a value on these assets is complicated and fraught with difficulty.
One particular issue for the suitability of PSNW as a fiscal target is that, depending on which methodology is chosen, changes in the recorded value of non-financial assets might be of limited relevance for an assessment of fiscal sustainability. Ebdon and Khatun (2021) point to the fact that statistical manuals generally call for non-financial assets to be recognised at their ‘replacement value’ – how much it would cost to replace the asset in its current condition. An increase in either land prices or building costs would increase the replacement value of the rail and road network (because replacing them would require the government to spend more on land and construction). But, as noted by Ebdon and Khatun, the government cannot (or is at least highly unlikely to) take advantage of higher land prices by selling off the road or rail network, and higher building costs will make future infrastructure investments more expensive (meaning that the government will be forced to spend more in future). In this case, an increase in the measured value of non-financial assets could not be said to have improved the government’s fiscal position – or, as argued above, to have increased the amount the government can afford to borrow.
The previous section noted that a PSNW target could, in theory, provide a framework for assessing the quality of government investment, and encourage the government to borrow to invest only where the value of assets created would be greater than or equal to the cost of financing. The crux is that we might like to encourage the government to invest wherever there is a compelling case that the present economic (or social) value of the investment is greater than the costs of financing it (or perhaps where the benefit–cost ratio is above some minimum level). But the ‘value’ recorded in PSNW might have little relevance for such an assessment, if in many cases it instead just reflects the replacement cost. If an infrastructure project turned out to be a ‘white elephant’, would that be captured, or would it still be recorded at its replacement cost? Or, in the happier case where a project yields unexpectedly high returns, would that enter PSNW in any meaningful sense? We could adopt measures to promote investment in high-quality projects with high returns without adopting a PSNW target.
The previous section also noted that a PSNW target could, in theory, increase the incentive to manage and maintain public sector assets. This rests on the assumption that the condition of those assets can (and would) be regularly, rigorously and accurately assessed. If the government chose to cut the deficit by ceasing to spend anything on road maintenance, would that affect the valuation of the asset, or would it continue to be depreciated in line with whatever methodology was decided when it was constructed? A rigorous, bottom-up valuation of all public sector assets seems unlikely to occur on a regular basis, and so a government’s decisions around maintenance might have limited impact on the valuations used for the calculation of PSNW (at least over the forecast period).
There are two further concerns worth noting here. The first is that changes in asset values could be correlated with the economic cycle (International Monetary Fund, 2018), meaning that asset values (and so net worth) could fall at the point when a fiscal expansion or stimulus might make most sense, and vice versa. The second is that these changes are likely to be complex, unintuitive and difficult to communicate. We therefore ought to be cautious about letting changes in such valuations govern fiscal policy.
PSNW is highly sensitive to definition and modelling choices
A broader and related concern is the sensitivity of PSNW estimates to definitional and modelling choices. That is true of all fiscal metrics, to an extent, but it is particularly acute for PSNW, where choices over accounting parameters can have enormous impacts. Section 9.2 discussed how different methodologies for valuing debt securities have painted very different pictures in recent years. To complicate matters, the ESA 2010 measure and the new measure recently developed by the ONS (to be consistent with other fiscal aggregates – see Office for National Statistics (2021)) use the face value of debt; the IMF-GFSM measure uses the market value; and the OBR uses the nominal value in its preferred measure. This rather obscure and technical choice could have big implications if the change in PSNW were used as a guide for policy.
To give another example, the largest single liability on the government balance sheet is its unfunded public sector pension promises. Relatively small changes to the actuarial assumptions used to place a present value on these (e.g. around life expectancy, or future GDP growth) can have big effects (O’Brien and Zaranko, 2023). Changes in the level of pension liabilities, driven by changes in the discount rate, are usually the single largest moving part in the government’s balance sheet (Ebdon and Khatun, 2021). The choice of discount rate, and how often it is updated, therefore matters hugely and could easily prove to be the difference between a government meeting and missing a PSNW target. These changes in the estimated level of liabilities might be less useful for fiscal policymaking than an analysis of future flows (e.g. forecasts for future spending on public service pension payments each year, as a share of national income, already produced regularly by the OBR).
It ignores the biggest state assets and liabilities
Regardless of which definition of PSNW is used, there is a more fundamental critique. As noted in Section 9.2, measures of PSNW do not capture the government’s single most important asset (its ability to tax) or its most important liabilities (the implicit promise to provide healthcare, state pensions, schooling, child benefits, etc. in future). Estimates of the ‘intertemporal public sector balance sheet’ aim to capture this, but these are even more fiendishly complicated than estimates of PSNW, are highly sensitive to assumptions around things such as population growth, and are even more sensitive to the choice of discount rate. This is another reason why an analysis of future spending flows might be more useful.
PSNW forecasts are volatile and subject to large level shifts
One concern with targeting a balance sheet measure such as PSNW is that it could be more volatile than a conventional measure such as PSND because market values can oscillate (the change in the value of debt securities in Panel B of Figure 6.3 is a case in point) and because changes in accounting parameters can cause large valuation changes. Previous work has argued that year-on-year changes in PSNW (in the out-turn) have in fact been less volatile than those in PSND (Hughes, 2019).17 But if PSNW is to be used for real-time fiscal policymaking, this is perhaps less important than the volatility of forecasts. A lack of data makes it difficult to draw firm conclusions on this question. But what data there are suggest that PSNW forecasts might be more volatile than forecasts for PSND – especially in the recent past.
Between 2002 and 2011, HM Treasury compiled a monthly Public Sector Finances Databank, which included forecasts for PSNW and PSND.18 And since 2018, the OBR has produced forecasts for PSNW (under a different definition), alongside the usual forecasts for PSND. These successive forecasts are shown in Figure 6.6; Figure 6.7 then compares several measures of the volatility of these forecasts. This is, by necessity, an incomplete and imperfect exercise. But because these forecasts were produced at the same time, by the same institutions, comparing them tells us something about their relative volatility.
Figure 6.6. Successive forecasts for PSND and PSNW since 2002
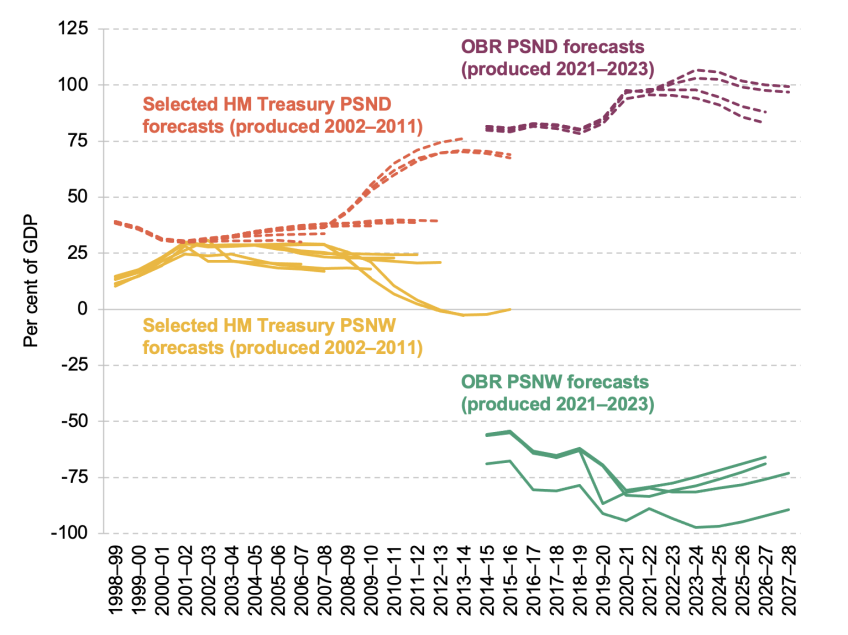
Note: Different series are based on different methodologies and so should not be directly compared. OBR PSNW forecasts value debt securities at their nominal value (versus market value under the ESA framework and face value under the IMF-GFSM framework). HM Treasury forecasts are from August of each year between 2002 and 2011, apart from 2004 (no data available), 2005 (September) and 2011 (March). HM Treasury stopped publishing estimates for PSNW in April 2012. OBR forecasts are from each Economic and Fiscal Outlook between October 2021 and March 2023.
Source: HM Treasury Public Sector Finances Databank (discontinued); OBR Economic and Fiscal Outlook (various); and all sources for Figure 6.2.
Figure 6.7. Volatility of forecasts for PSND and PSNW as a percentage of GDP
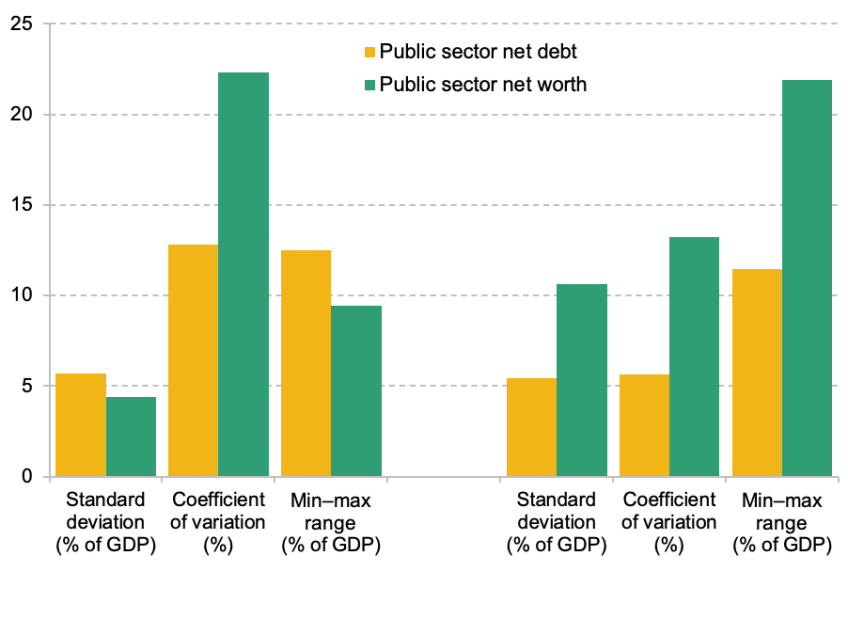
Note: Displayed values denote the mean value of each measure for the period in question. Coefficient of variation is defined as the standard deviation over the mean.
Source: Author’s calculations using data underlying Figure 6.6.
The analysis suggests that forecasts for PSND were more volatile than forecasts for PSNW on two out of the three measures during the 2000s (the left-hand side of the charts). But in the more recent period, when the OBR has produced ‘proper’ forecasts for both measures, PSNW forecasts have been considerably more volatile on all three measures (the right-hand side).
To illustrate this, consider the forecasts for the 2026–27 financial year. The OBR’s forecasts for PSND have ranged from 83.1% of GDP (in March 2022) to 100.0% of GDP (in November 2022), with a standard deviation of 8.0% of GDP and a min–max range of 16.9% of GDP. For PSNW, forecasts have ranged from minus 65.9% of GDP (in March 2022) to minus 92.2% of GDP (in November 2022), with a standard deviation of 11.7% of GDP and a min–max range of 26.3% of GDP. In other words, PSNW forecasts for that year have been more volatile than those for PSND. The same is true for the recent period as a whole (summarised in Figure 6.7).
We ought to be cautious about targeting something that is subject to large shifts in levels. Hughes (2019) recognises this concern, and argues that the government should therefore express its PSNW target in terms of direction of travel over the medium term. Hughes et al. (2019) subsequently recommended that the government target an improvement in PSNW over the fixed five-year period from 2020–21 to 2024–25. But if a level shift were to occur during that five-year period (due, for instance, to changes in interest rates and discount rates, as have been seen in recent years), then that would affect the direction of travel. The fact that PSNW estimates are likely to be more subject to large shifts in levels (and the fact that these level shifts are likely to be difficult to communicate) might reduce the usefulness of PSNW as a fiscal target.
It will simply shift the boundary around which ‘fiscal fiddling’ takes place
As described in Section 9.3, some of the potential benefits of a PSNW target could come from discouraging governments from taking poor fiscal decisions in the pursuit of a reduction in measured headline debt – that is, allowing accounting treatment to determine economic policy. But switching to a more comprehensive measure such as PSNW would by no means eliminate this sort of behaviour. Instead, it might merely move the boundary around which ‘fiscal fiddling’ takes place.
Ebdon and Khatun (2021) use the example of the reclassification of housing associations in 2017 to demonstrate this point. The government of the day relaxed regulation of housing associations with the explicit objective of convincing the ONS to reclassify them as being in the private, rather than public, sector.19 It was successful: the ONS, after being ‘invited’ to do so, reclassified housing associations as private sector entities. Although (as noted by the OBR at the time) this had no meaningful effect on the underlying health of the public finances (as the government would presumably still feel an obligation to intervene if a housing association ran into difficulty), this did have an impact on a range of fiscal metrics. The reclassification resulted in a reduction in headline PSND (reflecting the fact that loans taken out by housing associations were removed from the total). But it also shifted the (non-financial) housing assets of the housing associations out of the public and into the private sector. The net result was a deterioration in public sector net worth (because the assets were larger than the liabilities). So, because the government was motivated by the impact on PSND, it chose to deregulate housing associations to have them reclassified as being in the private sector; if it had been focused on PSNW, it would have faced the opposite incentives. Some future government, armed with a PSNW target, might decide to re-regulate housing associations to have them reclassified as being public sector bodies, and improve PSNW in the process.
The point is that the temptation for governments to allow accounting treatment to govern economic policy would not be eliminated upon adoption of a PSNW target. Instead, it might just create incentives for new and different types of ‘bad fiscal behaviour’.
It could exacerbate Chancellors’ tendency to respond asymmetrically to shocks
In Chapter 5 of this Green Budget, we describe how Chancellors since 2010 have displayed a tendency to respond asymmetrically to economic shocks. In particular, they have displayed a tendency to loosen in response to ‘good news’ to a greater extent than they tighten in response to ‘bad news’.
A PSNW target might exacerbate this asymmetric behaviour, owing to the technical nature of some of the changes likely to occur between fiscal events. In particular, one can easily imagine a Chancellor disregarding a deterioration in PSNW driven by ‘an obscure technical change’ to how the government values its non-financial assets or pension liabilities, arguing that this should not govern tax and spending decisions in the real world. But when handed an improvement in PSNW from a ‘technical change’ in the opposite direction, Chancellors may not be able to resist the temptation to use this as justification for a tax cut or a spending increase. Whatever the right response to such changes, the response function should be symmetric. The additional complexity of a PSNW target, and the difficulty in communicating the reason for changes, could open the door to even more asymmetric behaviour.
It is just as likely to get discarded in a crisis
A common challenge in the design of fiscal rules is to avoid them being discarded in a crisis (or at the first sign that they might be missed). A PSNW target would suffer from the same challenge. Countercyclical fiscal policy is likely to add to liabilities (in the form of higher debt), but may not create any counterbalancing public sector assets, and so lead to a deterioration in PSNW. The COVID-19 furlough scheme is a case in point: the government borrowed large sums to fund the scheme, but the enhanced labour market attachment of the employees covered by the scheme does not appear as an asset on the public sector balance sheet. And though the furlough scheme might have been expected to boost future tax revenues, these are not captured in PSNW. Accordingly, PSNW deteriorated in 2020–21 (as per Figure 6.2).20 Strict adherence to a PSNW target would likely have precluded such borrowing (though, in reality, such a target would almost certainly have been abandoned).
There would, therefore, be a need for some sort of ‘escape clause’ in the face of a crisis. Hughes et al. (2019) proposed that their PSNW target be suspended in any years in which the OBR pre-measures forecast showed spare capacity in excess of 1% and Bank Rate below 1.5%. We note that such an escape clause would not have applied last year, and consider it highly likely that the net worth target would have been abandoned given the government’s desire to support households and firms with the elevated cost of energy. The challenge of designing an appropriate ‘escape clause’ is not specific to a PSNW target; the point is rather that moving towards a PSNW target would not change the fact that designing a fiscal framework that is suitable for all seasons is devilishly difficult, and building in an escape clause in the case of downturns would (further) complicate any PSNW target.
It does not change the fiscal fundamentals
More generally, moving to a PSNW target would not change the fundamental fiscal challenges facing the UK. Many proponents of a net worth target also advocate higher levels of government borrowing and investment spending. To listen to some commentary, one would think that the UK government could, with one simple trick, shake off its fiscal shackles and borrow to its heart’s content. But adopting a PSNW target would do nothing to change the facts and constraints described in the OBR’s recent Fiscal Risks and Sustainability report (Office for Budget Responsibility, 2023). It would do nothing to change the fact that with elevated debt, rising interest rates and sluggish growth, Chancellors now need to run a larger primary surplus to stabilise debt-to-GDP (Office for Budget Responsibility, 2023). It would do nothing to change the fact that in the face of demographic pressures and geopolitical risks, fiscal policy will need to be tighter in the ‘good’ times to build up fiscal buffers and provide the space to respond to adverse shocks. Those shocks are coming along with alarming frequency; the IMF has argued that the fiscal buffers needed to manage shocks might be larger than previously thought as a result (Caselli et al., 2022). That is true whether the government is targeting PSND, PSNW or something else. One can argue that a PSNW target would be an improvement on the existing framework, but adopting one would not magically alter the difficult fiscal reality facing the UK.
6.5. Conclusion
All else being equal, we might think that aiming for higher public sector net worth is a ‘good thing’. There is certainly no reason why we should deliberately aim to reduce net worth over an extended period. Some caution is needed, however. Bringing more of the economy into the public sector might well increase public sector net worth (at least in the short term). But that does not in itself make it a desirable outcome. In an extreme case, consider a scenario in which the government used compulsory purchase powers to acquire (say) the water industry for half of its market value. Public sector net worth would shoot up. But the UK’s economic prospects might materially worsen, given the likely impact on private investment and wider investor confidence. The immediate impact on public sector net worth will not necessarily be a good guide for policy.
Nonetheless, having a broad objective to increase public sector net worth over time seems sensible, as does Labour’s promise to ‘take greater account’ of it. There are definite cases where looking at net worth is more useful than a narrow focus on debt. Considering the impact of decisions on both sides of the balance sheet as part of the policymaking process could reduce the incentive for governments to engage in certain types of ‘bad fiscal behaviour’, such as selling off assets for less than they are worth. A more comprehensive picture of the benefits and costs of government action and inaction is valuable.
Yet there are, in our view, strong reasons to doubt the usefulness of a public sector net worth target as a fiscal rule. Provided that the government borrows and purchases assets for what they are worth (leaving net worth unchanged), a net worth target by itself puts no constraint on what the government can borrow and spend. That might be desirable, if the government borrows only to invest in high-return projects where the net economic benefits will comfortably exceed the costs of financing – but the value used for public sector net worth estimates will not necessarily inform such an assessment.
The most significant feature of public sector net worth, relative to other balance sheet measures, is its inclusion of non-financial assets. But there is no reason to expect changes in the recorded value of those assets (which make up the majority of government assets and in many cases cannot realistically be sold) to provide useful information about how the government’s ability to service its debt, or the appropriate stance of fiscal policy, has changed. There might be good reasons for the government to invest more in the country’s physical infrastructure. It does not mean that complex estimates of the value of that infrastructure should directly enter the government’s fiscal rule.
Changes in net worth could even provide perverse signals about fiscal sustainability, and basing policy on those changes could prove unwise: a sharp increase in construction costs that pushes up the ‘replacement value’ of the road network could increase public sector net worth, and so permit additional borrowing for day-to-day spending or tax cuts – even though the government’s fiscal position would, if anything, have weakened. On one definition, rising interest rates (and falling market prices for gilts) have improved the UK’s measured public sector net worth by 40% of GDP over the past two years, similarly pointing to space for debt-fuelled tax cuts, even as borrowing costs soar. Choices over definitions and modelling assumptions would, in other words, have huge effects, and valuations would likely be subject to large shifts in levels. The government could strip out the most volatile and difficult-to-value elements, but that would beg the question ‘Why bother with a net worth target at all?’.
All things considered, our view is that the benefits of moving to balance sheet targeting might be insufficient to justify the potential costs involved.
There is also an argument that it would be the fiscal equivalent of using a sledgehammer to crack a nut. There might be simpler ways, for example, of encouraging the government to invest more when borrowing costs are low, or to invest where the returns are highest. On the latter, for instance, there is nothing to stop the government from imposing a minimum benefit–cost ratio for all infrastructure projects above a certain size, transparently publishing said ratios, and requiring the underlying cost–benefit analyses to be assessed by the National Infrastructure Commission (as recommended by Hughes (2019)) without adopting any sort of net worth target. Other countries seem to have managed to invest more, and build up higher public sector net worth, without the need for a formal target. If there are specific problems with the UK’s policymaking process or institutional set-up, adopting (what is in our view) a badly designed fiscal rule might not be a good way of going about fixing them.
As a final point, our argument is not that the government’s existing debt target is perfect (it is not) or that the government need necessarily retain a debt target at all (it need not). Some variant of a target for debt interest might make more sense (as per Furman and Summers (2020)). Our argument is that public sector net worth ought not to be at the centre of the UK fiscal framework. It could – and indeed should – be included as part of a broader suite of measures, but that would need to include traditional measures of debt, debt interest and deficits. This is, broadly speaking, the approach already outlined in the government’s Charter for Budget Responsibility.21 In the short term, the key point is that with elevated debt, rising interest rates and a weak outlook for growth, it is the ‘traditional measures’ which are likely to be the binding constraint on fiscal policy, irrespective of any target for or change in public sector net worth.Endnotes
Authors

Ben Zaranko
Ben is a Senior Research Economist and an editor of the IFS Green Budget. His work focuses on the health and social care system and UK fiscal policy.
More from IFS
Understand this issue


Policy analysis


Academic research


