
Downloads
Download report PDF
PDF | 838.85 KB
Executive summary
The last 25 years has seen a transformation in how early years education and childcare is approached in England. The establishment and subsequent expansions of a ‘free entitlement’ to funded early education and childcare have seen early years spending quadruple over the last 25 years, and a major expansion of support announced at the March 2023 Budget will lead total spending to more than double.
However, there are considerable challenges with the design, delivery and distributional consequences of these reforms. In this report, we examine how total spending on the early years system and on the free entitlement has changed; explore the impact of demographic changes; set out forecasts for how total spending and spending per hour might change going forward; and analyse some of the opportunities and challenges with the Budget reforms.
Key findings
1. Total spending on the early years education and childcare more than quadrupled between 2001–02 and 2018–19, when it reached £6.5 billion. Total spending has since fallen back to £5.4 billion, driven partly by lower real-terms spending on the free entitlement and partly by reductions in spending on tax reliefs and (especially) subsidies through the benefits system. Still, this represents a major increase in resources at a time when other stages of education have been squeezed.
2. From September 2025, all children in working families will get up to 30 hours of funded childcare a week from nine months old. These new entitlements will mean that free entitlement spending doubles between this year and 2026–27: the largest and fastest expansion on record.
3. Once childcare providers’ costs are considered, core funding per hour for 3- and 4-year-olds was more than 17% lower in 2022–23 than it had been a decade previously. Core funding per hour for 2-year-olds in 2022–23 was no higher in real terms than it was when the entitlement was introduced in 2015–16.
4. The Budget included new money to raise funding rates for existing entitlements. Even so, we estimate that core resources per hour for 3- and 4-year-olds in 2024–25 will be 11% below their level in 2012–13 once providers’ costs are taken into account. The government is instead prioritising younger children: for 2-year-olds, the average (cash terms) funding rate will reach £8.17 in that year, nearly £1 an hour higher in real terms than its previous peak in 2017–18.
5. By 2024–25, funding per hour for the under-2s and for 2-year-olds is set to be significantly above what the private market charges. This should help providers to deliver the new entitlements, and protect against providers opting out of the programme. However, the funding rate for 3- and 4-year-olds is much closer to existing market prices (and has been squeezed over the last decade).
6. The transition from legacy benefits to universal credit, a squeeze on generosity in the benefits system, and a cash-terms freeze in the maximum allowable income for eligibility have all reduced eligibility for the existing 2-year-old offer. While it covered nearly 40% of children when it was introduced in 2015, in 2022 just over a quarter of children were eligible for the disadvantaged 2-year-old offer.
7. New entitlements announced in the budget continue the trend of increasingly targeting support towards children in working families, with the bottom 30% of the income distribution seeing almost no direct benefit from the proposals. While the new entitlements will directly benefit just over half of parents with a child aged between nine months and two years, that includes a fifth of families earning less than £20,000 a year and four-fifths of families with household incomes above £45,000.
8. Despite this clear focus on supporting parents to work, the new entitlements are expected to mostly shift who is paying for care. The Office for Budget Responsibility estimates that the reforms will draw the equivalent of an additional 65,000 parents into full-time work. Based on existing childcare use amongst parents with young children, we estimate that around five-sixths of spending on the new entitlements will pay for care that parents would have otherwise paid for themselves.
9. These changes in the early years landscape have taken place alongside large demographic shifts in the pre-school population. The number of 3- and 4-year-olds in England has fallen by 115,000, or 8%, since 2016–17. This is set to accelerate: there are likely to be 120,000 fewer 3- and 4-year-olds in 2025–26 than there are today. This could pose challenges to providers, who are funded on a per-capita basis.
1. Introduction
The last 25 years has seen a transformation in how early years education and childcare is approached in England. As Figure 1 shows, total spending on support for early years education and childcare – including the ‘free entitlement’ to a funded early education place as well as childcare subsidies through the tax and benefit system – rose from £1.5 billion in 2001–02 to £4.2 billion in 2009–10 in today’s prices. Total spending peaked at £6.5 billion in 2018–19 and has since fallen back to £5.4 billion in 2022–23.
Figure 1. Total spending on support for early education and childcare
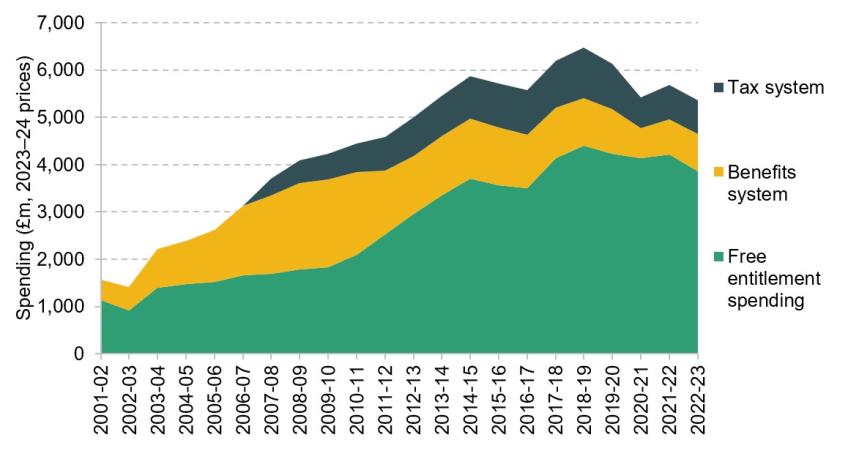
Note: Free entitlement spending includes spending on the universal entitlement for 3- and 4-year-olds, the extended entitlement for 3- and 4-year-olds in working families, and the entitlement for disadvantaged 2-year-olds. Spending through the tax system includes the value of tax reliefs via employer-sponsored childcare vouchers and tax-free childcare, but not the value of VAT exemptions. Spending through the benefit system includes childcare subsidies in universal credit and its predecessors. Spending through universal credit is imputed by combining the average payment for the childcare element in 2021–22 (the only year this statistic is available) with annual take-up figures released by the Department for Work and Pensions. This assumes the average value of the universal credit childcare payment remains constant in cash terms. Spending in both the tax system and the benefit system is reported on a UK-wide basis. We approximate spending in England by rescaling by the English share of the UK’s under-15 population. Spending in both the tax and benefit systems includes spend on children aged 5 or above. For most schemes, the vast majority of take-up is by families with children under the age of 5; hence we make no adjustment, though we recognise that total spend goes on a wider age range. More detail of our methodology can be found at https://ifs.org.uk/education-spending/methods-and-data.
Source: See https://ifs.org.uk/education-spending/methods-and-data.
There have been dramatic changes in the composition of early years support as well as in its total amount. In 2009–10, spending on the free entitlement was equal to the amount spent on childcare subsidies through the benefits system for low-income working families. Since then, free entitlement spending has doubled. Meanwhile, spending on childcare subsidies through the benefits system (which cover up to 85% of childcare costs for low-income working families) has fallen by two-thirds. And, after a decade in which support through tax reliefs like childcare vouchers and tax-free childcare trebled, spending is now a quarter lower than before the COVID-19 pandemic.
The next few years will see another round of transformation. In his March 2023 Budget, Chancellor Jeremy Hunt pledged to expand the free entitlement: by September 2025, the programme will offer the equivalent of 30 hours a week of funded term-time care to all children in working families from 9 months until the start of school. This expansion is the latest in a series of reforms to the free entitlement, which has been progressively expanded to cover more hours, more weeks and more children (Table 1).
Table 1. Key reforms to national free entitlement policies in England
| Ages | Hours/weeks | Weeks/Year* | Targeting | |
|---|---|---|---|---|
| September 1997 | 4 | 12.5 | 33 | |
| April 2004 | 3 & 4 | 12.5 | 33 | |
| April 2006 | 3 & 4 | 12.5 | 38 | |
| September 2009 | 3 & 4 | 12.5 or 15 | 38 | 15 hours for 25% most disadvantaged |
| September 2010 | 3 & 4 | 15 | 38 | |
| September 2014 | 2 | 15 | 38 | For the ~20% most disadvantaged |
| September 2015 | 2 | 15 | 38 | For the ~40% most disadvantaged |
| September 2017 | 3 & 4 | 15 or 30 | 38 | 30 hours for children whose parents work and earn <£100k each |
| April 2024 | 2 | 15 | 38 | 15 hours for 40% most disadvantaged 15 hours for children whose parents work and earn <£100k each |
| September 2024 | 9–23 months | 15 | 38 | 15 hours for children whose parents work and earn <£100k each |
| September 2025 | 9 months –2 years | 15 or 30 | 38 | 15 hours for 40% most disadvantaged 2-year-olds 30 hours for children whose parents work and earn <£100k each |
Note: ‘40% most disadvantaged’ 2-year-olds include children whose parents receive specific means-tested benefits, as well as those who have an Education, Health and Care Plan or who have previously been in care. The share of children covered has been falling over time, and stood at about 27% in 2022–23.
Source: Adapted from table 2.1 in Belfield, Farquharson and Sibieta (2018).
In this report, we examine how total spending on the early years system and on the free entitlement has changed (Section 2); explore the impact of demographic changes (Section 3); set out forecasts for how total spending and spending per hour might change going forward (Section 4); and analyse some of the opportunities and challenges with the Budget reforms (Section 5). Finally, Section 6 concludes.
2. Spending on early years education
Total spending on the free entitlement
As demonstrated in Figure 1, by far the biggest programme of early years spending in England is the ‘free entitlement’ to a funded early education place. There are a number of distinct offers within the free entitlement programme:
- a universal offer to 15 hours a week for all 3- and 4-year-olds;
- an extended entitlement to 30 hours a week for 3- and 4-year-olds in working families;
- a disadvantage offer of 15 hours a week for the most disadvantaged 2-year-olds;
- and, rolled out between April 2024 and September 2025, new ‘Budget entitlements’ to 30 hours a week for children from nine months to the end of age 2 in working families.
This final group of programmes, announced in the March 2023 Budget, will eventually mean that children in households where all adults are in paid work will be entitled to up to 30 hours a week of funded childcare from the end of parental leave (at nine months) until they start school.
Each of these entitlements is based on ‘term-time’ care, for 38 weeks a year. In practice, families can choose to spread their entitlements over more weeks, but this reduces the number of hours they can use each week. For example, a 30-hour entitlement spread across 47 weeks of the year equates to about 24 hours a week.
Figure 2 shows how total spending on the free entitlement has changed over time across each of these programmes. Importantly, total spending on the free entitlement has risen substantially over time, and is set to rise still further as the Budget reforms are implemented. This significant increase in total resources spent on early education and childcare is particularly noteworthy in a context where spending at other stages of education has been squeezed (Drayton and Farquharson., 2022), and when public services outside of health have seen successive very tight spending settlements (Zaranko, 2022; Adam et al., 2023).
Figure 2. Total real-terms spending on free entitlement hours in England
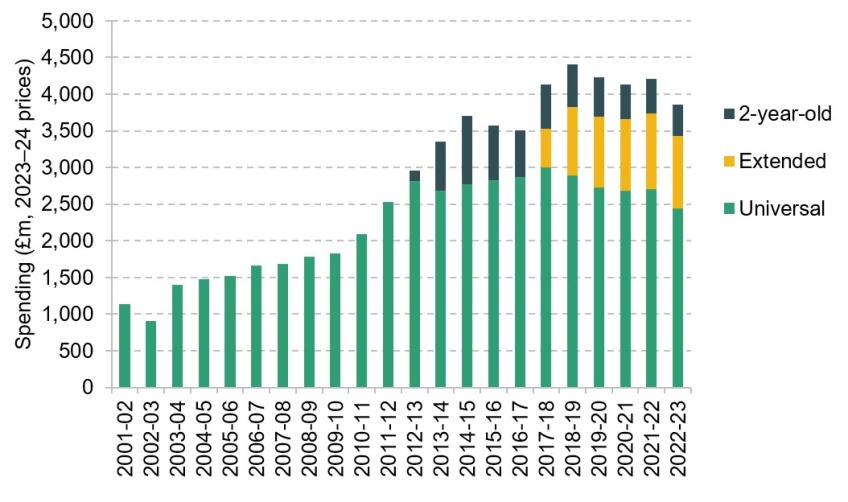
Note: ‘Universal’ entitlement refers to the entitlement to 15 weekly hours of funded care for 3- and 4-year-olds during term time. The ‘extended’ entitlement captures the additional 15 hours a week that 3- and 4-year-olds in working families can access. The ‘2-year-old’ offer provides 15 hours of funded childcare to 2-year-olds in disadvantaged families. It was initially piloted in a small number of areas in 2012, before being rolled out nationally in 2013. Because our data on total spending do not split out the universal and extended entitlements, we allocate total spending proportional to their budgets from the Dedicated Schools Grant.
Source: See https://ifs.org.uk/education-spending/methods-and-data.
Even so, Figure 2 also highlights that increases in the total budget for the free entitlement have been driven by expansions in its generosity. All of the increase in overall free entitlement spending in the decade since 2012–13 came from the introduction of the 2-year-old and extended entitlements; spending on the core universal offer fell from £2.8 billion in 2012 to £2.4 billion last year (all in 2023–24 prices). In Section 3, we explore how changes in population and in funding rates contribute to this pattern.
Spending on the 3- and 4-year-old entitlements
Spending on the free entitlement has been prioritised relative both to other stages of education and to many other public services. In Figure 3, we look at total spending on 3- and 4-year-olds (including both the universal entitlement and the extended 30-hour offer). We index real-terms spending to its 2009–10 level to make clear how spending has changed over time.
Figure 3. Growth in real-terms spending on the free entitlement for 3- and 4-year-olds
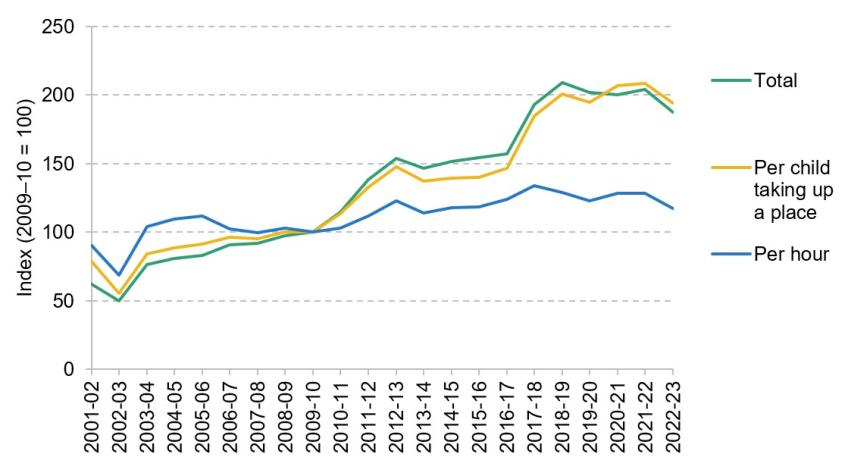
Note: Spending on universal and (from 2017–18) extended entitlements for 3- and 4-year-olds. Spending per place is spending per part-time-equivalent place (15 hours) across both entitlements, so a child accessing their full universal and extended entitlement would count towards two part-time-equivalent places; see https://ifs.org.uk/education-spending/methods-and-data for more details.
Source: See https://ifs.org.uk/education-spending/methods-and-data.
Overall, spending rose sharply over the 2010s: spending in 2019–20 was double what it had been a decade earlier. The following years have seen significant volatility in spending: during the first year of the pandemic, spending fell by 9% in real terms despite significant protections (see Britton et al. (2020) for further detail). This recovered fully in 2021–22. But the unusually high level of inflation in 2022–23 hit real-terms spending again, leaving it 8% lower than the year before.
One factor affecting total spending on the free entitlement is the declining number of children taking up these entitlements, driven both by a falling population and by reductions in the take-up rate.
Since its peak in 2016–17, the number of 3- and 4-year-olds in England has fallen by 115,000, or about 8% of its peak. At the same time, take-up rates of the 3- and 4-year-old entitlements have been falling. During the mid-2000s, around 98% of children took up their free entitlement place. Even outside of the COVID-19 pandemic period, in recent years take-up rates have hovered around 93%. While this still means extremely high take-up rates compared to most other government programmes, if take-up rates in 2022–23 were still at their peak, an additional 52,000 children would be using the free entitlement.
Figure 3 looks at the influence of both of these factors on spending on the free entitlement. Spending per child taking up a place has been less volatile than total spending (especially during the pandemic period), and is now about 94% above its 2009–10 level.
But, as outlined in Figure 2, most of this increase in spending per child comes from the increasing generosity of the free entitlement, and especially the introduction of the 30-hour extended entitlement in 2017. Figure 3 therefore also shows how spending per hour has changed over time. This is the best measure of the resources that early years providers have to deliver the free entitlements.
During most of the 2010s, spending per hour increased (though much less dramatically than total spending). There is clear evidence of a ‘ratchet’ pattern, where a big jump in real-terms spending is followed by real-terms decline as cash-terms funding settlements are eroded by inflation.
Spending per hour peaked in real terms in 2017–18, when funding rates were increased to help smooth the introduction of the 30-hour extended entitlement. At that point, spending per hour was 34% above its 2009–10 level. Spending per hour then steadily fell in real terms over the next three years before another increase in funding rates in 2021–22.
Despite a further rise in cash-terms funding rates in 2022–23, higher-than-expected inflation has meant a significant drop in real-terms spending per hour over the last year. In real terms, spending per hour in 2022–23 was 8.5% lower than it had been the year before, the steepest one-year drop in our data series. This has left spending per hour for 3- and 4-year-olds 17% above its 2009–10 level, its lowest level since 2013–14.
Spending on the 2-year-old entitlement
In contrast to spending on the 3- and 4-year-old entitlements, total real-terms spending on the 2-year-old offer (shown by the dashed green line in Figure 4) has fallen in each year since the entitlement reached its present form. One major reason for this is that, in the early years of the entitlement, the government budgeted significantly more for the programme than it ended up spending, as take-up was not as high as expected. Because our main series of spending is based on budget data submitted by local authorities, some of the year-on-year cuts to spending just reflect greater realism in the budgeting process.
For this reason, for the 2-year-old offer, it is also useful to consider how core funding for the entitlement has changed since the offer took its current form in 2015. The solid green line in Figure 4 shows that the decline in out-turn (actual) funding has not been as steep as the changes in budgeted spending. Even so, actual funding in 2023–24 is nearly a quarter lower in real terms than it was in 2015–16.
Figure 4. Budgeted and actual spending on the 2-year-old entitlement, indexed (2015–16 = 100)
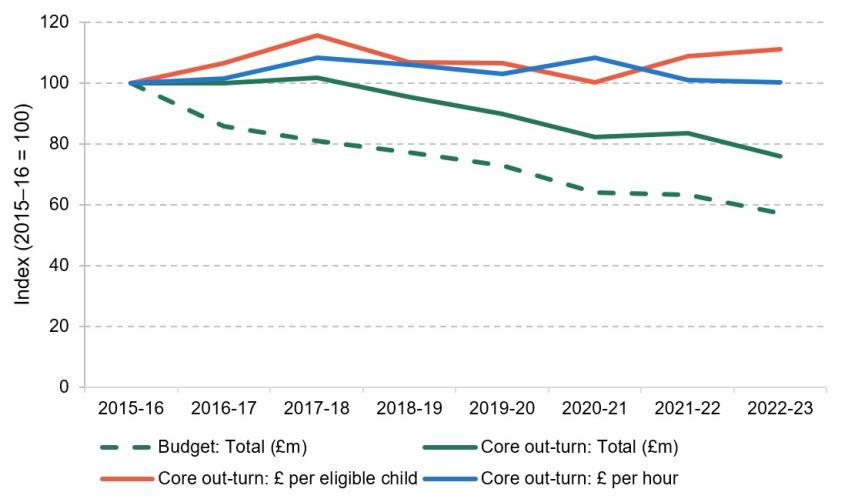
Note: ‘Budget’ series refers to local authority budgets submitted through the Section 251 process. ‘Core out-turn’ data are drawn from the Dedicated Schools Grant, which are updated to reflect actual funding, but do not capture wider elements of spending such as local authority top-ups or additional uplifts within the Early Years National Funding Formula.
Source: See https://ifs.org.uk/education-spending/methods-and-data.
Partly, this reflects the same factors influencing the 3- and 4-year-old entitlements: falling population numbers and several years where the core funding rate was held constant in cash terms (and so eroded providers’ real resources). But the 2-year-old offer is also affected by significant changes to the population of children who are eligible for the entitlement.
Although it is commonly referred to as an entitlement for the ‘40% most disadvantaged’ 2-year-olds, the programme is actually a passported benefit. This means that eligibility for the entitlement is determined by whether families receive certain other benefits (or whether the child meets other criteria, such as having an Education Health and Care Plan or being a care leaver). In 2015–16, these criteria did cover nearly 40% of 2-year-olds. However, since then, eligibility rates have fallen due to the transition from legacy benefits to universal credit; the tightening of the coverage and generosity of the working-age benefits system; and the impact of wages rising while eligibility thresholds remain fixed in cash terms. Taken together, in 2022–23, just 27% of 2-year-olds were eligible for the entitlement (Farquharson, 2023).
Set against these tighter eligibility criteria is a rising take-up rate. In 2015–16, 58% of eligible 2-year-olds took up their free entitlement place. That rose to 68% the following year and has since stayed close to 70%, with the exception of a dip during the pandemic in 2020–21.
Figure 5 decomposes the change in number of 2-year-old places taken up between 2015–16 and 2022–23 into changes due to: population; eligibility; and take-up. Between 2015–16 and 2022–23, the total number of 2-year-old places fell by a quarter. In part, this is down to demographics: the 2-year-old population shrank from around 690,000 in 2015–16 to around 610,000 today, a 12% drop in less than a decade. We discuss these demographic shifts in more detail in Section 3. Yet, as Figure 5 shows, the decline in eligible population has contributed around twice as much to the decline in places as falls in population, and the rising take-up rate has only partially offset these major shifts.
Figure 5. Decomposition of changes in places taken up for the 2-year-old entitlement
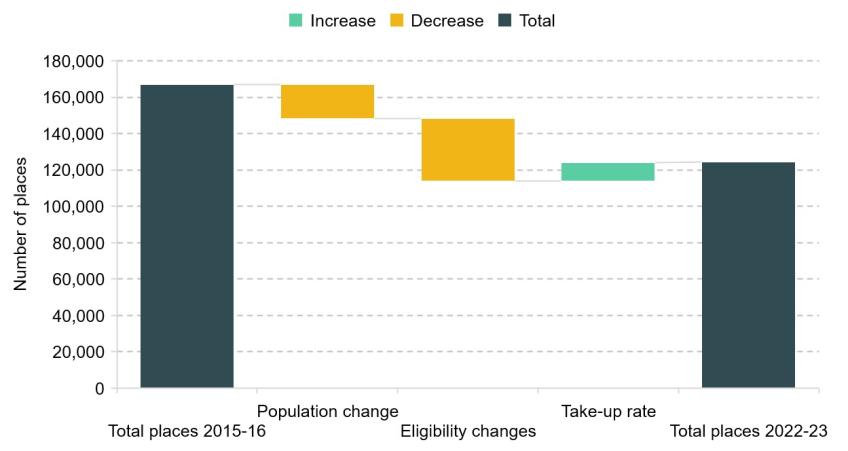
Note: To illustrate the number of places lost or gained between 2015–16 and 2022–23 due to changes in population, eligibility and take-up rate, we simply scale the total number of places in 2015–16 by the percentage change in population of 2-year-olds, number of eligible 2-year-olds and take-up rate amongst eligible children, respectively, between 2015–16 and 2022–23.
Source: See https://ifs.org.uk/education-spending/methods-and-data.
3. Demographic changes
As discussed previously, one challenge going forward for the early years sector will be navigating substantial demographic shifts. As Figure 6 shows, from the mid-2000s England saw a substantial rise in pre-school age population, adding more than 280,000 3- and 4-year-olds over a decade. Since its peak in 2016–17, this demographic bulge has begun to recede and the number of 3- and 4-year-olds in England has fallen by 115,000, or about 8% of its peak. This trend is set to accelerate, with a further drop of 120,000 children expected by 2025–26, returning the number of pupils aged 3 and 4 to around 2005–06 levels.
Figure 6. Changes in population of pre-school age children
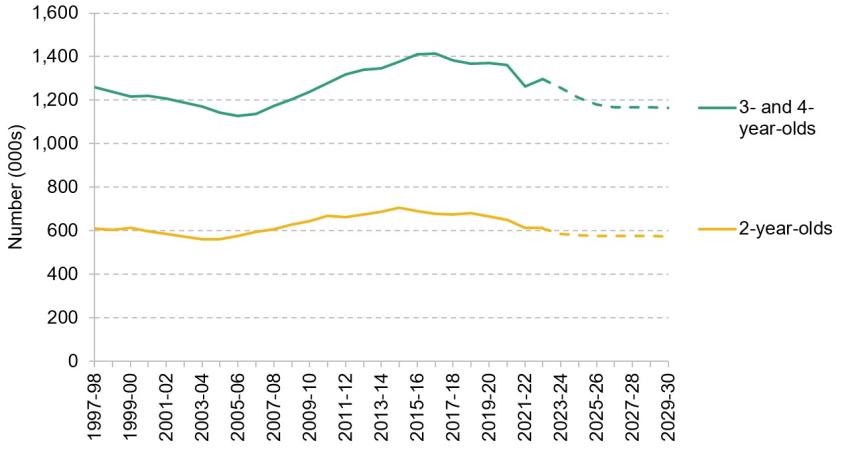
Note: Dashed lines indicate Office for National Statistics projected populations (2020-based using the 2011 Census). Updated projections based on the 2021 Census are expected in the second half of 2023.
Source: See https://ifs.org.uk/education-spending/methods-and-data.
The picture is similar for 2-year-olds: the population of 2-year-olds has declined year-on-year since 2014–15, leaving the 2-year-old population 13% lower last year than at the introduction of the 2-year-old offer.
These significant demographic shifts pose a challenge for the early years sector. Providers are currently (largely) funded on a per-capita basis, giving them an incentive to maximise the number of children they care for within the limits of the statutory ratios. Already, some providers operate below their ratios; the Department for Education’s 2022 Survey of Childcare and Early Years Providers, for example, found that a fifth of providers for 2-year-olds and at least a third of providers for 3- and 4-year-olds operated below their statutory ratio (Department for Education, 2022).
Smaller numbers of children will make this harder to achieve, certainly without significant closures in the sector. Providers that cannot attract enough children to fill their places will face more difficulty in covering fixed costs such as rents or mortgages with fewer funded places. While the sector as a whole is generally fairly ‘dynamic’, with lots of providers entering and exiting the market each year, significant churn brings with it a greater risk that some local markets are – at least temporarily – faced with larger problems of financial sustainability or access.
Set against this is the fact that, at least in some markets, parents report difficulty finding and accessing childcare places; a smaller number of children could help to ease the pressure in places where the childcare sector is already over-stretched. And the introduction of the new Budget entitlements for 2-year-olds in March 2024 may give providers a new group of children to tap into. Based on the Office for Budget Responsibility estimates of labour supply responses of parents with young children, our analysis suggests that the new entitlements could require around 65,000 additional full-time places for under-3s by 2027 (Drayton et al., 2023). This would offset around half the drop in the 2-year-old population since 2014–15.
4. Forecasting spending
The last two decades have seen huge changes in spending on the free entitlement, largely driven by expansions in provision. The next four years will see the biggest change yet, as reforms announced in the March 2023 Budget are introduced, doubling planned spending on funded childcare hours.
From April 2024, the entitlement will be extended to 2-year-olds in working families (defined in the same way as the extended entitlement for 3- and 4-year-olds), then expanded to children as young as nine months from September that year. The offer will initially cover up to 15 hours a week for 38 weeks of the year (though, again, it can be stretched to cover more weeks). This will rise to 30 hours in September 2025, at which point all children in working families will be entitled to up to 30 hours a week of funded care from the end of statutory parental leave through to the start of school.
Total funding for the free entitlement
So far in this report, we have largely focused on spending on the free entitlement. This is a holistic measure that includes both funding from central government as well as top-ups or under-spends by local authorities.
In order to explore how the Budget reforms will change the financial picture of the free entitlement, it is necessary to focus on central government funding for the entitlements. This funding comes through the Dedicated Schools Grant each year, and is allocated across local authorities through the Early Years National Funding Formula. This measure nevertheless captures almost all spending: in 2022–23, central funding for the entitlements accounted for over 98% of total spending on the free entitlement.
Overall, as Figure 7 shows, spending on the free entitlement is set to rise by almost 70% in real terms between 2022–23 and 2024–25. By 2027–28, total spending will be significantly more than twice as high as its 2022–23 level. As we discuss in Section 5, delivering on the promise of this funding is easier said than done; nevertheless, this represents a huge increase in the early years budget, which is all the more notable for the much tighter settlements imposed on other areas of public services.
Figure 7. Total core funding for the free entitlement, by programme (£ million, 2023–24 prices)
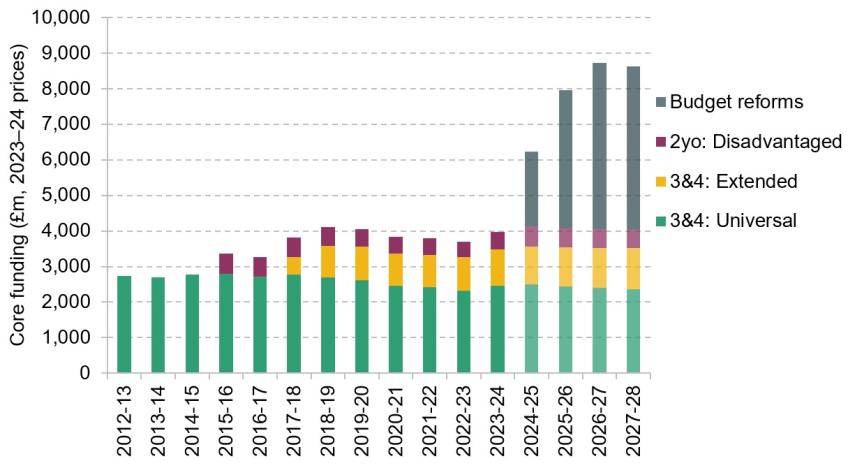
Note: See Box 1 for methodology.
Box 1. Methodology for forecasting total free entitlement funding
We focus on total free entitlement funding, and how it is allocated across programmes. To forecast spending out to 2027–28 (the final year of the forecast horizon for the March 2023 Budget), we combine information from the Budget with population projections, historical data on the take-up of different entitlements, and data on funding allocations from the Dedicated Schools Grant.
Estimating a baseline. First, we estimate a pre-Budget baseline. This captures how we would have expected funding to evolve in absence of the new entitlements announced at the Budget. While these plans were not explicitly set, we assume that total spending on each element of the free entitlement would be held constant in cash terms, adjusting for changes to population. This assumption is informed by previous years of Dedicated Schools Grant spending allocations, which have tended to remain relatively similar in cash terms from one year to the next (outside of major revisions at Spending Reviews).
Implications of the March 2023 Budget. The Budget set out the total amount of additional funding for the free entitlement until 2027–28, covering both uplifts to the funding of existing entitlements and spending on the new programmes. This lets us analyse how total funding for the free entitlement is set to change, relative to our assumed baseline.
Funding for specific entitlements. In order to analyse what the Budget means for existing entitlements, it is also useful to model how the total free entitlement budget might be allocated across the different programmes. This is an indicative rather than an exact process, but it helps to illustrate what the Budget promises could mean for providers.
First, we need to allocate the Budget uplift across existing and new entitlements. The Chancellor promised a funding uplift worth £202 million in 2023–24, rising to £288 million the following year. This money will raise the funding rate for existing entitlements.
- For 2023–24, the government has announced (Department for Education, 2023) that the uplift will raise average funding rates for 3- and 4-year-olds to £5.62 an hour from September, and for 2-year-olds to £7.95.
- For 2024–25, we know that the rate for 2-year-olds is set to rise to £8.17 in cash terms. Using our forecast for part-time equivalent places, we work out how much of the uplift this will use up and calculate what the rate for 3- and 4-year-olds could be based on the remainder.
- We then assume that these hourly funding rates are protected in real terms going forward. Coupled with projections for part-time equivalent places in each entitlement, this allows us to calculate the total budget and compare it to our assumed baseline.
- We then subtract the amount of additional funding implied by these plans from the total funding set out in the Budget scorecard, and assume that the difference will all be used to fund the new Budget entitlements. This leaves just under £4 billion in that year for the new entitlements.
Importantly for providers, part of this additional spending is an uplift for existing entitlements worth about £290 million next year. As we describe below, this uplift is largely being used to increase the rate paid for 2-year-olds in 2023–24 and then again (to a lesser extent) in 2024–25. There is also a smaller increase in the rate for 3- and 4-year-olds from September this year.
Funding rates
While the total amount of funding for the free entitlement is an important signal of the government’s priorities and the total investment in the early years, for individual providers the metric that matters most is usually the amount of funding per hour they receive for each child in their care.
In Figure 8, we show how core funding per hour (which excludes uplifts such as the Early Years Pupil Premium) has changed for 3- and 4-year-olds since the Dedicated Schools Grant was introduced in 2012–13. In cash terms (shown in green), the core funding rate is currently about 12% higher than it was a decade ago, and the impact of the Budget uplift could see that rise substantially over the coming years. But, as the real-terms series in grey shows, this cash-terms increase has not been enough to keep up with economy-wide inflation (as measured by the GDP deflator). On this measure, core funding per hour is about 11% lower now than it was a decade ago. Based on the information we have so far about the Budget uplift to spending, the core funding rate is set to return to roughly its 2012–13 level by 2024–25.
Figure 8. Core funding per hour for 3- and 4-year-olds, on different inflation measures
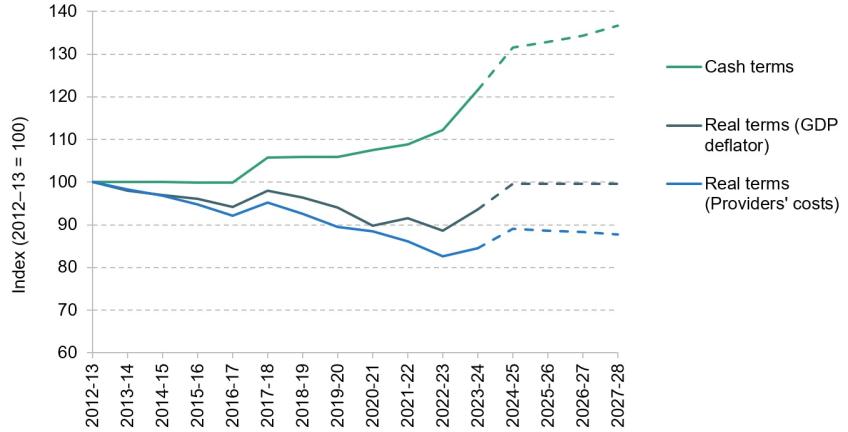
Note: Funding rates up to 2022–23 are drawn from the Early Years block of the Dedicated Schools Grant. In 2023–24, funding rates mid-way through the financial year, in September; the chart presents weighted averages of the April–August and September–March rates. For 2-year-olds, the funding rate for 2024–25 has been announced as £8.17 in cash terms. We combine this with information on populations and predicted part-time equivalent places to estimate the funding rate for 3- and 4-year-olds, based on the total budget uplift announced at the March 2023 Budget. For 2025–26 onwards, we use estimates of the total free entitlement budget for each stage combined with estimated part-time equivalent places to model how core funding could evolve.
But this measure is based on economy-wide inflation. Childcare providers face significantly different costs to the economy as a whole; in particular, around three-quarters of their expenses are for staff costs (Drayton and Farquharson, 2022). The sector has been disproportionately affected by the rapidly rising minimum wage, which has increased by 54% over the last decade.
When providers’ specific costs are taken into account, core funding per hour this year is more than 17% lower than a decade ago. Even the uplift from the Budget is unlikely to see resources per hour restored to anything like their previous level: on our estimates, core resources per hour in 2024–25 will remain more than 10% lower than in 2012–13.
The rate for 2-year-olds has fallen less steeply, from £6.28 in 2015–16 to £5.92 last year in today’s prices. Two-year-olds are also in line for a much bigger increase in funding rates from September 2023: the core funding rate has been increased to £7.95 for the remainder of this financial year, rising to £8.17 (in cash terms) in 2024–25. This will leave core resources per hour comfortably above their 2015 level, even taking providers’ cost pressures into account. Indeed, on this metric, core resources per hour will be nearly £1 an hour higher than they were at their peak in 2017–18.
5. Impact of the Budget reforms
So far, we have focused largely on the impact of the March 2023 Budget reforms on spending on the free entitlement.1 Overall spending is set to double between now and 2027–28, with a substantial increase in core funding per hour for 2-year-olds (plus a much smaller increase for 3- and 4-year-olds). This is a huge injection of resources into the early years system.
But while the early years has clearly been prioritised relative to most other areas of public spending, significant challenges still remain with the design, distribution and deliverability of the new entitlements.
Design issues
A fundamental challenge for early years systems is to define their main aims: are they principally concerned with supporting children’s early development and reducing socio-economic inequalities, or with helping parents to work and reducing the motherhood penalty in the labour market?
The Budget reforms unambiguously prioritise the latter aim over the former. Like the current 30-hour offer, the new entitlements will only be available to children in ‘working’ families. By definition, this means that children in the poorest families – whose parents are not working, or earning enough to be eligible – will not receive these hours. Many 2-year-olds will still get a part-time place through the disadvantaged entitlement, but younger children in non-working families will continue not to have access to a funded childcare place.
Despite their clear focus on helping parents to work, the bulk of what the new entitlements will do is shift who is paying for care. The Office for Budget Responsibility estimates that the new entitlements will draw the equivalent of another 65,000 parents into full-time work. Setting this against existing childcare use among 1- and 2-year-olds, we estimate that around five-sixths of spending on the new entitlements will go on paying for the childcare that parents are already using.
The new entitlements also have a range of design issues that will limit their ability to support parents into work. First, they will not cover parents who are in education, training or looking for work – making it more difficult for parents looking to upgrade their qualifications.
And, while the administration of the entitlements is not yet clear, if they are subject to a similar waiting period as the current 30-hour offer, parents could have to apply four to ten weeks before the start of term. This could conceivably see eligible working parents waiting several months before their entitlement kicks in, undermining the Chancellor’s stated aim of providing a seamless service from the end of parental leave until the start of school.
Finally, the design of the system withdraws access to the free hours (as well as to tax-free childcare) from families where any parent earns more than £100,000 a year. The abrupt withdrawal of government help with childcare costs leads to an absurd situation where many families earning close to the threshold will be worse off if they take a pay rise that puts them over the ceiling. Figure 9 shows an illustrative scenario for a parent with two children under the age of 3, paying average childcare prices for 40 hours of care per week. Once childcare expenses are taken into account, this parent would be financially better off earning £99,999 than earning £134,500. For a policy targeted at increasing labour supply and earnings, this creates an enormous perverse incentive for higher-earning parents.
Figure 9. Average post-tax earnings for a parent with two young children using 40 hours a week of childcare
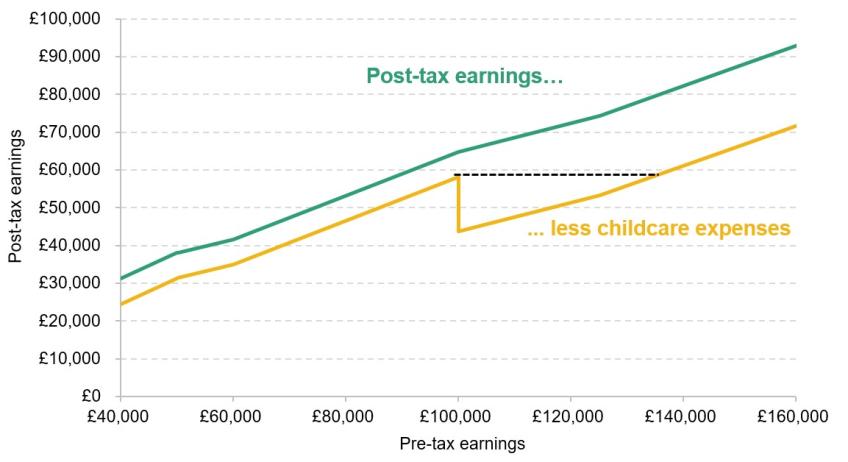
Note: Example is for a parent with two children under 3. A second parent, if present, must be working and earning less than £100,000, though we focus only on the income of the focal parent. Assumes mean hourly childcare prices from the 2022 Survey of Childcare and Early Years Providers (Department for Education, 2022).
Source: Farquharson (2023).
Distributional consequences
Restricting the new entitlements to families where all parents are in paid work significantly changes the shape of the early years system.
Overall, we estimate that just over half of families with a child aged nine months to two years will directly benefit from the Budget entitlements. But this differs dramatically across the income distribution: based on patterns of childcare use in 2019, it includes just a fifth of families earning less than £20,000 a year, but four-fifths of those with household incomes above £45,000 (Drayton et al., 2023). As higher-income households tend to use more hours of formal childcare and to live in more expensive parts of the country, they stand to gain financially to an even greater extent than other eligible families (Farquharson and Olorenshaw, 2022).
Larger benefits for higher-earning families are not necessarily concerning in and of themselves: after all, higher-earning families tend to have the highest childcare costs. But to the extent that the new entitlements support children’s development as well as their parents’ work, they could widen inequalities in children’s development in the earliest years of life.
The academic research is conflicted on what impacts these entitlements might have on children. There is solid evidence that formal childcare in the early years can support children’s development, usually with larger benefits for the most disadvantaged. However, the impact depends crucially on the ‘counterfactual’: what care children would have received had the childcare offer not been available.
Previous research in England found that the original, part-time entitlement for 3- and 4-year-olds had only limited benefits for child development which quickly faded out (Blanden et al., 2016). One reason for these fairly muted results was that many of the children who took up the original free entitlement would otherwise still have used formal childcare, just paid for by their parents. So, while take-up of the policy was extremely high, the share of children whose circumstances were substantially changed was much lower, limiting the scope for impact. As discussed in the previous subsection, we expect a similar situation with the new entitlements: the vast majority of the spending will support children who would already have been using formal childcare, making it more difficult to demonstrate an overall impact on child development.
A related question is the quality of the care on offer for children who do start to use the new entitlements. For supporting children’s development, the academic research is clear that the quality of care on offer is paramount. The challenge here is that our understanding of how government can best measure quality is still quite limited. Funding is clearly a large, though not the only, part of delivering high-quality care. There is more dispute over the impact of other aspects of care that the government can easily measure, such as the share of workers in a setting that are qualified to degree level.
Deliverability
The final challenge to the new entitlements is whether and how they will be deliverable. We estimate that, once the new entitlements are fully rolled out, the government will directly control the price of around 80% of pre-school childcare in England – up from 50% today (Drayton et al., 2023).
With that much weight in the market, there are significant risks to getting the funding rate wrong. If the rate is set too high (and without adequate regulation or a functioning market), there is a risk that public money that might have been spent elsewhere is instead turned into excess profits.
On the other hand, a funding rate that is too low will not be attractive to providers. They may choose to opt out of offering the new entitlements. And, if they are already reliant on privately paid hours for younger children to subsidise delivery of existing entitlements, they may also drop out of offering the entitlements for older children once the options for cross-subsidisation dry up.
The government seems to have recognised the risks here. In addition to budgeting for a much higher funding rate for 2-year-olds, the government has said that rates for the under-2s will start at £11.06 in 2024–25. As Figure 10 shows, both of these rates are well above the current market price for childcare.
Figure 10. Proposed free entitlement funding rates in comparison to market prices (2023–24 prices)
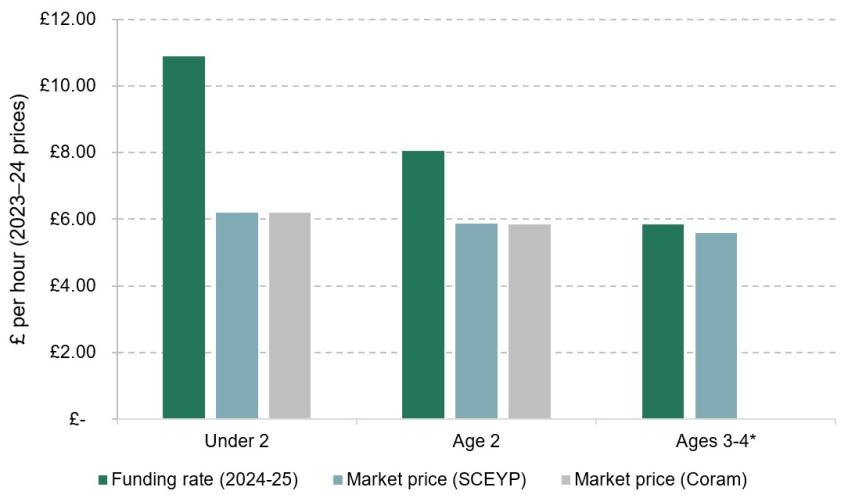
Note: Market prices are shown from two sources, the Department for Education 2022 Survey of Childcare and Early Years Providers and the Childcare Survey 2023 from Coram Family and Childcare. Funding rate for under-2s and 2-year-olds is based on the Department for Education (2023) announcement of average funding rate in 2024–25. * Funding rate for 3- and 4-year-olds is based on IFS modelling.
Source: Department for Education (2022) and Jarvie et al. (2023).
For 3- and 4-year-olds, the funding rate is much closer to existing market prices. This is a riskier position to be in: while the funding rate, on average, is similar to the market price, there is less margin for error. That could mean challenges with delivery or providers’ financial sustainability in particular areas where the funding rate and providers’ costs get out of alignment. However, the relatively generous settlement for younger children could conceivably mean that providers are able to (continue to) cross-subsidise, supplementing their funding for 3- and 4-year-olds with their earnings from younger children.
While the government’s plans look to have headed off the challenge of inadequate funding (at least for younger children), the bigger picture – and the bigger challenge – is how these rates are set and revised going forward. In Section 2, we explored how funding rates have been set over the last two decades for existing entitlements. Quite often, funding is set and then frozen in cash terms for several years, while inflation eats away at its value, before a big adjustment at a Spending Review or other fiscal event.
This ad hoc process has always put providers’ finances under unnecessary strain from uncertainty and stealthy year-on-year cuts to their effective resources. But with the free entitlement set to make up the vast majority of the childcare market going forward, it is now more urgent than ever to tighten up the process for reviewing the impact of funding rates and revising them in a consistent, predictable way. The risks to carrying on with the usual model are now much higher.
6. Conclusions
Successive increases in spending on the early years, and the most recent genuinely big commitments at the March 2023 Budget, have made it clear that the early years is increasingly seen as a priority for politicians. But while new resources will certainly enable the sector to do more, these reforms also bring huge challenges.
In recent years, almost all of the increase in free entitlement spending has been driven by increasing the generosity of the entitlements on offer. Spending per hour, by contrast, has been squeezed: core funding per hour for 2-year-olds was no higher in 2022–23 than it was when the 40% entitlement was introduced in 2015; 3- and 4-year-olds have fared even worse, with spending per hour at its lowest point since 2013–14. The figures look even more stark once childcare providers’ costs have been factored in.
The new money announced in the Budget for uplifts to funding rates will help to reverse some of these pressures, at least for the youngest children. Funding rates for 2-year-olds rose from an average of £6.00 an hour to £7.95 this month, and are set to rise again to £8.17 in 2024–25. For the youngest children (under-2s), the initial funding rate will be set at £11.06. Both of these rates are significantly higher than the market prices currently being charged for care at these ages.
By contrast, the proposed settlement is significantly less generous for 3- and 4-year-olds. The Budget uplift could be enough to restore rates to their 2012–13 level in real terms by 2024–25, but this still represents more than a decade with no real-terms increase. Over this period, the national minimum wage has risen quickly, adding pressure to providers’ finances; once these costs are factored in, core funding per hour for 3- and 4-year-olds is set to remain more than 10% below its 2012–13 levels in 2024–25.
These funding pressures are only part of the challenge that the early years sector will face over the coming years. Providers will need to prepare for a period of rapidly falling numbers of 3- and 4-year-olds alongside increased demand from younger children newly entitled to a funded place. Local authorities will need to carefully monitor sufficiency and access, to guard against any pockets with a lack of provision. And central government will need to consider carefully whether the Budget promises, as designed, will be enough to offer parents a smooth journey through the childcare system – and what, if anything, they want the system to deliver for poorer children.
Endnotes
Authors

Elaine Drayton
Elaine joined the IFS in 2020 and works in the Education and Skills sector.

Christine Farquharson
Christine's research examines inequalities in children's education and health, especially in the early education and childcare sector.
More from IFS
Understand this issue


Policy analysis


Academic research


