
Downloads
Download report PDF
PDF | 1.1 MB
Key findings
1. Between 1993 and 2022, employment in traditionally middle-paying occupations fell by 12% nationally, whilst employment in low- and high-paying occupations grew by 14% and 95%, respectively. This ‘hollowing out’ has had profound implications for the geography of jobs, and the opportunities available to workers with different educational backgrounds in different parts of the country.
2. The decline in manufacturing jobs that provided those without university degrees a route to well-paid work mainly affected the North and Midlands. For example, in Cheshire, the number of people in occupations previously in the middle of the pay distribution fell by a third over the last three decades.
3. The occupations that have seen the most growth since 1993 are either in low-paid services such as social care, childcare and hospitality, or in high-paid services such as IT, business and finance. But whilst low-paid service sector jobs have emerged everywhere, the new ‘high-end’ jobs are found mainly in London and other cities. In Inner London, the number of people in high-paying occupations has increased threefold since 1993.
4. There is a strong correlation between the size of the local labour market and the concentration of new high-skilled services. This is not just driven by London and the South: cities such as Birmingham, Manchester and Leeds also have relatively high concentrations of these jobs, though less so than Southern cities of comparable size.
5. Higher education participation has expanded evenly across the country, but graduate jobs have become more concentrated in London. In ex-industrial regions such as Lincolnshire and Cumbria, fewer than half of all graduates who are in work are in a job that requires a degree, compared to two-thirds (65%) of graduates in Inner London. The share of graduates working in graduate jobs has increased slightly in Inner London (up from 61% in 1993) whilst falling nearly everywhere else, which is consistent with other research on the graduate wage premium falling outside London (Stansbury, Turner and Balls, 2023).
6. Another important labour market trend in recent years is the outsourcing of low-paid work to specialised agencies. Cleaners, security guards and kitchen staff are increasingly subcontracted to firms specialising in these services rather than employed in-house. In 2011, 22% of workers in ‘elementary’ occupations were in ‘occupationally segregated’ workplaces where elementary occupations made up over 85% of all employees, compared to 11% in 1998. The prevalence of agency work has continued to rise since 2011.
7. Despite the higher concentration of high-skilled workers in London, workers in elementary occupations in London are less likely to work alongside high-skilled workers. In 2011, 58% of elementary workers in London were in ‘occupationally segregated’ workplaces, compared to 18% in other regions. This may reflect that, while London’s population density allows high-skilled workers to cluster together in a world-leading professional services hub, it also makes it possible to outsource low-skilled workers to specialist agencies, potentially limiting their career progression.
8. Taken together, this suggests that the group most negatively affected by patterns of occupational change in recent decades may not be low-skilled workers outside London, but rather graduates from poorer family backgrounds who are unable to fully capitalise on their education due to the costs of moving and the lack of graduate jobs where they live.
1. Introduction
The last few decades have seen profound changes in the labour market, including the ‘hollowing out’ of occupations in the middle of the pay distribution, rising demand for high-skilled workers, an expansion of higher education and an increase in both domestic and offshore outsourcing. In their chapter on labour market inequalities for the IFS Deaton Review of Inequalities, Giupponi and Machin (2022) argue that these changes are crucial to understanding inequalities in the world of work, including the rise in earnings inequality since the 1980s.
These long-term trends in the labour market have also had important implications for geographical inequalities, which have seen a revival of interest in recent years in both academic and policy circles. This report examines the way in which ‘hollowing out’ and other labour market trends have played out geographically, shaping the economic geography of the UK today and the opportunities facing people with different educational backgrounds in different places. It builds on recent work on the nature and origins of geographical inequalities in the UK, in particular the chapter by Overman and Xu (2022) for the IFS Deaton Review on geographical disparities across labour markets, and Stansbury et al. (2023).
The report is structured as follows. Chapter 2 documents the way in which occupational polarisation at the national level has affected different parts of the country, with ‘traditional’ jobs disappearing from the North and Midlands, low-skilled service sector jobs emerging everywhere and new high-end jobs in professional services mainly confined to London and other big cities. Chapter 3 looks at the expansion of higher education across places and argue that the supply of graduates appears to have outstripped demand outside London. Chapter 4 examines the rise in the outsourcing of low-paid work to specialised agencies, showing how the agglomeration that benefits high-skilled workers in London and other cities may hurt low-skilled workers by making it easier to outsource. Chapter 5 concludes by discussing what these long-term shifts in the labour market have meant for different kinds of people across the country.
2. Occupational polarisation
2.1 The national picture: 'hollowing out' of middle-paid jobs
A key feature of the labour market in recent decades is the ‘hollowing out’ of the occupational structure, defined by a fall in employment in middle-paying occupations, and smaller falls or increases at the top and bottom. This phenomenon was first documented by Goos and Manning (2007) using data from 1979 to 1999. Technological advances complemented the skills of high-paid workers, pushing up labour demand at the top, whilst making it possible to automate or offshore manufacturing and secretarial jobs in the middle of the pay distribution (Autor, Levy and Murnane, 2003).
Figure 1 shows that the hollowing out of middle-paid jobs continued over the last three decades, between 1993 and 2022, though there has been more occupational ‘upgrading’ than in previous decades (Cominetti et al., 2022). Occupations are grouped into wage deciles based on their median wage in 1997, the earliest year for which representative hourly wage data are available.1
The green bars show percentage changes in employment shares, following Goos and Manning (2007), and the yellow bars show percentage changes in the total number of workers. In both cases, the J-shaped pattern is clear: employment in middle-paid occupations fell, both in absolute terms (green bars) and as a share of total employment (yellow bars), and increased in high-paid occupations.
2.2 How has occupational polarisation played out geographically?
This process did not unfold evenly across places. The disappearance of traditionally middle-paid jobs affected many parts of the country, but the impact was particularly stark in the North and Midlands, places that were heavily reliant on manufacturing. Meanwhile, many of the new high-paid jobs that emerged were concentrated in London and the South East. Hollowing out at a national level therefore had profound implications for the geography of jobs, and the opportunities available to workers with different educational backgrounds in different places.
The broad-brush effect is shown in Figure 2, which plots percentage changes in total employment in low-, middle- and high-paid occupations (defined as wage deciles 1–3, 4–6 and 7–10, respectively) across NUTS2 regions since 1993.2 Many parts of the North of England and the West Midlands saw big falls in middle-paid jobs, but smaller increases in high-paid jobs than other parts of the country. For example, the number of middle-paid jobs in Cheshire fell by nearly a third between 1993 and 2022 (32% compared to a nationwide fall of 12%), but whilst the number of high-paid jobs grew by 95% across the UK, the increase in Cheshire was just 41%. A few urban areas stand out: in Merseyside, Greater Manchester, South Yorkshire and West Midlands county (home to Liverpool, Manchester, Sheffield and Birmingham, respectively), the fall in middle-paid jobs coincided with a relatively large rise in high-paid jobs. This is also true of Outer London, where middle-paid industrial jobs gave way to high-paid jobs in finance and professional services. The biggest increase in high-paid jobs was seen in Inner London, where employment in high-paid jobs rose by 240% over this period.
2.3 Where did opportunities decline and emerge, and for whom?
We can look more closely at the geographical implications of occupational change, and their effects on workers of different skill levels, by looking at the specific occupations that have declined or grown since 1993. Table 1 lists the 10 occupation groups that have seen the biggest falls in total employment between 1993 and 2022. The analysis is conducted at the level of occupation groups (three-digit SOC codes) and total employment changes (rather than percentages) to avoid results being driven by very small occupations which could result from sampling error.
Table 1. Top 10 occupation groups with biggest fall in employment, 1997–2022
| Occupation group (three-digit SOC) | Employment in 1993 | Employment in 2022 | Wage decile in 1997 | Wage decile in 2022 |
|---|---|---|---|---|
| Secretarial and related occupations | 1,049,801 | 515,760 | 4 | 3 |
| Elementary cleaning occupations | 799,466 | 456,821 | 1 | 1 |
| Assemblers and routine operatives | 515,168 | 176,500 | 3 | 3 |
| Metal machining, fitting and instrument making trades | 458,097 | 200,359 | 6 | 6 |
| Plant and machine operatives | 312,358 | 122,879 | 5 | 4 |
| Process operatives | 432,825 | 244,670 | 4 | 3 |
| Metal forming, welding and related trades | 168,901 | 61,642 | 5 | 5 |
| Printing trades | 132,455 | 25,905 | 6 | 3 |
| Elementary agricultural occupations | 147,241 | 52,252 | 2 | 1 |
| Textiles and garments trades | 92,993 | 40,075 | 3 | 2 |
Note: Working-age (18–64) population only. Wage bins based on deciles of median hourly wage in occupation (four-digit SOC code) in 1997 and 2022, respectively.
Source: LFS Q1–Q4 1993; APS 2022; ASHE 1997 and 2022.
These declining occupation groups tended to be low- or middle-paid in 1997, and the jobs that remain tend to be worse-paid today than they were in 1997, relative to other jobs in the economy. They mainly consist of manufacturing jobs that disappeared as the country deindustrialised, but also include automatable service jobs (such as secretaries and typists) and jobs in agriculture and cleaning. None of the jobs in these occupation groups requires a graduate degree, according to the Regulatory Qualifications Framework (RQF).3
Figure 3 plots the concentration of declining occupations in 1993 across NUTS2 regions, measured by the location quotient – the region’s share of declining occupations relative to its share of all occupations. It shows that the jobs that saw the biggest declines since 1993 were disproportionately concentrated in the Midlands, Wales and parts of the North. It is in these places that the disappearance of ‘traditional’ jobs, which provided workers without university education a route to reasonably well-paid work, was most acutely felt.
Conversely, the occupation groups that have seen the biggest increase in employment since 1993 are listed in Table 2. We can clearly see the transition to a service economy over the last three decades, as well as the pattern of polarisation: these growing occupations consist of either very high-paid professional service jobs in business and finance, IT, teaching and health, or very low-paid service jobs in social care, childcare and hospitality (‘Other elementary services occupations’ are mostly waiters, kitchen and catering assistants, and bar staff).
Table 2. Top 10 occupation groups with biggest increase in employment, 1997 to 2022
| Occupation group (three-digit SOC) | Employment in 1993 | Employment in 2022 | Wage decile in 1997 | Wage decile in 2022 |
|---|---|---|---|---|
| Information technology and telecommunications professionals | 275,636 | 1,447,519 | 9 | 9 |
| Information technology and telecommunications professionals | 342,338 | 1,034,069 | 10 | 10 |
| Caring personal services | 646,856 | 1,288,117 | 2 | 2 |
| Business, research and administrative professionals | 373,744 | 943,760 | 9 | 9 |
| Teaching and educational professionals | 973,093 | 1,540,469 | 10 | 10 |
| Business, finance and related associate professionals | 354,978 | 875,762 | 10 | 8 |
| Childcare and related personal services | 264,291 | 749,729 | 1 | 1 |
| Health professionals | 199,146 | 645,634 | 10 | 10 |
| Sales, marketing and related associate professionals | 630,376 | 990,339 | 9 | 8 |
| Other elementary services occupations | 601,709 | 812,473 | 1 | 1 |
Note: Working-age (18–64) population only. Wage bins based on deciles of median hourly wage in occupation (four-digit SOC code) in 1997 and 2022, respectively.
Source: LFS Q1–Q4 1993; APS 2022; ASHE 1997 and 2022.
Overall, the occupations that have grown most since 1993 are somewhat concentrated in and around London, as shown in the first panel of Figure 4. But there is a big difference when we distinguish between emerging jobs that require high skills and those that do not. Emerging jobs that are high-paid tend to require a graduate degree, and are overwhelmingly concentrated in London and surrounding areas (note that regions are based on place of residence, so those living near London, for example in Surrey, could also work in London). Of the jobs in the top 10 occupation groups that require a degree, 22% are in London, which accounts for 15% of all jobs nationally. In contrast, growing jobs that are low-paid and do not require a degree – for example care workers, nursing assistants, kitchen and catering assistants, and waiters and bar staff – can be found all across the country.
This means that in many parts of the country, the loss of middle-paid jobs for workers without university education has meant a shift to low-paid service jobs. Graduates in and around London benefited from the expansion of high-paid professional services, but graduates in other parts of the country were less likely to reap the rewards of the move to a service economy.
2.4 The growing importance of cities
Another feature of occupational change in recent decades has been the concentration of well-paid jobs in urban areas. The growing occupations that are high-paid and high-skilled tend to be based in big cities, in contrast to the occupations that have declined since 1993. In 1993, the regions that specialised in the occupations that have since declined were a mix of sizes – some relatively small NUTS2 regions, such as Lincolnshire and Cumbria, were highly specialised in these jobs.
There is also no correlation between region size and the low-skilled occupations that have since emerged, as shown in the right panel of Figure 5, which plots the concentration of emerging occupations in 2022 travel to work areas (TTWAs) – approximations of local labour markets constructed based on commuting flows. But there is a clear positive relationship between region size and the concentration of growing occupations that require a degree: high-skilled services benefit strongly from agglomeration, and tend to cluster in large cities (Abel, Dey and Gabe, 2012). This is not just driven by London and the South: large cities such as Birmingham, Manchester and Leeds also have relatively high concentrations of high-skilled growing occupations, though less so than Southern cities of comparable size.
3. The expansion of higher education
3.1 Changes in graduate shares
The changes in the occupational structure in recent decades have coincided with a rapid expansion of higher education. Indeed, some have suggested that the increase in the supply of graduates is an important driver of occupational polarisation in the UK, alongside technological developments (Salvatori, 2018). The share of workers aged 18–64 with a degree has increased from 13% in 1993 to 42% in 2022. This increase has taken place all around the country, as shown in Figure 6.
3.2 The concentration of graduate jobs
As a result, the distribution of graduate workers across regions has remained roughly the same over the last three decades. This is shown in the left panel of Figure 7, which plots the share of all UK graduates who are in work living in each region in 1993 and 2022. However, whilst graduate numbers have increased across the country, graduate jobs (based on the RQF) have become much more concentrated in London, particularly in Inner London, as shown in the right panel of Figure 7.4
This means that graduates in London have benefited much more from the expansion of high-skilled jobs than graduates in other parts of the country. Figure 8 shows that in Inner London, around two-thirds (65%) of in-work graduates work in a job that requires a degree. This figure is much lower in other parts of the country, especially in some ex-industrial regions such as Lincolnshire and Cumbria, where fewer than half of graduates who are in work are in a graduate job (42% and 49%, respectively).
The share of graduates working in graduate jobs has increased slightly in Inner London over the past three decades, up from 61% in 1993, whilst staying constant or falling virtually everywhere else.5 For example, in 1993, 62% of graduates in Lincolnshire who were in work, and 64% of those in Cumbria, worked in a job that required a degree. Indeed, some of the places that have seen the biggest increases in their graduate share between 1993 and 2022, in percentage terms, have seen the biggest falls in the share of graduates doing graduate jobs. This suggests that the supply of graduates has outstripped demand in many places, consistent with the finding in Stansbury et al. (2023) that the graduate wage premium has fallen in all regions outside London.
For graduates, moving to London and the South therefore gives you a much better chance of accessing the high-skilled jobs that have emerged over the last 30 years; hence the large-scale migration of graduates from ‘left-behind’ areas to London and other economically successful Southern cities. However, as shown in Britton et al. (2021), this route is predominantly open to those from wealthier family backgrounds. Graduates from the lowest quintile of the socio-economic gradient do not disproportionately move to London, and are therefore unlikely to fully reap the returns to their education.
4. Occupational segregation
4.1 The national picture: occupational segregation across firms
Another important labour market trend in recent years is the outsourcing of low-paid work to specialised agencies. Cleaners, security guards and kitchen staff are increasingly subcontracted to firms specialising in these services rather than employed in-house, which means that workers in low- and high-paid occupations are increasingly segregated in different firms. Evidence shows that the outsourcing of low-paid workers to agencies depresses their wages (Dube and Kaplan, 2010; Goldschmidt and Schmieder, 2017; Dorn, Schmieder and Spletzer, 2018), and could also hinder their career progression as they are less able to move up the job ladder in the firm they work for. For example, Aghion et al. (2023) show that low-skilled workers with social skills see faster wage progression when they work alongside higher-skilled workers.
The rise in the outsourcing of low-paid occupations, and the resulting rise in occupational segregation across firms, is well documented in other developed countries such as Germany and the US; see, for example, Card, Heining and Kline (2013), Dube and Kaplan (2010), Goldschmidt and Schmieder (2017) and Handwerker (2023). There has also been a rise in industries associated with outsourcing across all OECD countries (Bergeaud et al., 2021). In the UK, direct evidence on trends in the segregation of low-paid occupations is scarce because of data constraints, in particular the lack of data on firms’ occupational structures.
I use three data sources to document trends in occupational segregation for low-paid jobs since the 1990s. To capture changes between 1998 and 2011, I rely on the Workplace Employment Relations Survey (WERS), which captures the split of workers in a workplace across broad occupation groups (one-digit SOC codes).6 If low-skilled workers are outsourced, then we would expect them to work in places with mostly other low-skilled workers, and few high-skilled workers. From 2011 onwards, I use the Labour Force Survey (LFS) to track the share of workers in low-paid occupations who report being employed through an employment agency (see Clarke and Cominetti, 2019). I cross-check trends from the LFS using data on firms’ spending on agency workers, as a share of total labour costs, from the Annual Business Survey (ABS). The advantage of this dataset over the LFS is that it is not affected by workers’ perceptions of their own employment arrangements, which could change at a time when awareness of alternative work arrangements was increasing (ONS, 2017). The disadvantage is that we cannot specifically identify the outsourcing of low-paid workers, as opposed to workers in higher-paid occupations.
Figure 9 plots four measures of the extent to which workers in the lowest-paid occupations – defined as ‘elementary’ occupations including cleaners, warehouse staff and low-skilled catering and hospitality workers – work in different places from ‘managerial’ and ‘professional’ occupations. For brevity, I refer to workers in elementary occupations as ‘low-skilled’ and those in managerial and professional occupations as ‘high-skilled’, following the ONS’s occupation-based skill levels (ONS, 2023). We see that the average share of high-skilled workers in the workplaces of low-skilled workers, and the share of low-skilled workers in a workplace where more than a quarter of all workers are high-skilled, are both higher in 2011 than in 1998, reflecting the expansion of high-skilled jobs over this period. However, the share of low-skilled workers in occupationally segregated workplaces also increased over this period. Notably, the share of low-skilled workers who work in a place where over 85% of workers are low-skilled nearly doubled, from 12% in 1998 to 22% in 2011.
The latest instalment of the WERS was in 2011. From 2011 onwards, a question on agency work was asked of employees on permanent contracts in the LFS. Figure 10 shows that the share of outsourced low-skilled workers continued to increase between 2011 and 2023, rising from 2.4% to 4.0% – an increase of nearly 70%. Figure 11 shows that firms’ average spend on agency workers, as a share of total labour costs, also increased by 0.6 percentage points between 2012 and 2019. This analysis follows the same firms over time (that is, it controls for firm fixed effects) to take account of changes to the ABS sampling framework in 2016.7 Taken together, this suggests a general increase in the outsourcing of low-skilled workers into specialised agencies since the late 1990s, consistent with trends in other developed countries.
Figure 11. Firms’ spending on employment agencies as a percentage of total labour costs relative to 2015, 2012–19
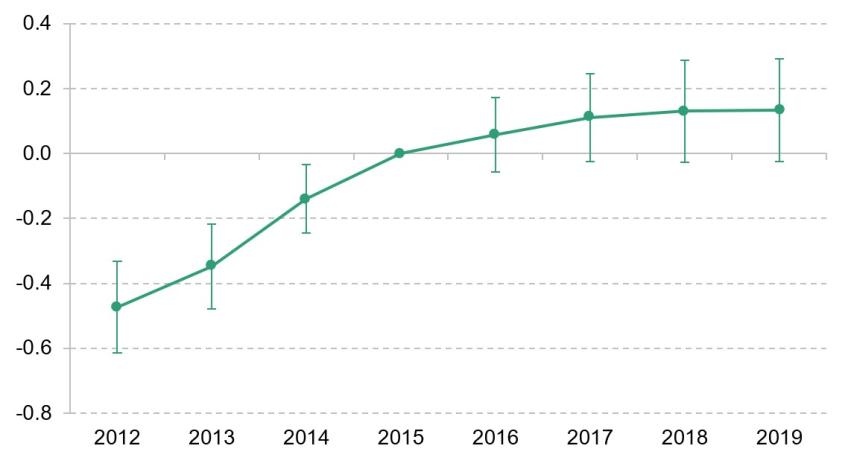
Note: Shows regression coefficients on year fixed effects, relative to 2015, controlling for firm fixed effects. Outcome variable is spending on employment agencies as a percentage of total labour costs, defined as the sum of the total wage bill, spending on agencies and spending on independent subcontractors. Error bars show 95% confidence intervals.
Source: ABS 2012–19.
4.2 Low-skilled workers in London face higher occupational segregation
As we saw in Chapters 2 and 3, the high-paid service occupations that have grown in recent decades are overwhelmingly concentrated in London. As such, one might expect low-skilled workers to be more likely to work alongside high-skilled workers in London and to benefit from that interaction. However, the opposite is the case: low-skilled workers in London are more occupationally segregated than in other parts of the country – as discussed later, this is likely to reflect the higher population density in London, which makes specialised agencies viable.
Table 3 shows that despite the shift towards professional occupations, elementary workers in London were less likely to work alongside managerial and professional occupations in 2011 than in 1993, in contrast to other parts of the country. The average share of high-skilled workers in the workplaces of low-skilled Londoners fell from 16% in 1993 to 13% in 2011, and the share of low-skilled Londoners working in a place where at least a quarter of employees were high-skilled fell from 22% to 15%. The increase in occupational homogeneity was also more pronounced in London: the share of low-skilled Londoners in a workplace where over 85% of employees were also in elementary occupations rose from 30% to 58%, compared to a rise from 11% to 18% in other regions.
Table 3. Occupational segregation of workers in low-skilled occupations by region, 1993 and 2011
| London | Other regions | |||
|---|---|---|---|---|
| 1998 | 2011 | 1998 | 2011 | |
| Average share of high-skilled workers | 16% | 12% | 17% | 26% |
| In workplace with ≥25% high-skilled workers | 22% | 15% | 20% | 60% |
| Average share of low-skilled workers | 46% | 66% | 30% | 40% |
| In workplace with ≥85% low-skilled workers | 30% | 58% | 11% | 18% |
Note: Working-age (18–64) population only. Low-skilled occupations defined as elementary occupations. Averages refer to means.
Source: WERS 1993 and 2011.
More recent data from the LFS and ABS also suggest that low-skilled workers are more likely to be occupationally segregated in London. Figure 12 shows that across all broad occupation groups, employees in London were more likely to be agency workers in 2022 and 2023, but this is especially true of those in elementary occupations and in caring and leisure occupations (a group that mainly consists of social carers, nursing assistants and teaching assistants). Pooling ABS data from 2017 to 2019 and controlling for industry composition, spending on agency workers as a share of total labour costs was 0.08 percentage points higher in London than in other regions, against an overall average of 2.07%.
The higher occupational segregation of low-skilled workers in London is likely to relate to its size. As indicative evidence of this, we can look at two specific occupations that are often studied in the outsourcing literature: cleaners and security guards (Dube and Kaplan, 2010; Goldschmidt and Schmieder, 2017). Figure 13 shows that cleaners and security guards in London are more likely to work in specialised agencies providing these services – as opposed to being employed in-house – than those in the 10 next biggest cities in the UK, who in turn are more likely to work in specialised agencies than those in other parts of the country. The population density that benefits high-skilled workers in professional services (through agglomeration economies) also makes it possible to outsource low-skilled service workers to specialist agencies, which limits their exposure to higher-skilled workers and potentially restricts their career progression (Aghion et al., 2023).
5. Conclusions
Changes in the labour market in the last few decades have had profound implications for geographical inequalities. Traditional manufacturing jobs that offered less-educated workers a route to well-paid work disappeared from the North and Midlands, whilst high-skilled jobs in professional services, which benefit strongly from being clustered together spatially, mainly emerged in London. Across the country, and particularly in large cities such as London, low-paid services (such as cleaning) are increasingly outsourced to specialised agencies, with high- and low-skilled workers segregated into different firms.
Many of the inequalities in the prospects facing people with different educational backgrounds, in different parts of the country, can be traced back to these long-term labour market trends. The rapid growth of knowledge-intensive sectors benefited graduates in London, and those who could afford to move to London. Outside London and the South, and in particular in ex-industrial towns, the hollowing out of traditionally middle-paid occupations and the growth of low-skilled services have pushed workers without degrees into less desirable jobs. But prospects for low-educated workers in London are also far from rosy, in part because the agglomeration that causes high-skilled firms to cluster in London also makes it possible to outsource low-skilled work to specialised agencies. This means that the lowest-skilled workers in London are more likely to be in firms that only contain low-skilled jobs, which may restrict their opportunities to move up the career ladder.
Perhaps the group that have been most negatively affected by labour market trends in recent decades are people in economically deprived areas who have invested in higher education, but find that there are not enough graduate jobs locally, and are unable or unwilling to move to London. This group, who are disproportionately from poorer family backgrounds, are unable to fully capitalise on their education in the labour market. The current economic geography of the UK therefore presents a challenge to both social mobility and the effective use of talent across the country.
Endnotes
Authors

Xiaowei Xu
Xiaowei joined the IFS in 2018 and works in the Income, Work and Welfare sector.
More from IFS
Understand this issue


Policy analysis


Academic research


