
In 2021–22, absolute poverty was still 0.7 percentage points (479,000 people) below its pre-pandemic level.
** This is a pre-released section of our forthcoming Living Standards, Poverty and Inequality in the UK report, funded by the Joseph Rowntree Foundation **
In particular, two key policies introduced since the beginning of the pandemic bolstered the incomes of low-income households. First, a £20 a week uplift to universal credit (UC) was introduced in March 2020 – meaning that the vast majority of UC recipients saw an increase in entitlement of that amount.[1][2]This remained in place until October 2021 (covering six months of the 2021–22 financial year). Second, work allowances in UC – the earnings thresholds above which benefit entitlements are gradually reduced – were raised by £500 a year, and the rate at which benefits are reduced above this point (the ‘taper rate’) was reduced from 63% to 55%. This change took place towards the end of November 2021, so was in place for the last four months of the 2021–22 financial year.
We compare the impact of these two policies on absolute poverty using TAXBEN, the IFS tax and benefit microsimulation model. For brevity, we refer to the combined change in the UC work allowances and taper rate as the ‘taper rate reduction’. We present both the annualised impact of each policy – the effect if each policy were in place for a full year or if they were made permanent – and the impact in 2021–22, taking into account the number of months the policies were actually in place (six months in the case of the £20 uplift and four months in the case of the taper rate reduction).[3] Table 1 shows the estimated effects of the two key reforms on absolute poverty rates for various groups, against a baseline without either reform. We assume no behavioural response such as a change in labour supply or take-up of benefits.
Table 1. Effects of benefit policy reforms on absolute poverty rates
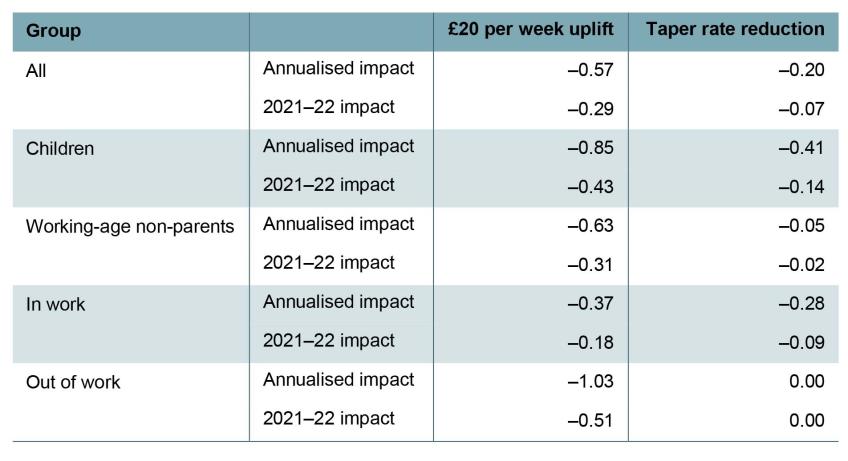
Note: Shows percentage point change in absolute poverty rate, measured after housing costs are deducted.
Source: Authors’ calculations using TAXBEN, the IFS tax and benefit microsimulation model, and Family Resources Survey 2021–22.
Given that both policies increase support for low-income families, unsurprisingly both reduce poverty. However, our analysis shows that the £20 uplift had a much larger effect on overall poverty rates than the taper rate reduction. The impact of the uplift being in place for six months of 2021–22 was to reduce absolute poverty among the whole population by 0.3 percentage points (ppts), equivalent to 0.6ppts on an annualised basis (379,000 individuals), a result that is comparable to other simulation exercises based on pre-pandemic data.[4] The taper rate reduction had a more muted effect, reducing poverty by 0.1ppts across 2021–22, equivalent to 0.2ppts (133,000 individuals) on an annualised basis.
This is partly due to who the two policies target. The taper rate reduction only benefits working households on UC, with bigger impacts for those with higher levels of earnings. These households tend to be further up the income distribution and often already above the poverty line. In contrast, the £20 uplift applied equally to all UC recipients (except those who were subject to the benefit cap) – therefore boosting incomes for those who were near the poverty line. Another reason that the £20 uplift had a bigger impact on poverty was simply that it was a larger policy, costing around £6 billion for a full year, compared with £3 billion for the taper rate reduction (HM Treasury, 2020 and 2021).[5] Nonetheless, on a per-pound basis, the uplift had a roughly 40% larger impact on poverty than the taper rate reduction.
The two policies also affect different groups quite differently. The annualised impact of the uplift on child poverty is twice that of the taper rate reduction. The poverty rate of working-age non-parents is almost entirely insensitive to the taper rate, reflecting the fact that the nature of the means-tested benefit system results in very few non-parents being entitled to benefits if they are working. Those in out-of-work families see a 1ppt fall in poverty from the uplift, and of course are not affected at all by the taper. Even for in-work families, the uplift has a bigger annualised impact on poverty than the taper rate reduction (though not on a per-pound spent basis).
These results suggest that the total impact of the two policies in 2021–22 on poverty was around 0.4ppts. They therefore explain about half the decline in overall poverty between 2019–20 and 2021–22. Looking forward, the taper rate reduction was a permanent reform, while the uplift has expired. We would therefore expect the absolute poverty rate to be 0.16ppts (106,000 people) higher in 2022–23 than in 2021–22 as a result of changes in these two policies.[6]
Footnotes
1. Those who were affected by the benefit cap could see an increase of less than £20 in UC receipt, or no increase at all.
2. Claimants of working tax credit received an equivalent increase in entitlements; for brevity, we simply refer to UC here.
3. For example, to model the annualised impact of the £20 uplift, we adjust the incomes of households sampled between October 2021 and March 2022 to remove the effect of the taper rate reduction, and add £20 a week to universal credit entitlements over this period. This is compared with a baseline where neither policy was in place, where we remove the effect of both the £20 uplift in the April–September 2021 data and the taper rate reduction in the December 2021–March 2022 data.
4. Innes (2020) finds that the uplift was responsible for keeping 500,000 people out of poverty.
5. We report the long-run cost of the changes to the UC taper rate and work allowances, in 2026–27, when UC will have been fully rolled out. £6 billion is the cost of making the £20 uplift permanent (Waters and Wernham, 2021).
6. That is: the annualised impact of the taper rate reduction on reducing poverty (0.20ppts) is 0.16ppts below the 2021–22 impact of the two policies together (0.29 + 0.07 = 0.36ppts).
Authors

Xiaowei Xu
Xiaowei joined the IFS in 2018 and works in the Income, Work and Welfare sector.

Sam Ray-Chaudhuri
Sam joined the IFS in 2022 and works as a research economist in the Income, Work and Welfare sector.

Tom Waters
Tom is an Associate Director at the IFS and Head of the Income, Work and Welfare sector.
More from IFS
Understand this issue


Policy analysis


Academic research


