
With the Chancellor set to announce the full details of the 2024 Spring Budget next week, there is much debate about fiscal trade-offs facing the government on taxation, public spending and borrowing. In this piece, we set out the current picture on school funding in England, as well as the trade-offs and challenges facing policymakers and schools.
Current picture on school funding
The core schools budget in England is set to be about £60 billion in 2024–25, which includes day-to-day or current school spending on pupils aged 5–16. Total spending is up about 11% in real terms on the level seen five years ago in 2019–20.
The government regularly makes the claim that school funding is at a record or historical high. Whilst technically true, this is not much of an achievement. Practically every government could make this claim every year back to at least 1945, if not earlier. Governments are loathe to make real-terms cuts to total school spending. Furthermore, there are now an extra 900,000 or 15% more pupils than there were in 2010. These pupils require extra teachers, extra books, extra seats, and total spending has thus gone up to meet this extra need.
How do things look in terms of spending per pupil? Figure 1 shows our estimates of the total level of school spending per pupil, relative to its level in 2009–10. Following a substantial rise over the 2000s, total school spending per pupil fell by 9% in real terms in England between 2009–10 and 2019–20. This fall in school spending per pupil represents the largest and most sustained cut in school spending per pupil in England in at least 40 years, and probably a lot longer.
Since 2019–20, we have seen rises in school spending, which is likely to lead to a 9½% real-terms increase between 2019–20 and 2024–25. If delivered, this should be sufficient to reverse past cuts and take school spending per pupil back to its last historical high in 2009–10. Technically, we therefore also expect school spending to pupil to be at an equal historical high in 2024–25. Again, however, this is not really much of an achievement. Prior to 2010, school spending per pupil was usually at a record level every year. As a society, we have generally chosen to increase real-terms spending on schools as we have seen economic growth and become richer. The fact that school spending per pupil was not at a record high between 2010 and 2023 reflects the fact that we have just seen a historically large real-terms cut in spending per pupil.
Furthermore, these trends do not account for the large drop in school capital spending, which has fallen significantly over time. Indeed, the three-year average up to 2023–24 is due to be about 26% lower in real terms than the three-year average in the late 2000s up to 2008–09.
Even more importantly, these figures calculate ‘real-terms’ changes based on economy-wide inflation as captured by the GDP deflator. This is the standard and most consistent way to examine real-terms changes in public spending. To provide further context, Figure 1 also shows expected real-terms changes in school spending per pupil when we calculate an index of actual costs faced by schools (e.g. expected changes in teacher and other staff pay per head, and rising energy, food and other non-staff costs as captured by CPI (Consumer Prices Index) inflation).
Judged against the likely costs faced by schools, we see a much smaller real-terms rise in school spending per pupil over time (only about 4% between 2019–20 and 2024–25) than when comparing against general inflation (9½%). This disconnect is particularly large in 2024–25, with school spending per pupil due to rise by 2% in real terms based on the GDP deflator and due to fall by 1% in real terms judged against our estimates of actual school costs. If delivered, these trends in spending per pupil and school costs would leave the purchasing power of school spending per pupil about 5% lower than in 2009–10.
As we have previously shown, across long periods of time and in stable economic environments, the GDP deflator tends to provide a close approximation to the costs faced by schools. Schools’ costs and the GDP deflator grew by very similar amounts between 2010 and 2019. However, we have recently seen a very big spike in inflation, much of which reflects the rising costs of imported energy and food. The GDP deflator does not fully capture import prices as it measures domestic inflation.
Figure 1. Total school spending per pupil (actual spending up to 2023–24, projected to 2024–25), 2009–10 = 1
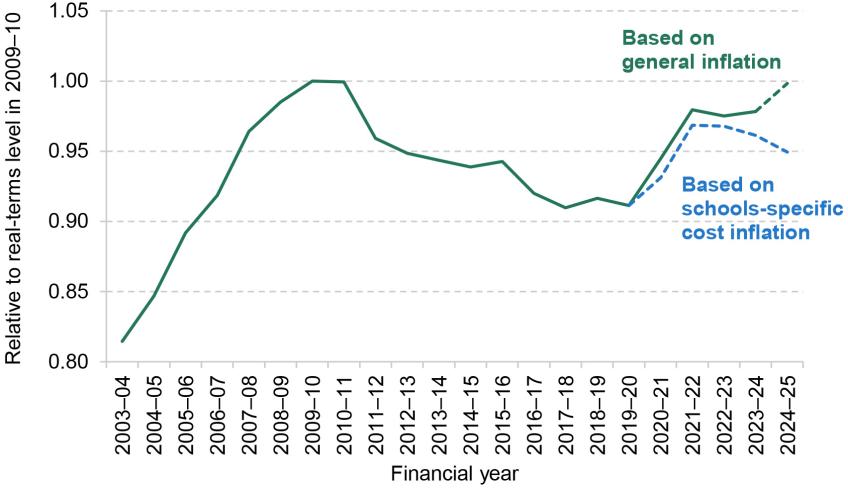
Note and source: Updated version of figure 3.2 in Drayton et al. (2023). General inflation based on HM Treasury, GDP deflators, December 2023. Schools-specific cost inflation detailed in Drayton et al. (2023), plus an additional assumption that support staff pay per head grows by 7.5% instead of 3% in 2024–25.
Rising costs faced by schools
Figure 2 directly compares growth in total school funding per pupil, growth in our estimates of school costs and the GDP deflator.
During 2020–21 and 2021–22, school funding per pupil was growing faster than total costs and the GDP deflator. This enabled the real-terms growth in spending per pupil we observe in Figure 1. This was partly made possible by freezes in public sector pay in 2021, relatively low levels of overall inflation during the pandemic and the fact that schools were fully compensated for increases in teacher pension costs in 2020–21.
Figure 2. Estimated growth in school costs and funding over time, alongside GDP deflator
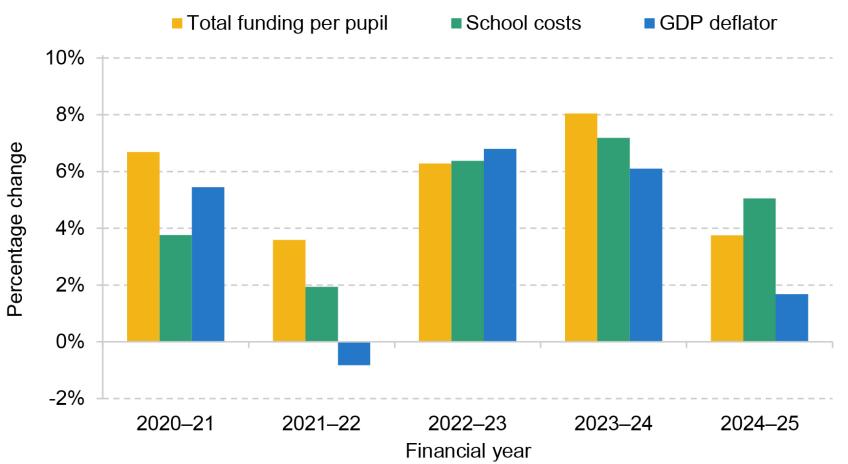
Note and source: Figure for cash-terms funding per pupil taken from Drayton et al. (2023). GDP deflator taken from HM Treasury, GDP deflators, December 2023. Schools-specific cost index detailed in Drayton et al. (2023), plus an additional assumption that support staff pay per head grows by 7.5% instead of 3% in 2024–25.
From 2022–23 onwards, we see much faster growth in school costs. Teacher pay per head started to increase faster as an average pay award of 5.4% was implemented from September 2022 (following on from a freeze in September 2021). However, there were even bigger increases in other staff pay per head (8.5%) and in non-staff costs (10%). The increases in other staff costs reflected large increases in local government pay levels in order to keep pace with increases in the National Living Wage. The growth in non-staff costs reflects the surge in inflation, particularly food and energy costs. In overall terms in 2022–23, the growth in total funding per pupil (6.3%) came very close to matching the growth in school costs (6.4%), which was in turn quite similar to the GDP deflator.
In 2023–24, we saw continued fast growth in school costs. Average teacher pay per head grew by 6%, other staff pay per head grew by over 8% (again reflecting large increases in the National Living Wage) and non-staff costs grew by 6%. However, funding per pupil grew by 8.0% in 2023–24, which was just about sufficient, on average, to compensate schools for cost rises of 7.2%. The GDP deflator grew by the lower amount of 6.1% in 2023–24, which is why we see faster real-terms growth judged against general inflation in Figure 1.
For 2024–25, the GDP deflator is currently forecast to be 1.7%. With funding per pupil due to grow by 3.8%, this equates to real-terms growth in school funding per pupil of about 2% and allows spending per pupil to return to 2009–10 levels by 2024–25, as shown in Figure 1. However, our analysis suggests that school costs are actually likely to grow by 5%, outpacing funding growth and driving a 1% cut in the purchasing power of school budgets.
Our projection for a 5% increase in school costs in 2024–25 is based on a range of assumptions. We assume teacher pay per head grows by 4.5% in the 2024–25 financial year. This first reflects the 6.5% pay award in September 2023, which spills over into the first five months of the 2024–25 financial year starting in April 2024. Second, we assume a teacher pay award of 3%. The Office for Budget Responsibility (OBR) forecasts that CPI inflation and average earnings will both grow by 3% in 2024–25, there are already significant problems recruiting and retaining teachers, and the government has ambitions to recruit more maths teachers in particular. In this context, a pay award of less than 3% would seem totally unsustainable. We assume other staff pay per head grows by 7.5% in 2024–25. Given the 10% rise in the National Living Wage in April 2024, local government employers will need to increase wage rates to keep pace and maintain differentials. Our assumed 7.5% growth is about 0.5 percentage points lower than what occurred in 2023–24. Finally, we assume non-staff costs grow in line with OBR forecasts for CPI inflation of 3%. Even if this ended up being closer to 2% instead, this would only shave off about 0.15–0.2% from our projections for school costs growth.
Finally, we have not assumed any cost pressures from high-needs or special educational needs provision. In recent years, the government has assumed that these add 0.5% to the annual growth in school costs. Given continued growth in the number of pupils with high needs, this seems likely to be repeated for 2024–25.
Summing up
To sum up, the government regularly claims that school funding and funding per pupil are at record highs. Such claims are, to put it mildly, unhelpful to public debate. Prior to 2010, school funding per pupil was at a record high almost every year. The fact that this has not been the case since 2010 just reflects the fact that we have seen historically large cuts to school spending per pupil. Furthermore, the actual costs faced by schools are growing faster than overall inflation, such that the actual pressures on school budgets are likely to be much more challenging than when we use standard measures of inflation to calculate real-terms changes in school funding per pupil. On current policy and projections, we expect a 1% fall in the purchasing power of school budgets in 2024–25. If the government wanted to compensate schools fully for the expected cost rises, school funding would need to rise by a further £700 million over and above existing plans for 2024–25. If the government wanted to go even further and compensate schools for the 5% loss in the purchasing power of school budgets since 2009–10, it would require a total of £3.2 billion in extra funding.
Authors

Luke Sibieta
Luke is a Research Fellow at the IFS and his general research interests include education policy, political economy and poverty and inequality.
More from IFS
Understand this issue


Policy analysis


Academic research


