
Downloads
Download 'Understanding retirement in the UK'
PDF | 363.14 KB
Key findings
- Employment declines significantly after age 55, accompanied by rising rates of self-reported retirement. For men aged 55, 81% are in paid work, falling to 44% by age 65. For women, employment rates fall from 74% to 34% over the same ages. At the state pension age (66), employment drops sharply whilst retirement rates rise by more as individuals are particularly likely to self-report themselves as retired when they reach the state pension age, even if they had left work prior to this
- Long-run trends in retirement and employment patterns for men and women are dramatically different. Employment rates of men in their late 50s and early 60s are still lower than they were in the mid-1970s. This is despite strong growth since the mid-1990s, with more men of these ages both retired, and economically inactive but not retired (most of whom have a health problem) compared with the mid-1970s. Women are much more likely to be in paid work in their late 50s and early 60s than in the mid-1990s or before.
- People with average levels of wealth in their late 50s and early 60s have the highest employment rates (76%) compared with the poorest fifth (46% employment rate) or the richest fifth (65%). Employment grew most between the early 2000s and the pandemic among those with average wealth levels. Retirement before state pension age is increasingly concentrated amongst the wealthier population. The fraction of people who are retired aged 55–64 that are in the richest 20% of the population has risen from 23% in 2002–03 to 32% by 2018–19. Poorer people aged 55–64 are much more likely than richer people to report being out of work due to health reasons.
- There are some striking differences in employment rates between different groups for people aged 55–65. 83% of people with mortgages are still in employment aged 55–65, compared to 57% of people who own outright and 52% of renters. Only 40% of those with a disability are employed (73% for those without a disability). In terms of ethnicity, Black men have the highest employment rate at this age (76%) while Asian women have the lowest employment rate (52%).
- Although people with average levels of wealth are more likely to work in the run up to state pension age, employment rates for those above the state pension age are highest among wealthier people. Of the wealthiest fifth of the population, 15% are still in paid work aged 70–74 compared to 11% for the middle fifth, and 6% for the poorest fifth. Those working beyond state pension age are disproportionately likely to work fewer than 16 hours per week (around 45% of men and women still working at 74) or to be self-employed (50% of men and 41% of women still working at age 74 are self-employed).
- The income sources people have at these ages are very heterogeneous. Before state pension age, those in paid work rely on their earnings (83% of income for workers aged 60–65), and those retired rely on their private pension (58% of income for retired people aged 60–65) and, to a lesser extent, a spouse’s earnings. Those out of work but not retired generally rely on state benefits (42% of income for this group at ages 60–65) and potentially a spouse’s earnings. However, after state pension age, retired people rely on a combination of state and private pensions. Many of those still in paid work above state pension age have a mixture of income sources: in addition to earnings, 83% of those working in their late 60s draw a state pension and 35% draw a private pension. 31% of people in paid work aged 66–69 have income from earnings and the state pension and a private pension all together.
- Above state pension age, the state pension forms a very important part of income even for middle- and high-income people. Amongst those aged 66–74 who have left paid work (almost all of whom report being retired), the state pension makes up 70% of the income for the lowest-income fifth, 45% for the middle fifth, and even 20% for the highest-income fifth. The highest-income fifth of this group relies mostly on private pensions, making up half of income.
1. Introduction
Patterns of retirement, and employment, at older ages, are of key interest to policymakers, in part because of the broad goal of encouraging longer working lives as a part-solution to the challenges caused by an ageing population. There have been large changes in employment and retirement behaviours in recent decades across the developed world (see Börsch-Supan and Coile, 2023), though the UK stands out compared with other major OECD countries in having falling labour force participation at older ages since the COVID-19 pandemic (Cribb, 2023a,b).
This report is designed to provide new evidence on retirement patterns in the UK, as part of the Pensions Review,1
a larger project run by the IFS in partnership with the abrdn Financial Fairness Trust, which is examining the future of financial security in retirement. Understanding patterns of retirement at older ages is key to understanding the challenges facing pensions systems, as pensions are designed to enable households to finance spending in old age when people are no longer in paid work. This report seeks to understand how patterns of employment and retirement have changed, both before and after state pension age, and how people finance their retirement. Where possible, we draw on the latest data in order to show the labour market and retirement behaviour of people aged 50–74 since the COVID-19 pandemic.
To start, we need to answer a basic question: what is retirement? There is a range of potential definitions (as shown in Figure 1), the appropriateness of which can differ across countries depending on the institutional context.
In some countries, particularly where state or public pensions form the vast majority of pension wealth and there is an early retirement age which allows early access to an (actuarily reduced) state pension, an appropriate definition of a retirement is often ‘claiming a state pension’. This definition, using UK data, is shown by the blue line in Figure 1. However, in the UK this is not a useful definition. There is no early claiming age in the UK, meaning people can only claim a state pension from age 66. And it is perfectly possible to claim the UK state pension while working – there is no earnings test. Therefore, this definition is dramatically at odds with definitions based either on self-reports or on labour market behaviour.2
Neither is claiming a private or occupational pension an appropriate definition (yellow line). While it shows similar retirement rates to other definitions between the ages of 50 and early 60s, because many people in their late 60s and early 70s do not have private pension income, it fails to capture high rates of self-reported retirement at these ages.
An alternative definition could be to define as retired all people aged over a certain age – say 50 – who are not in paid work or actively seeking work (‘unemployed’). These people are technically known as ‘economically inactive’, shown by the green line in Figure 1. Rates of economic inactivity rise from 15% at age 50 to 36% at 60 and 87% at 70. But – as is shown in Figure 4 later – many of those who are economically inactive in their 50s (in particular) do not consider themselves retired but out of the labour force due to sickness, disability or responsibility for looking after family.
Therefore, this leaves measures of retirement based on self-reported status. The purple line shows the fraction of people who consider themselves retired. This is essentially zero for people in their early 50s, rising to 20% by age 60, jumping to 70% in their mid-60s, and gradually rising to 90% by their early 70s. This is similar to a related definition, ‘self-reported retired, and economically inactive’, which uses self-reported status and conditions on being out of the labour force, as shown by the red line. As this definition is available in a variety of data sets, and allows us to distinguish between employed and retired people separately, we use this as our working definition of ‘retirement’ throughout this report.
Figure 1. Percentage of people retired, according to different possible definitions, by age
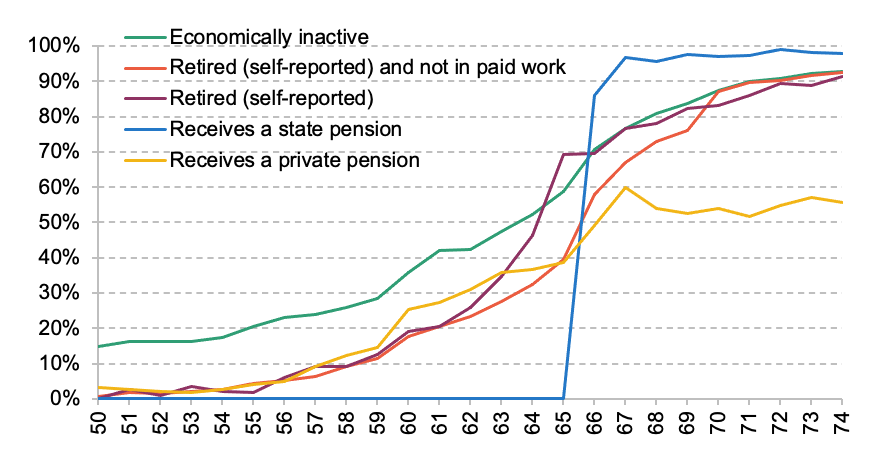
Note: Due to the differences in data source, for people in their early 70s, ‘Retired (self-reported)’, from ELSA, is below ‘Retired (self-reported) and not in paid work’, from the UK LFS. ELSA is England only.
Source: Labour Force Survey (‘Economically inactive’ and ‘Retired (self-reported) and not in paid work’) 2022; English Longitudinal Study of Ageing (‘Retired (self-reported)’) waves 8 and 9 (2016–17 and 2018–19); Family Resources Survey (‘Receives a state pension’ and ‘Receives a private pension’) 2021–22.
The analysis in this report contained in the following chapter, on employment and retirement patterns, relies on data on employment and retirement patterns in the UK based on long-running data from three household surveys: the Labour Force Survey (LFS), the English Longitudinal Study of Ageing (ELSA) and the Wealth and Assets Survey (WAS). The LFS provides the largest sample and longest running series, back to 1975, but ELSA provides additional, richer data on wealth for a large sample of older people (albeit only for those in England). The WAS is used to provide information on retirement expectations. Chapter 3, focusing on income sources of people aged between 50 and 74, relies on data from the Family Resources Survey (FRS). After presenting the analysis, the report concludes with a short discussion in Chapter 4.
2. Patterns of retirement and employment
The analysis in this chapter focuses first on employment and retirement rates by age and sex, and particularly how these have changed over time, and how these patterns differ for different types of people below state pension age. We then turn to examine employment above state pension age for the kinds of people who work in their late 60s and early 70s (irrespective of whether they self-report being retired). Finally, we consider the sources of income that are important for different types of people as they get older and how these differ for different types of people.
Employment and retirement patterns over times
Figure 2 presents data from 2021 and 2022 that summarise the changing employment and retirement patterns for men and women, respectively. At age 50, 86% of men and 80% of women are in paid work, and with low rates of unemployment and retirement, most of those not in paid work are economically inactive for reasons other than retirement.
Employment rates fall gradually when people reach their 50s, particularly after age 55, and much more dramatically in their early 60s, with the vast majority of the decrease in employment coming from rises in retirement. At age 69, 18% of men are in paid work, 74% are retired, and 8% are economically inactive for other reasons. For women, the employment rates are slightly lower (12%) and retirement rates slightly higher (80%). At age 70, the LFS methodology changes such that all economically inactive people are categorised as retired.
Figure 3 shows how these patterns have changed over time, all the way back to 1975. This analysis draws on similar data to those presented in Banks, Emmerson and Tetlow (2019) and Chandler and Tetlow (2014), although it additionally examines unemployment and different forms of economic activity and updates the analysis for the latest (post-pandemic) data.3
Figure 2. Proportion of population in paid work, retired, and out of work (not retired), by age, 2021–22
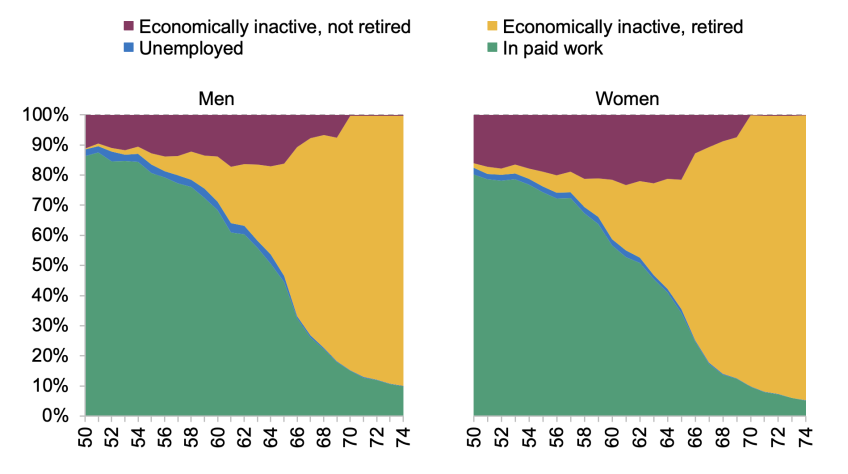
Source: Author’s calculations using the LFS. Economically inactive people aged 70+ are considered retired.
For men, the trends in employment and retirement can be split into two distinct periods. Employment rates fell substantially from the mid-1970s to the mid-1990s, from an incredibly high 90% in 1975 to just 66% in 1994 for those aged 55–59, and from 72% to 44% for those aged 60–64 over the same period. This decrease was accompanied by rises in economic inactivity but not retirement. As Banks, Blundell and Emmerson (2015), and others, discuss, a large amount of this was sickness-related inactivity. Employment rates have recovered since the mid-1990s, rising to 79% for men aged 55–59 by 2019 and 61% for men aged 60–64. These are still around 10 percentage points lower than the employment rates seen in the mid-1970s. Although employment rates have fallen back since 2019, the changes are barely noticeable compared to the changes of the last 50 years.
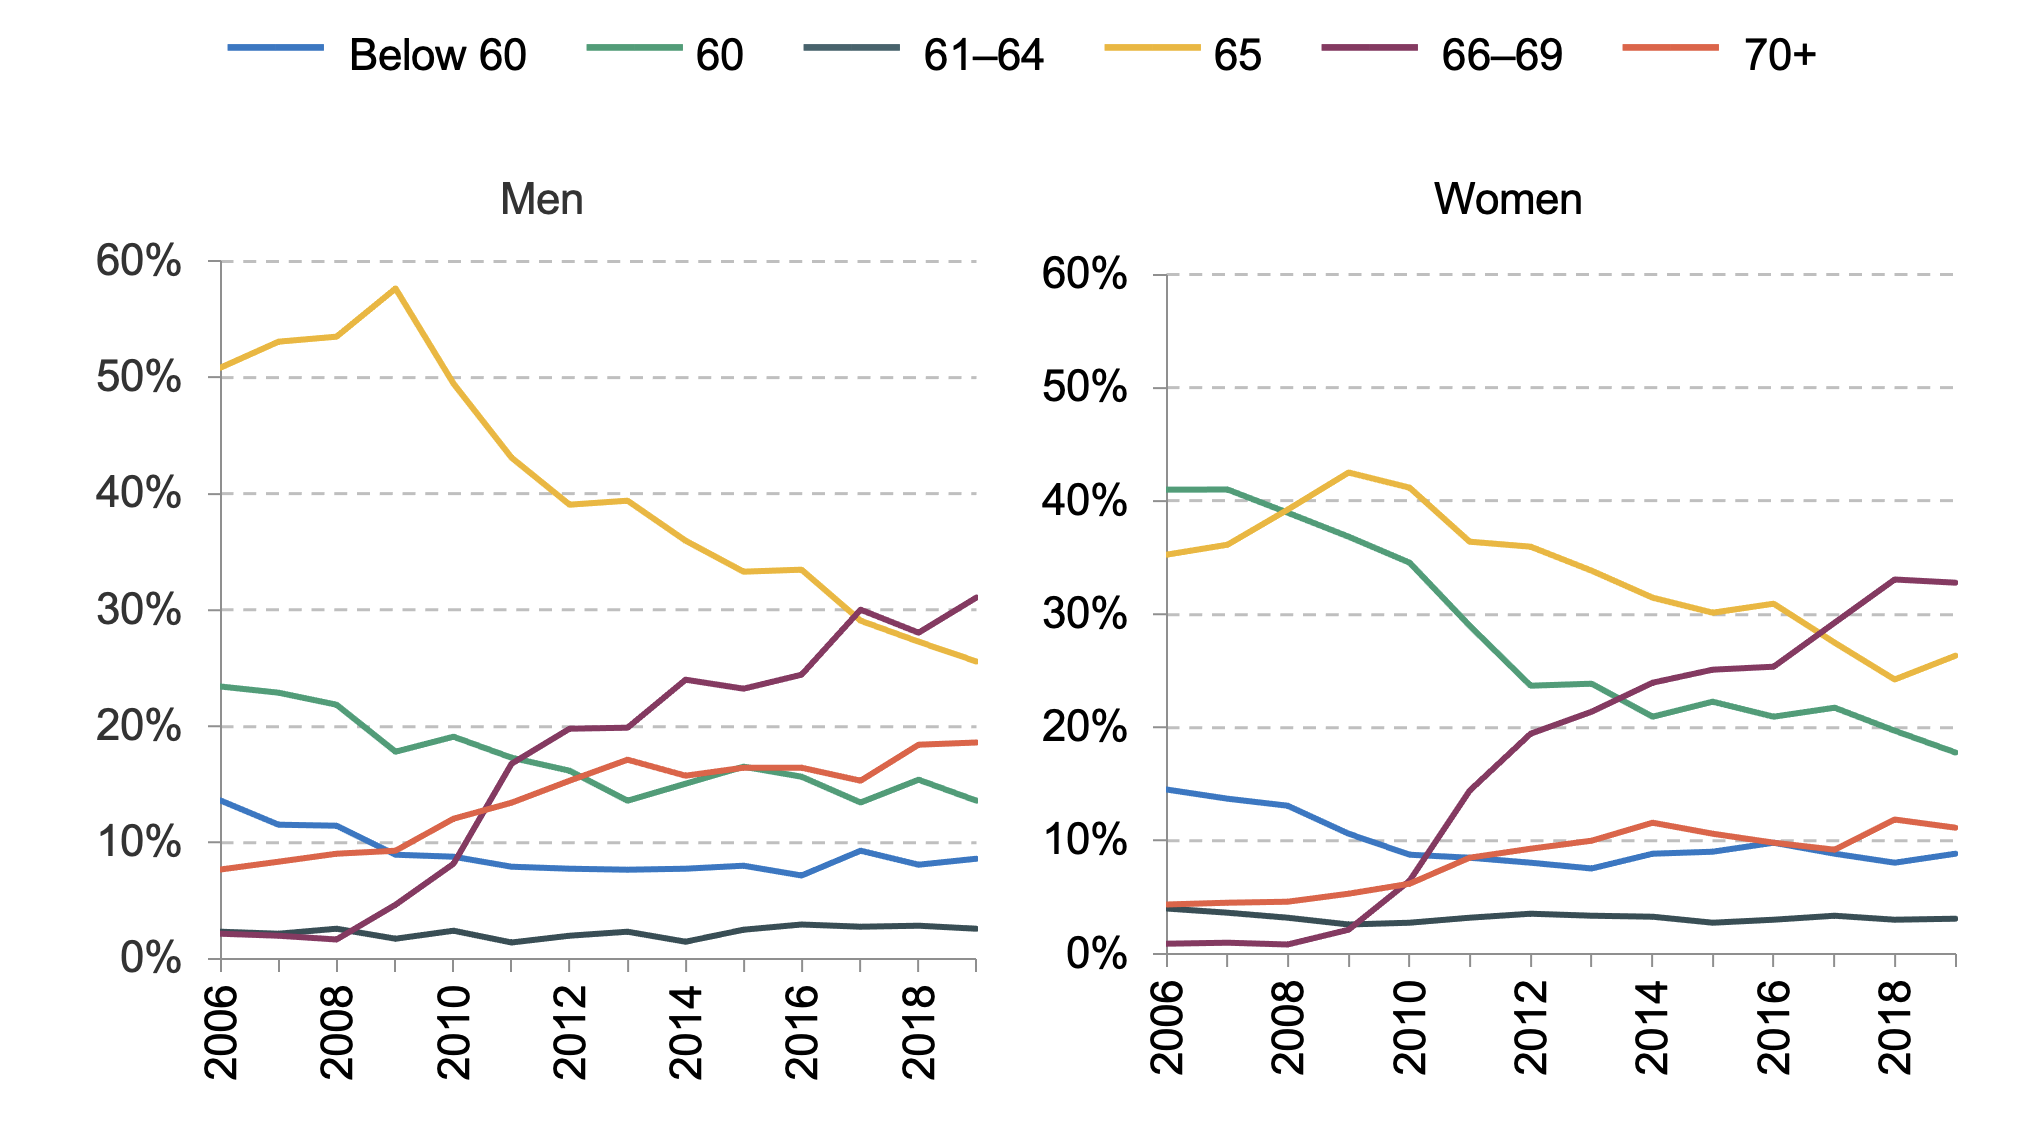
Figure 3. Economic activity, by age and sex, 1975–2022
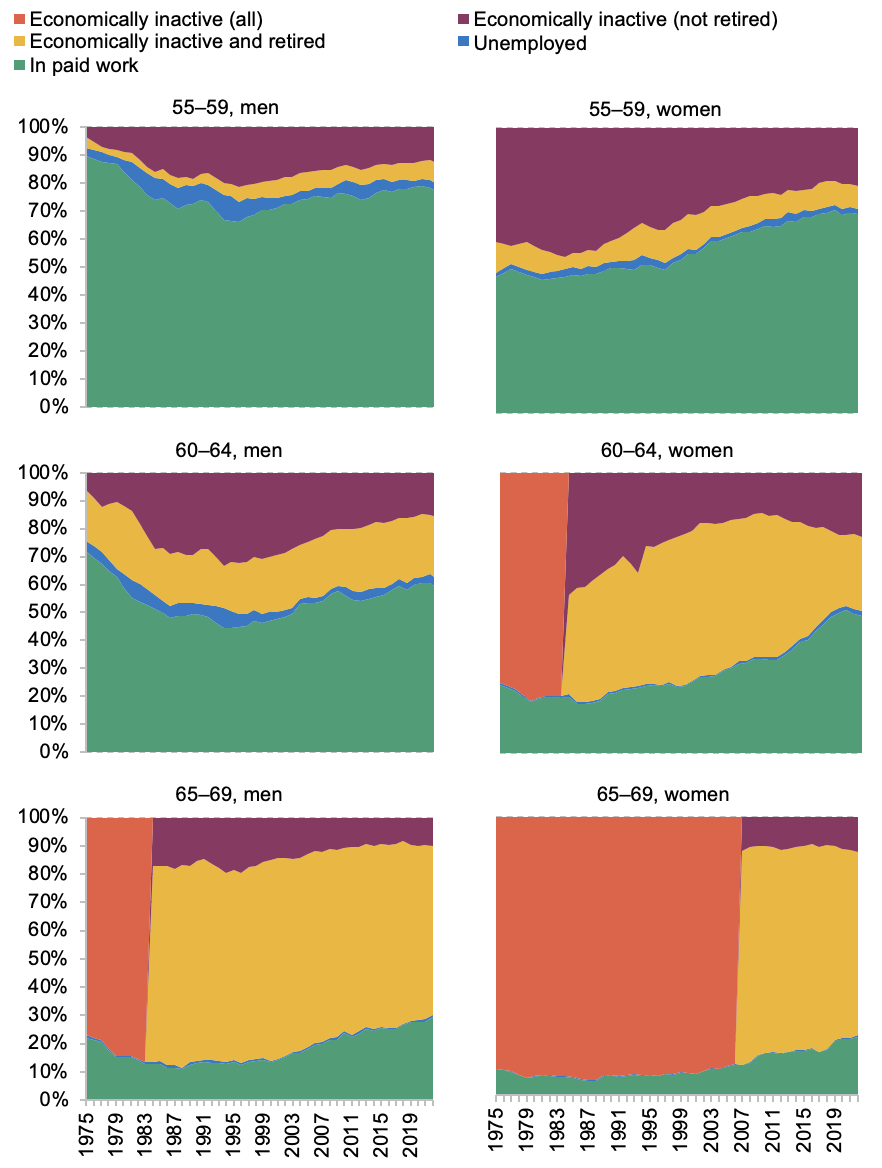
Note: Interpolations from the years before and after for the years 1976, 1978, 1980, 1982, 1992 and 1993. Between 1984 and 2007, women were considered retired if they were aged 65+. Questions about looking after family and other ability to categorise between different forms of inactivity changed between 1983 and 1984 in a way that makes it hard to be consistent over time. For this reason, all economically inactive women aged 65–69 before 2007, women aged 60–64 before 1984 and all men aged 65–69 before 1984 are categorised as ‘economically inactive (all)’.
Source: Author’s calculations using the LFS.
The trends for women are shown to be dramatically different compared with men. Women aged 55–64 did not see the dramatic fall in employment that men saw between the mid-1970s and mid-1990s, though neither were there rises in the employment rates for women of these ages, in comparison to large increases in working-age female employment as a whole over this period (see Roantree and Vira, 2018). However, starting in the mid-1990s, employment rates grew quickly, from 52% in 1994 for people aged 55–59 to 71% in 2019 (70% in 2022). The rise for women aged 60–64 was faster, in part due to a six-year increase in the state pension age for women from age 60 to 66 over this period (see Cribb, Emmerson and Tetlow, 2016). As Börsch-Supan and Coile (2023) point out, although these increases in employment rates at older ages are large, they are not internationally unusual; Germany, for example, has seen far larger increases in employment at these ages since the early 2000s.
Retirement patterns for women show different trends. For women aged 55–59, the changes are fairly modest, with between 7% and 12% of women retired in every year since 1989. But for women aged 60–64, the fraction of women declaring themselves to be retired rose from 40% in the mid-1980s to 54% by 2002, before falling to 26% pre-pandemic (27% in 2022) as their state pension age, and employment rates, rose. Retirement rates of women aged 65–69 are high, but falling slightly as employment rates of women of these ages have crept up.
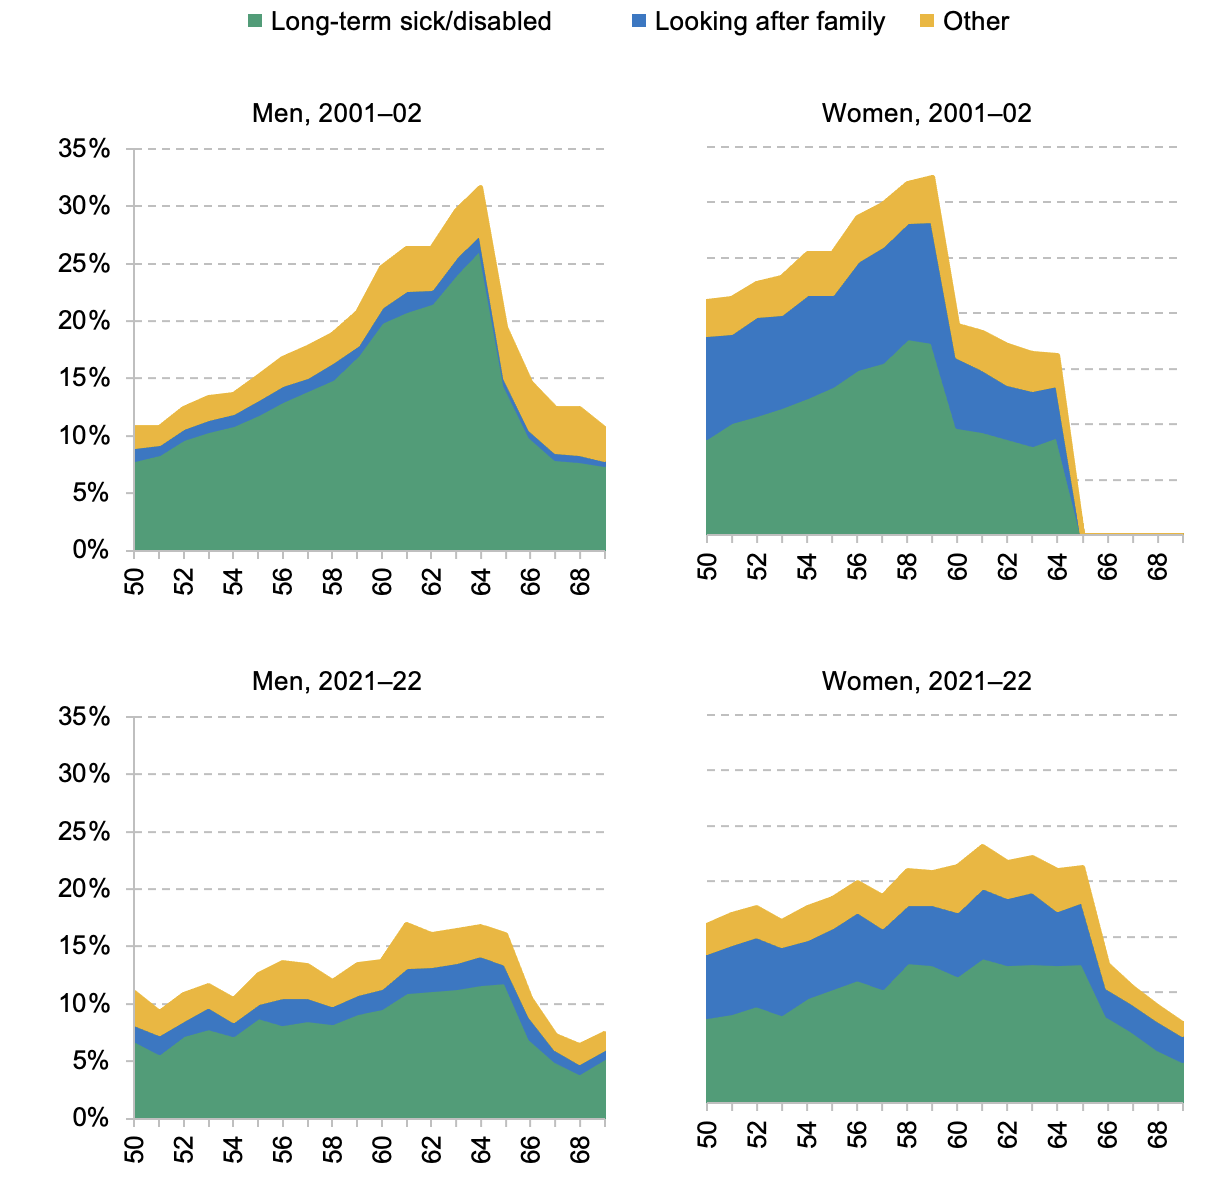
Figure 4 illustrates the significant variation in the fraction of people who are economically active but not retired, over time and by sex. It shows the fraction of men, and women, who are economically inactive and not retired, in the latest data from 2021–22 and 20 years earlier in the early 2000s. It splits (non-retirement) inactivity into three groups based on self-reported reasons for not being in paid work (rather than, say, objective measures of their health or time use). The figure shows that, for men, the vast majority of economically inactive people at these ages who do not report being retired are instead out of the labour force and report being long-term sick and disabled – and there has been a substantial fall in the proportion of the male population who reports this. Most dramatically, in the early 2000s, a quarter of all men aged 64 were economically inactive and long-term sick and disabled, which has more than halved over 20 years, down to 12%.
For women, the story is different. In the early 2000s, around 10% of women in their 50s were out of the labour force because they were looking after their family, a rate which has now fallen to around 5%–6%. Rates of economic inactivity due to long-term sickness or disability have also fallen for women in their late 50s. But the higher state pension age means that fewer people define themselves as retired in their early 60s now, so there is no longer a sharp fall in all reasons for (non-retirement) inactivity at age 60; instead, it occurs at the higher state pension age of 66, meaning that more women categorise themselves as out of the labour force in their early 60s due to illness than 20 years ago.
Figure 4. Stated reasons for being economically inactive but not retired, aged 50–69, percentage of the population by age and sex, 2001–02 and 2021–22
Note: Economically inactive people aged 70+ are considered retired in the latest data and, prior to 2007, women were considered retired if they were economically inactive at age 65 or over.
Source: Author’s calculations using the LFS.
Economic activity among those approaching state pension age
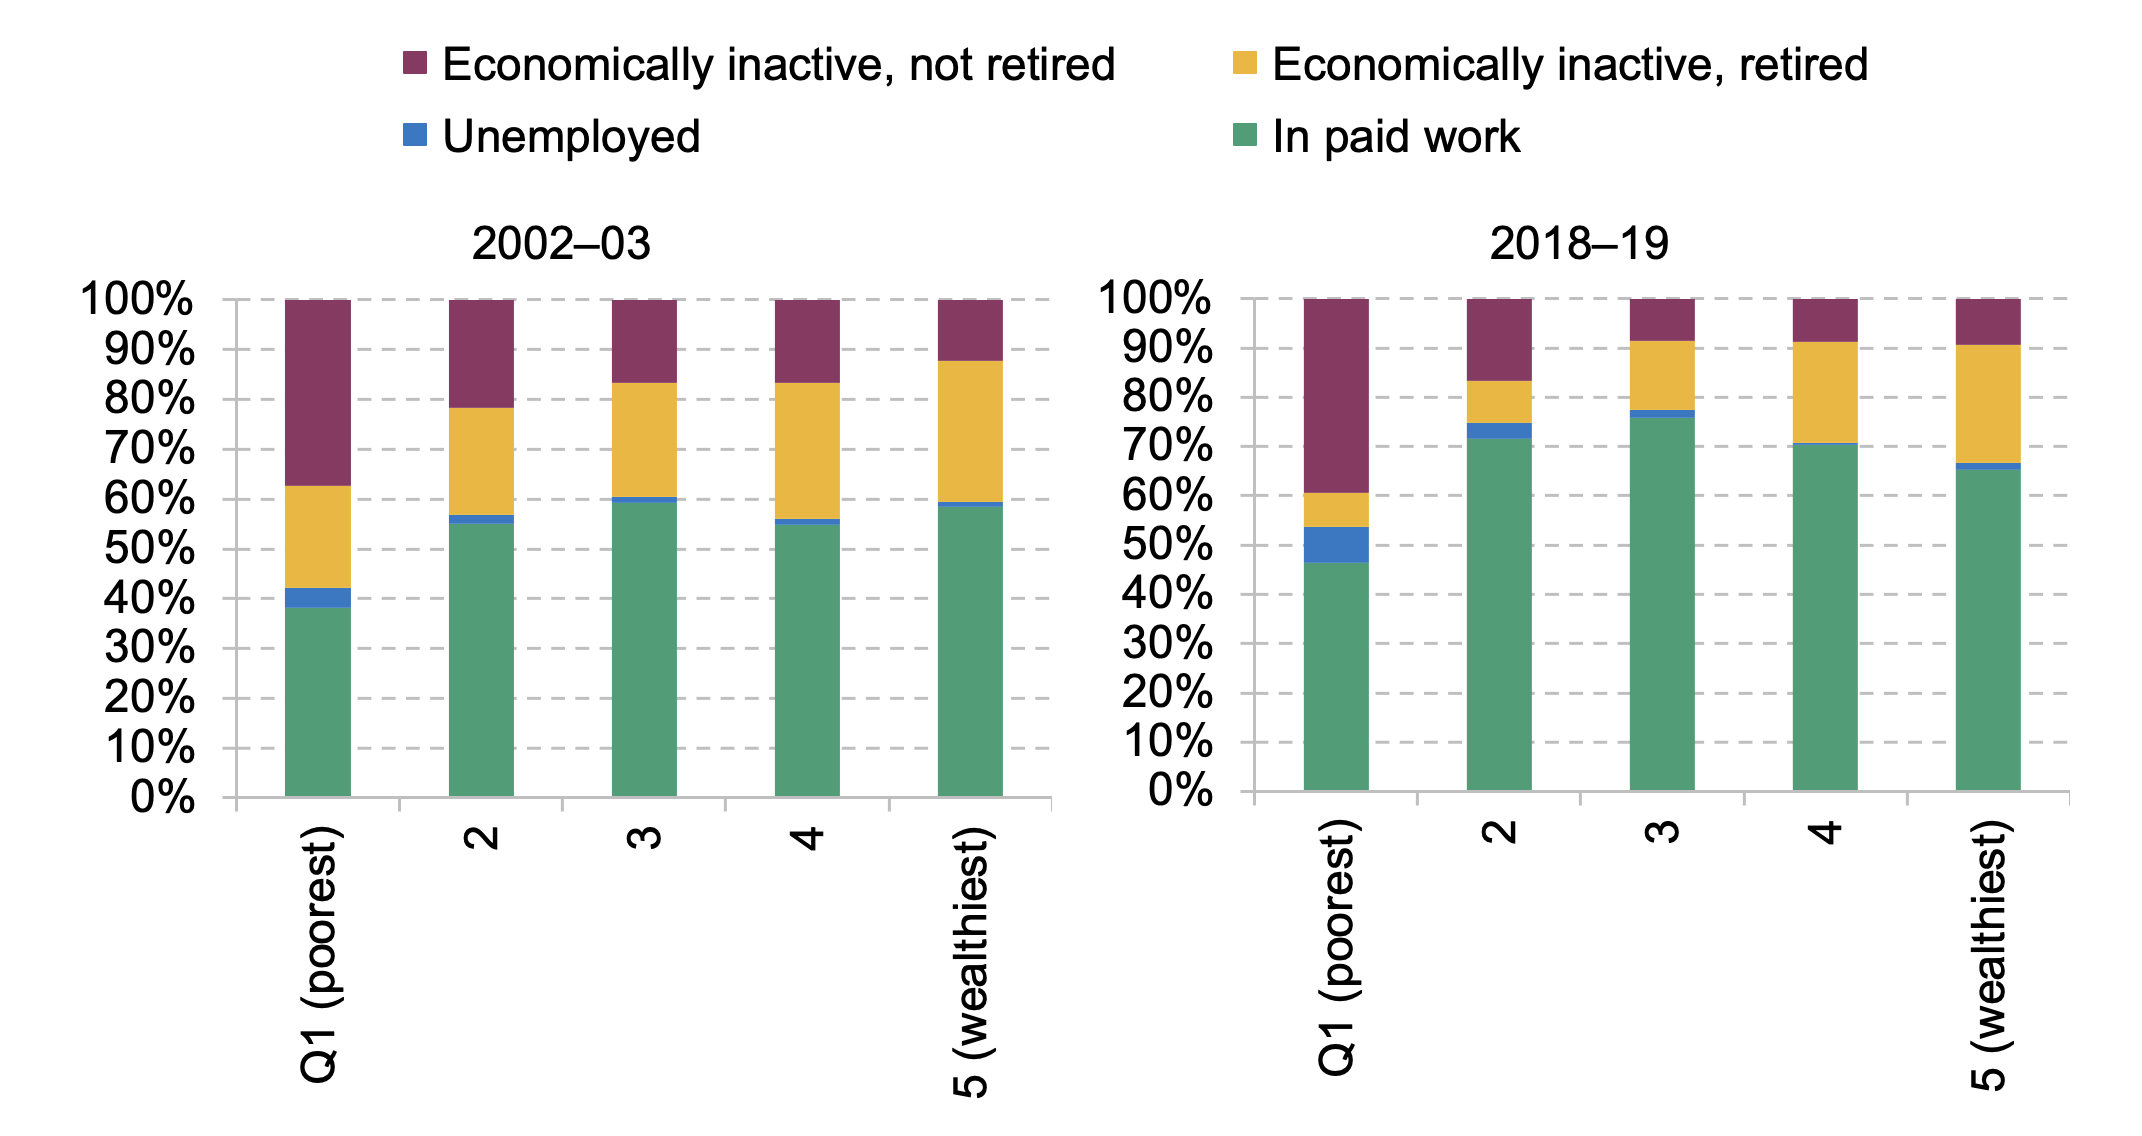
The types of people who are employed, retired, or in other forms of inactivity in their late 50s and early 60s differ in important ways. As identified by Banks and Smith (2006), low-wealth people in their late 50s are less likely to be working and are more likely to be receiving income support or disability benefits, whereas higher-wealth people are more likely to be (early) retired in their late 50s, drawing on private or occupational pensions. Banks and Casanova (2003) used the first wave of ELSA covering 2002–03 to look at employment, retirement, and economic inactivity across the (non-pension) wealth distribution. The left-hand side of Figure 5 repeats similar analysis using 2002–03 data, finding high rates of non-retirement inactivity and low rates of employment, for the poorest 20%, and highest employment for middle-wealth groups and higher rates of retirement for the wealthiest.
Figure 5. Economic activity of people aged 55–64, by (non-pension) wealth quintile, 2002–03 and 2018–19
Note: Results are similar if we use an age cut-off of 59 for women in both years (so all women are below state pension in both years).
Source: Author’s calculations using ELSA.
The right-hand side of the figure undertakes the same analysis for the latest ELSA data from 2018–19. It shows that employment has become more ‘hump-shaped’ across the wealth distribution. In other words, the largest increases in employment have been for middle-wealth people. 75% of middle-wealth people in their late 50s and early 60s are in employment, compared to less than 60% in the early 2000s. There have been reductions in retirement rates across the distribution, but the smallest falls for the wealthiest. Retirement before 65 has become increasingly concentrated amongst the richest 20% of the population. Indeed, in 2002–03, 23% of retired people in their late 50s and early 60s were in the richest 20%, which has risen to 32% by 2018–19. And inactivity (other than retirement) has become even more concentrated amongst the poorest 20%, where it has risen rather than fallen.
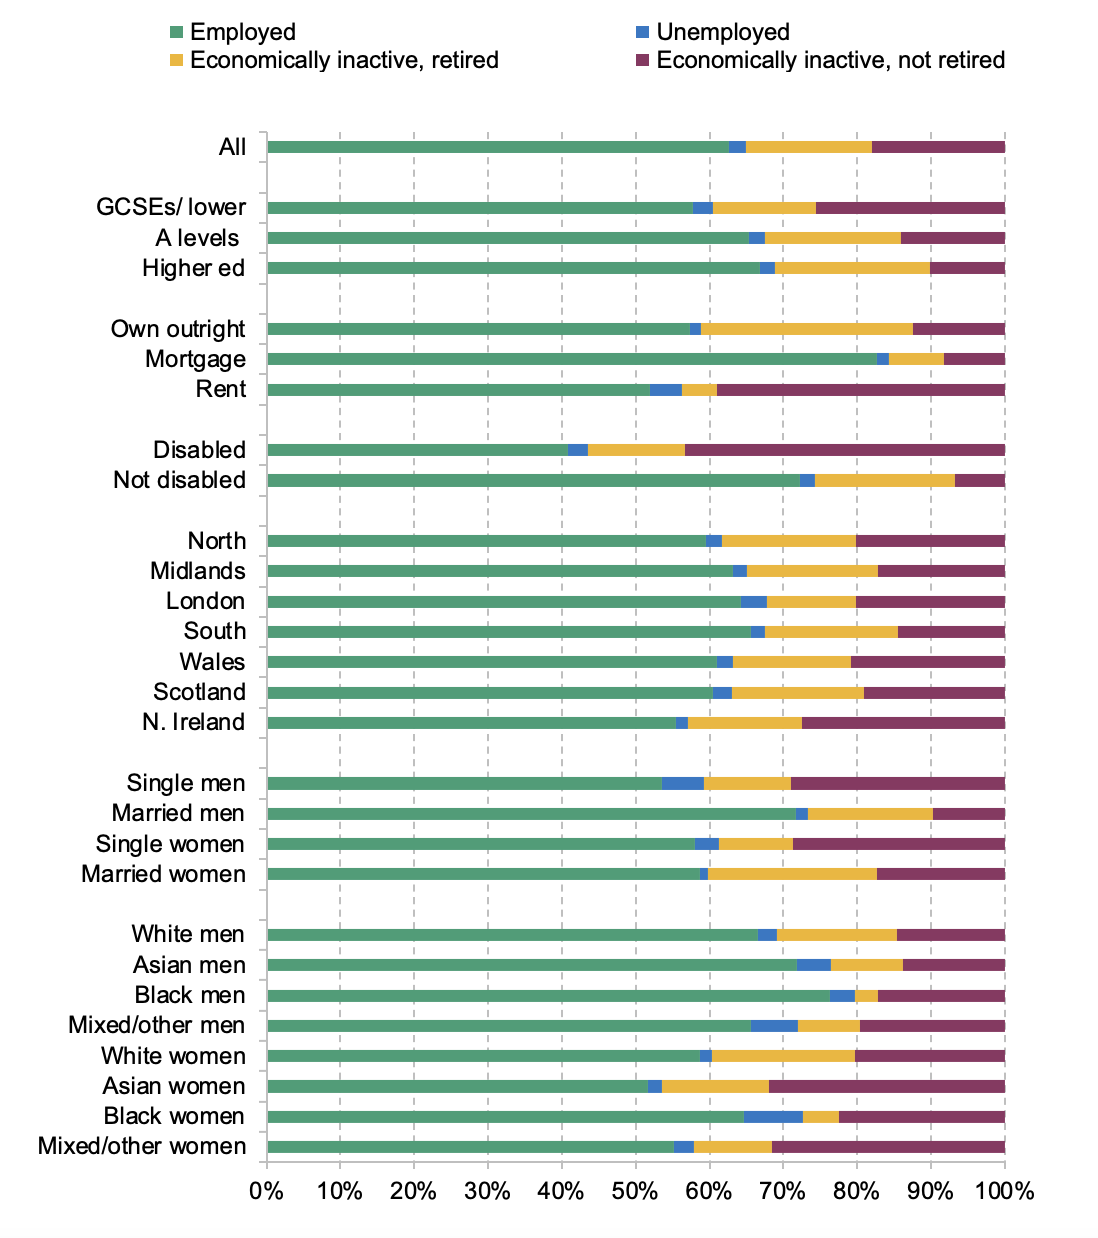
Figure 6 looks in more detail at the economic activity for different demographic groups in the population, concentrating on the latest data from 2021–22. Broadly, the patterns you would expect on the basis of the findings from Figure 5 are drawn out in the data – more prosperous groups (such as those with higher levels of formal educational qualifications) are more likely to be retired, and less likely to be unemployed or economically inactive for reasons other than retirement. But there are some especially interesting results with regards to employment rates in particular.
For example, people still paying off mortgages (26% of the population for this age group) have substantially higher employment rates (83%) compared with either people who have paid off their mortgage and therefore own outright (57%) or renters (52%). This is in part due to people with mortgages being on average slightly younger, but it also indicates that people with mortgages carry on in paid work in order to help pay off their mortgage (as is found by Bottazzi, Low and Wakefield, 2007). It could also – more speculatively – be the case that the kind of people who know that they plan to delay retirement until at least their mid-60s also take out mortgages with longer terms or do not otherwise pay down their mortgage so quickly because they plan to work for longer.
Disabled people are considerably less likely to be employed (41%) compared with those without a disability (72%) – and, unsurprisingly, much more likely to be economically inactive but not retired. Southern England has the highest employment rate (66%) and also one of the highest retirement rates due to low unemployment and low rates of (non-retirement) economic inactivity. Married (or cohabiting) men stand out as having a much higher employment rate (72%) compared with single men and women (either married/cohabiting or single), and while there are differences between the employment rates of different ethnicities, women from an Asian background stand out as having the lowest employment rates (52%).
Figure 6. Economic activity of people aged 55–65, 2021–22, for different demographic groups
Note: ‘Married’ includes people with a cohabiting partner. White includes white British and other white people.
Source: Author’s calculations using the LFS.
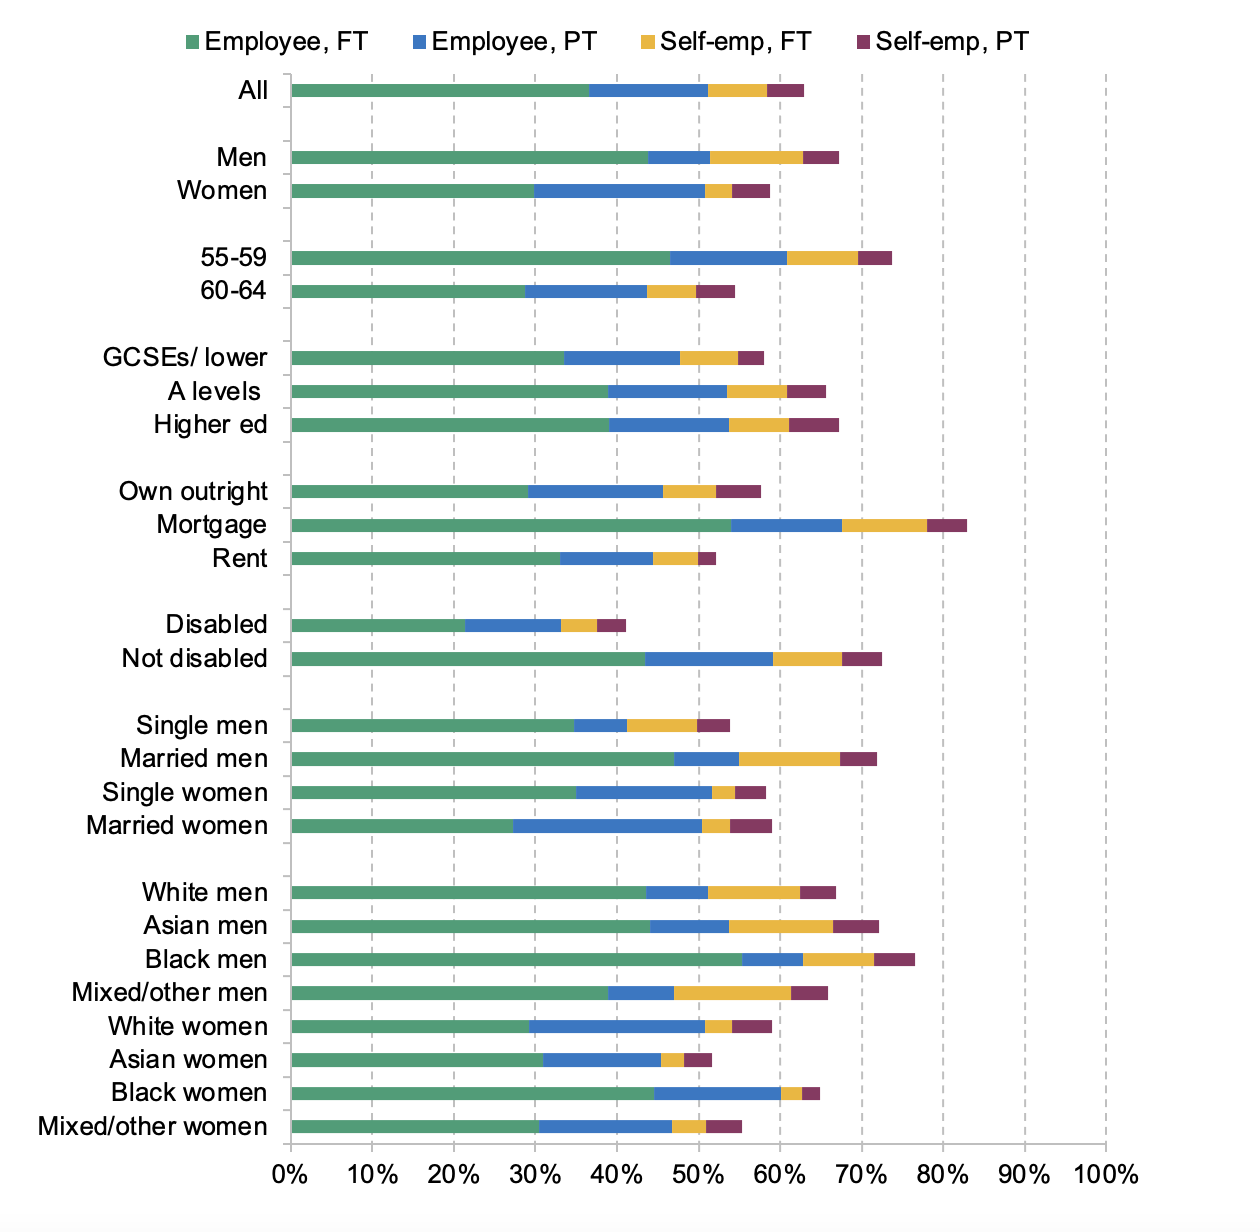
The type of work people undertake at these ages also differs considerably for different groups. Figure 7 decomposes the employment rates of people aged 55–64 for the different demographic groups into four parts: full-time employees, part-time employees, full-time self-employed and part-time self-employed. While being a full-time employee is the most common form of work on average, and indeed for every demographic group considered, a number of stark differences jump out.
- Sex. Approximately the same fraction of men and women are employees at these ages, though over 20% of women are part-time employees, compared to only 7% of men. The higher employment rates for men come from the fact that, despite the same proportion as employees, 16% of men are self-employed, double the 8% for women.
- Housing tenure. As well as having the highest employment rates, people with mortgages have a very high likelihood of being full-time employees (53%) compared to 29% of those who own their property outright.
- Ethnicity. Black men and women have higher probability of being full-time employees. 55% of Black men are full-time employees compared to 44% of White men, and 45% of Black women are full-time employees compared to 29% of White women.
Of course, the different labour market states shown in Figure 7 are not fixed – people may sometimes move between them in the run up to retirement or exit from the labour force. For example, Crawford et al. (2021) examine transitions between full-time career jobs and retirement. For example, some people use part-time work as part of a gradual shift towards retirement. Moving into part-time work is more common for people with high levels of education and living in less-deprived parts of the country. They find that of full-time workers approaching retirement and observed between 2002 and 2018, 30% make a transition to part-time work over that period. However, while self-employment is more common at older ages, Crawford et al. (2021) find that less than 10% of people make a switch into self-employment between the ages of 50 and retirement.
Figure 7. Employment rate of people aged 55–65, by employment type and hours, 2021–22
Note: ‘Married’ includes people with a cohabiting partner. Employment rates after state pension age.
Source: Author’s calculations using the LFS.
Employment rates after state pension age
Employment rates drop substantially after state pension age. The latest evidence from increases in the state pension age for men and women (Cribb, Emmerson and O’Brien 2022) find that being just over the state pension age decreased the employment rate by 7.4 percentage points for men and 8.5 percentage points for women. Nevertheless, Figure 2 showed that a third of men, and a quarter of women were still in paid work at 66 (state pension age) in 2021–22.
Figure 8 shows the probability of being in paid work above state pension age (for people aged 66–69 and separately for those aged 70–74) by (non-pension) wealth quintile in the early 2000s and before the pandemic, equivalently to Figure 5. Almost all people out of work at these ages are retired, so we only show the employment rates. In general, wealthier people are actually more likely to remain in paid work beyond state pension age – that was true in 2002–03 and in 2018–19. This is consistent with the findings of Di Gessa et al. (2018), who found that only around a third of those working after the state pension age did so for (self-declared) financial reasons, compared to two-thirds who declared that they reported that they were still in paid work because they ‘enjoy working’ or because they want to ‘keep active and fit’.
Figure 8. Employment rates of people aged 66–69 and 70–74 by (non-pension) wealth quintile, 2002–03 and 2018–19
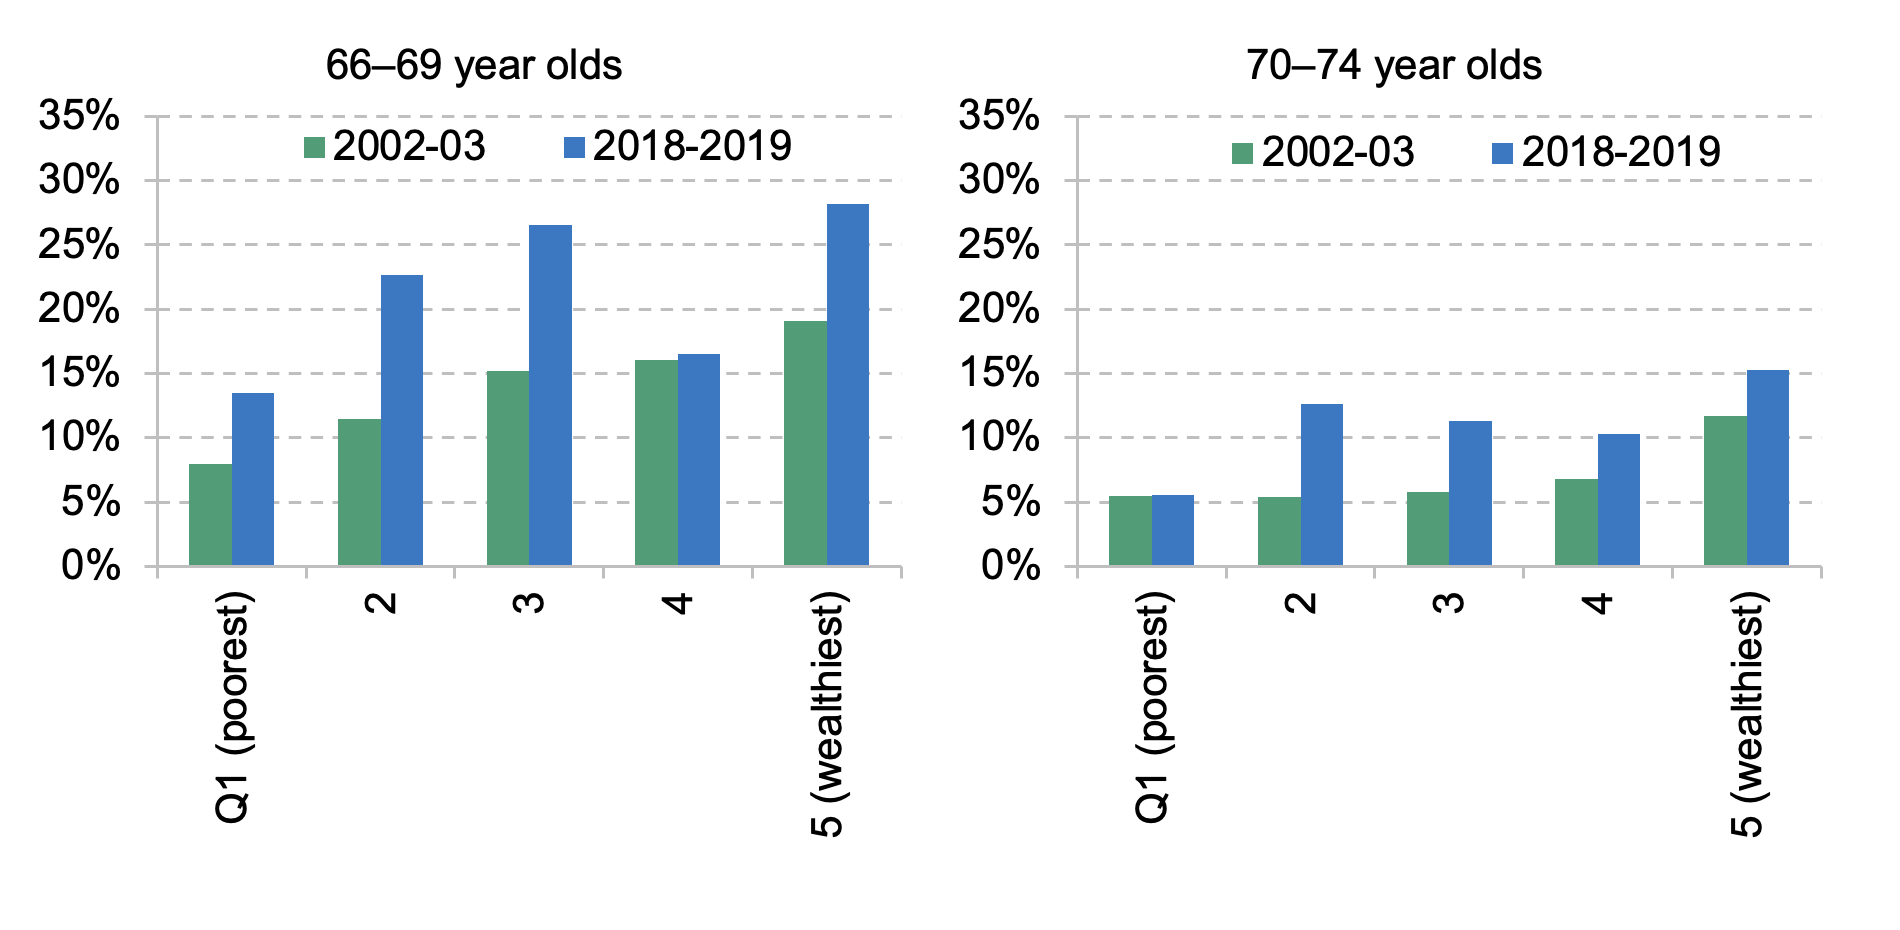
Source: Author’s calculations using ELSA.
It is noticeable that employment rates at ages 66–69 and 70–74 have increased almost across the board, the most noticeable exception being the poorest fifth of the population, which in 2018–19 had an employment rate of around 5% for 70–74 year olds, unchanged from 2002–03. The largest increases in employment rates since 2002–03 beyond state pension age have come in the middle (quintile 3) and lower middle (quintile 2) parts of the wealth distribution.
Figure A.1 in the Appendix provides more details on the types of people who work beyond state pension age in the latest data (covering 2021–22). In general, the types of people who are more likely to work in the run up to state pension age, shown in Figure 6, are also more likely to work beyond state pension age: men (especially married men); more-educated people; people without a disability, suggesting people in better health are much more likely to delay retirement. Of the small fraction of people aged 66–69 who still have a mortgage (7% of this age group), just over 40% are still in paid work. Black men have high employment rates after state pension age, with 42% of them working aged 66–69 and 19% aged 70–74.
Figure 9 shows the type of work that people are doing at these ages. Many men working at age 66 still work full-time (around 60% at least 30 hours); this declines gradually to about a third working full-time by age 74. In contrast, the fraction working much shorter hours (fewer than 16 hours per week) rises from 18% at age 66 to 45% at age 74. Amongst working women, they are less likely to work full-time, more likely to work fewer than 16 hours a week, and the age gradients are less steep.
Figure 9. Proportion of employed men and women aged 66–74 who report being retired, working less than 16 (or above 30) hours per week, or who are self-employed
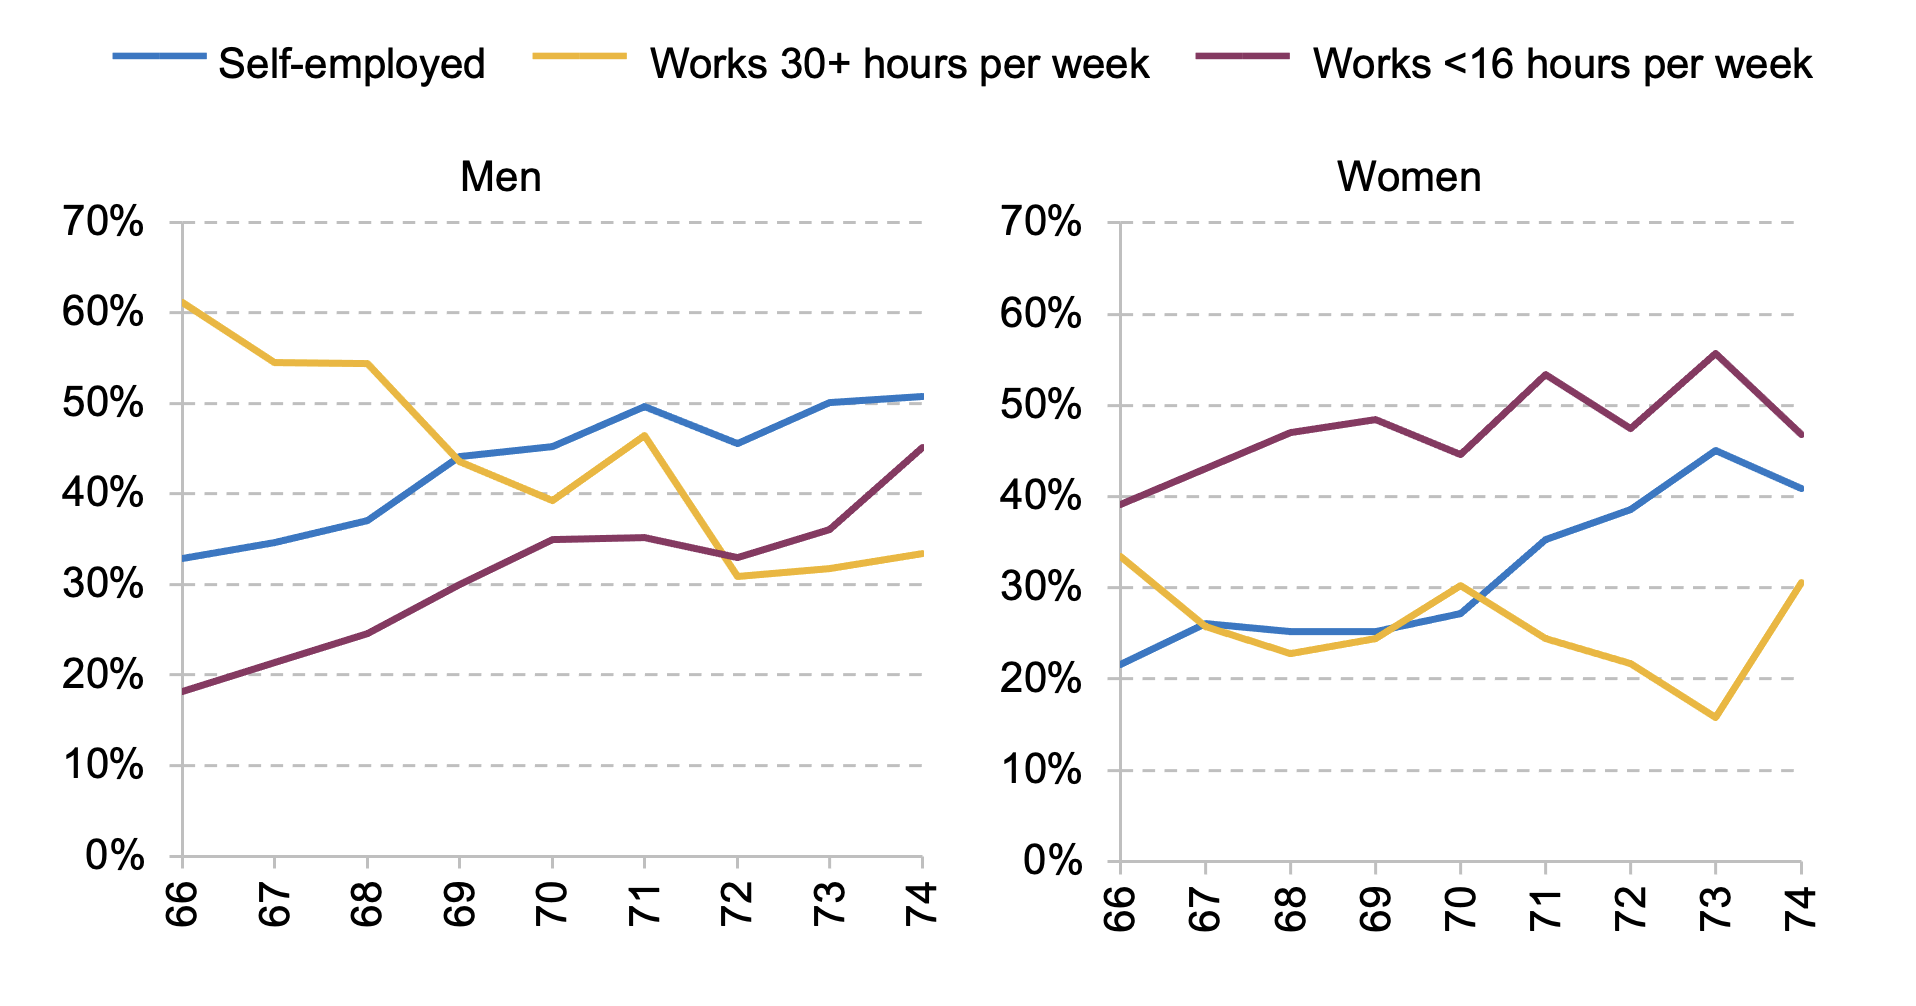
Source: Author’s calculations using the LFS 2021–22.
Self-employed people are considerably more likely to stay in work after state pension age – as has been found in European data by Wahrendorf et al. (2017) – while Crawford et al. (2021) find that part of the rise in self-employment at older ages is due to employees switching to self-employment prior to retirement. Just over a third of working men at age 66 are self-employed, rising to half of working men aged 74. This compares to just under a quarter of working men aged 55–65 who are self-employed. For working women over state pension age, the fraction who are self-employed is lower (just over 20% at age 66, rising to around 40% at age 74), again well above the fractions of working women in the 10 years before state pension age.
What are the potential prospects for continued increases in employment when people are in their late 60s and 70s? One determinant will be the continued rise in the state pension age. Cribb, Emmerson and O’Brien (2022) find that increasing the state pension age from 65 to 66 caused rises in employment that were at least as large as the increases caused by the increase from 60 to 61 (for women). We would probably expect that with the state pension age reaching 67 in 2028, and 68 by the mid-2040s, employment of 66 (and subsequently 67) year olds would increase.
At least prior to the pandemic, measures of retirement expectations data on people aged 40–54 suggest continuing increases in employment rates for people in their late 60s and indeed in their 70s as (currently) younger generations approach these ages. Figure 10 finds large increases in the fractions of people who expect to retire in their late 60s, potentially driven in part by higher state pension ages. Around a third of both men and women aged 40–54 in 2019 report that they expect to retire aged 66–69, whereas prior to 2009 almost no one said they expected to retire at these ages. And, if we take these reported expectations at face value, it seems likely that people will increasingly work into their 70s too: in 2019, 19% of men and 11% of women aged 40–54 expect to retire at age 70 or older, compared to 9% and 5% of men and women, respectively, ten years earlier. While these figures are all pre-pandemic (and it will be interesting to analyse these changes as new data are made available), it is worth noting that these changes in expectations are substantial compared to the – relatively small in historical terms – changes in employment and retirement patterns seen since 2020.
Figure 10. Expected age of retirement among people aged 40–54
Note: Sample is non-retired individuals aged 40–54 who answered the question ‘At what age do you expect to retire (from your main job)?’ with an expected retirement age.
Source: Author’s calculations using WAS waves 1–7.
Summary
Long-term trends have seen rising employment rates for people in their 50s and 60s, though there are big differences in the trends between men and women. Men’s employment rates have grown substantially since the 1990s, but despite this are still lower than those seen in the 1970s. Women’s employment rates are much higher, having started to rise in the mid-1990s. However, as Börsch-Supan and Coile (2023) note, rising employment rates at these ages are not unusual internationally. Further increases in the state pension age and retirement expectations data both suggest there are likely to be further increases in employment for people in their late 60s.
The wealth profiles of employment, retirement, and economic activity are striking. Employment is highest for people in their late 50s and early 60s for those in the middle of the wealth distribution compared with those who are poorer (who are more likely to be economically inactive, but not retired, most likely due to health reasons) and richer (who are more likely to be retired). Retirement for people in their late 50s or early 60s is increasingly concentrated amongst the wealthiest fifth of the population. Beyond state pension age, the patterns are different, with essentially all non-workers defining themselves to be retired, and higher employment rates for wealthier people. People working in their late 60s and early 70s are disproportionately likely to be self-employed, and/or working fewer than 16 hours per week.
3. Sources of income for people aged 50–74
In addition to examining the extent to which people work, and the types of work that people do, in the run up to and beyond state pension age, it is instructive to analyse the types of income that people rely on. This will – understandably – differ for people, depending on their employment or retirement status, and across the income distribution. This is important because it shows the extent to which people rely on different sources of income both in the run up to state pension age (when the potential for significant state support is much more limited) and after state pension age. This analysis is similar to that undertaken by Milligan (2014) who, in particular, examines the income sources of people leaving employment before they are eligible for a public pension (Social Security) in the United States.
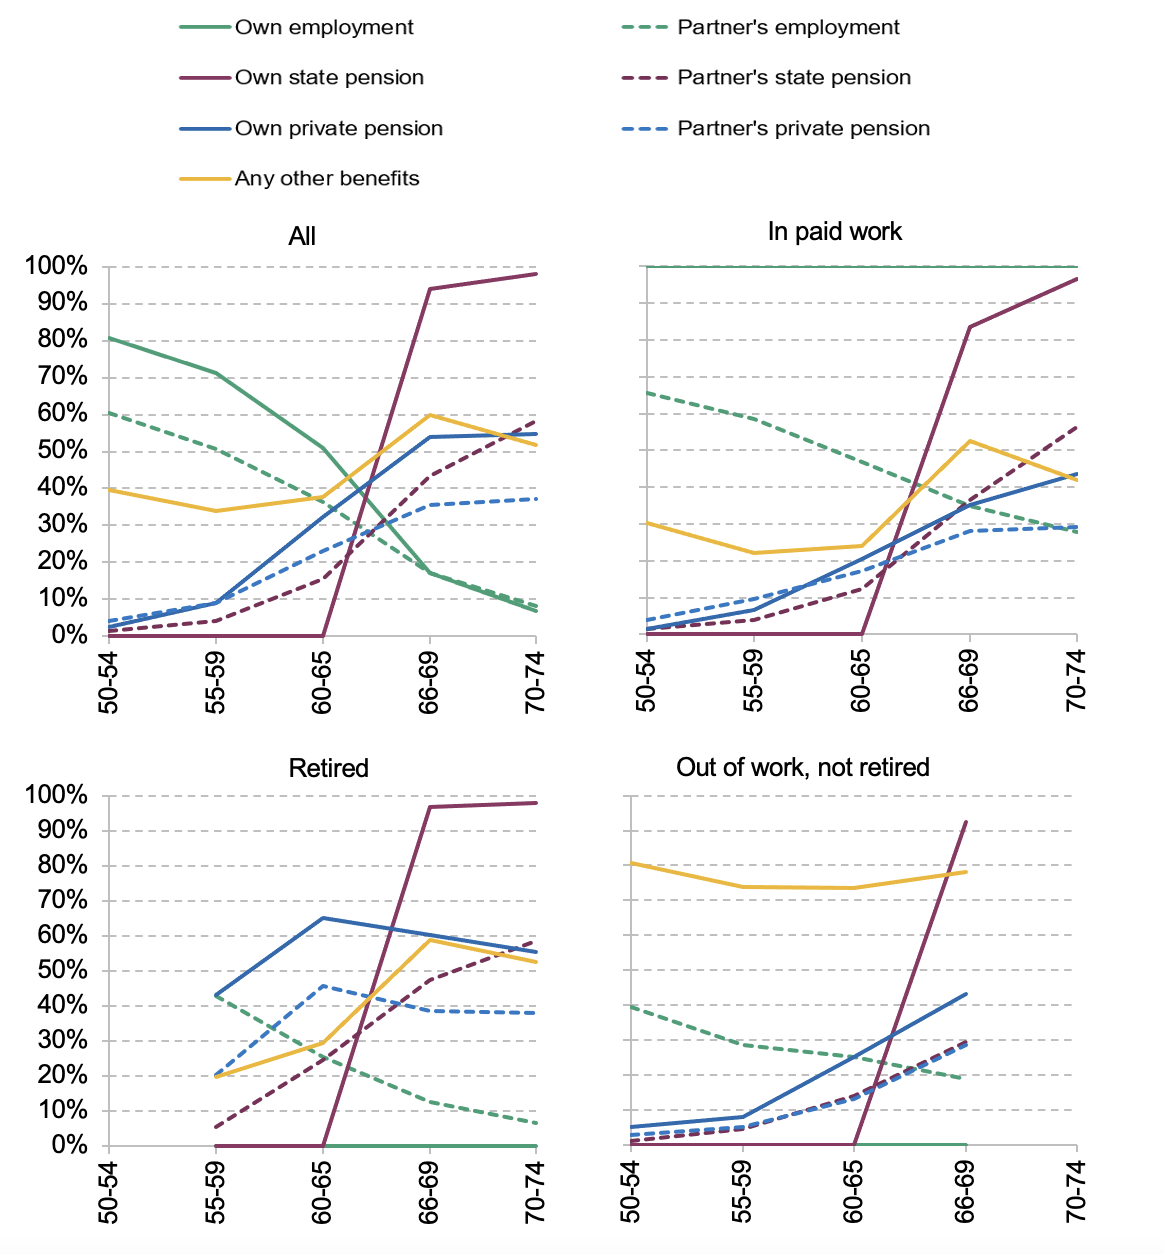
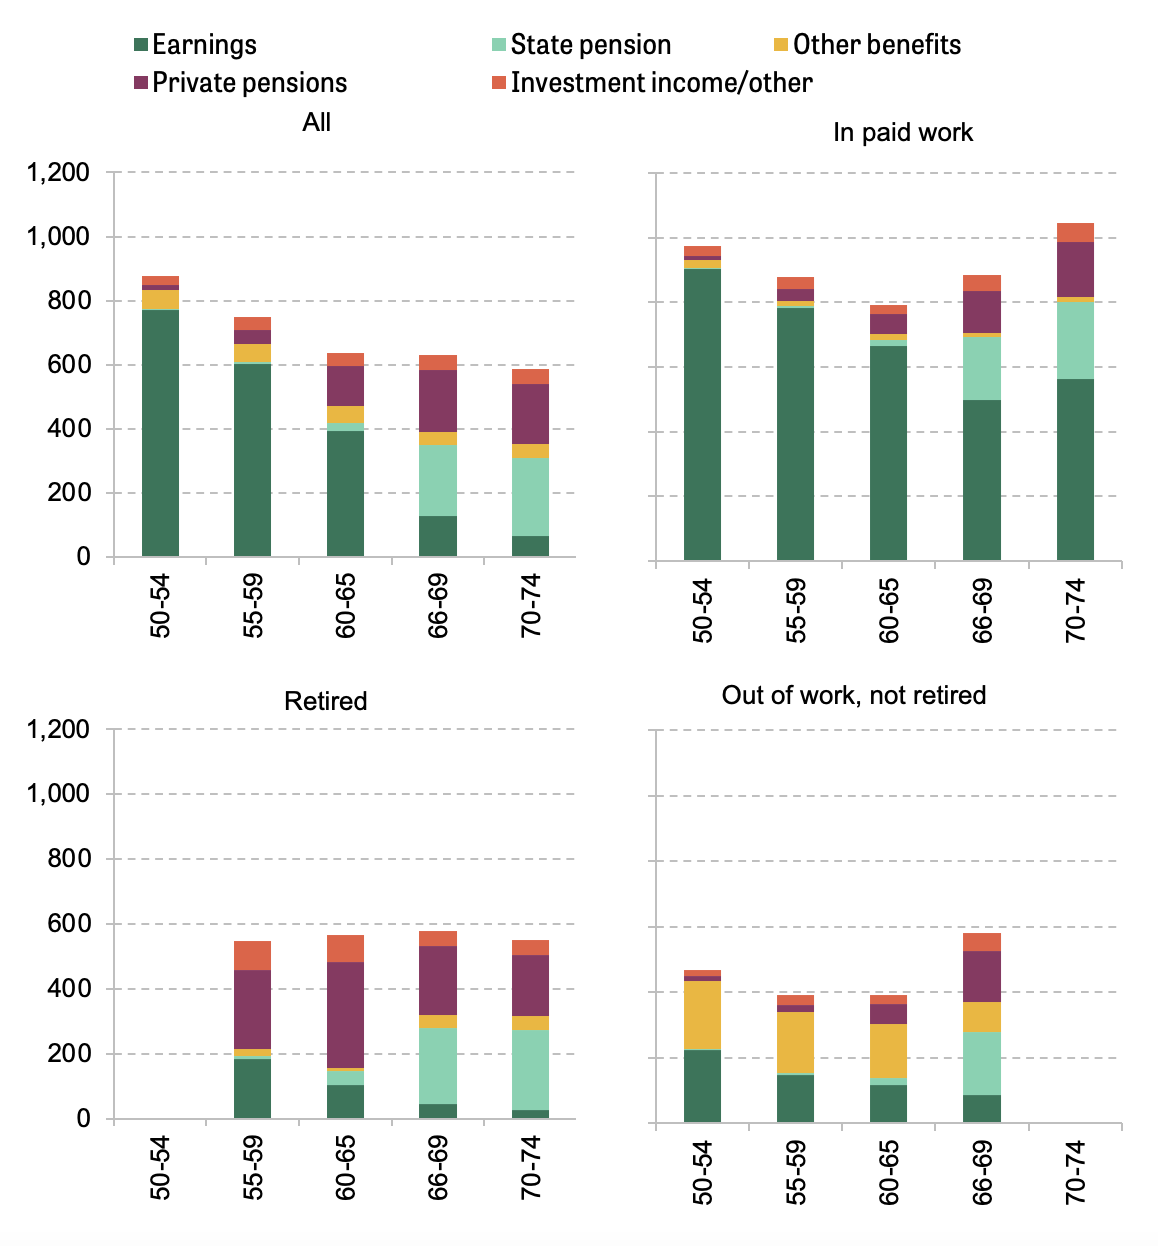
Figure 11 shows the proportion of people at different ages receiving income from different sources, for all people, and split by economic activity. In addition to this, Figure 12 shows the mean income from each source, by age and economic activity. The charts are fairly complex, but here are some of the key findings with regards to each group.
- All people. The patterns here are straightforward. The fraction receiving income from employment declines as people age. Many in their 50s also have a working partner. These patterns mean that when people are in their 50s, earnings from income are by far the most important income source. Once people reach their 60s many receive income from a private pension, and the vast majority receive a state pension once they reach state pension age at 66. Once over state pension age, in aggregate state and private pensions make up a large majority of income.
- Working people. The most important form of income for workers is their earnings. Figure 12 shows that earnings make up 83% of household income for workers aged 60–65. Although a significant minority of working people receive (non-state pension) benefits in their 50s, these are generally child benefit (23% of working people in their early 50s receive this) or small benefits received by a spouse over state pension age (such as the Christmas bonus), so they represent very small amounts of money compared to earnings. It is very common to draw a state pension from the state pension age even while working (84% do so aged 66–69, implying that around one in six people working over state pension age defer their state pension). 35% of working people in their late 60s also draw their private pension. 31% of working people in their late 60s combine incomes from paid work and their state and a private pension together.
- Retired people. Before state pension age, the most important income source for retired people is their private pension (almost two-thirds of retired people aged 60–65 have a private pension and it makes up 58% of mean income for this group). To a lesser extent, some have earnings from a spouse. Above state pension age, almost all receive income from a state pension, and around half receive income from their own private pension income.
- Out of work, not retired. There are two important sources of income for people out of work and not retired (most of whom are under state pension age): state benefits (excluding the state pension), which 70%–80% receive (and which make up 42% of income on average for this group aged 60–65), and a spouse’s earnings. The most common state benefits for this group are universal credit, employment and support allowance, disability benefits (such as personal independence payment), consistent with many being out of work for health-related reasons. Many also get council tax support, but in cash terms this benefit is much less important that the others.
Figure 13 digs deeper and looks at the fraction of income coming from each source across the income distribution. It examines people below state pension age (aged 50–65) and above (aged 66–74) separately, showing all people of these ages, and below, only those who are not in paid work (though they may have a working spouse). Below state pension age, middle- and high-income people rely overwhelmingly on earnings, while people with low incomes are much more reliant on state benefits. For those above the state pension age, the state pension makes up 70% of the income for the lowest-income fifth of 66–74 year olds, 45% for the middle fifth and even 20% for the highest-income fifth. These fractions are higher when only looking at those who have left employment. Above state pension age, income from private pensions is seen across the income distribution, but is particularly important for middle- to high-income people who have left work (making up 25% of income for the middle-income group and half for the highest-income group).
Overall, these results show how, although the UK state pension system means that no one can claim the state pension before age 66 (and most claim it as soon as they can get it, even if they are still in work), a large number of people around these ages have significant income from a variety of sources, with private pensions more important for older people, retired people and richer people, on average. And state benefits are especially important for people out of work (but not retired) before state pension age, particularly benefits related to health or disability. But for a sizeable minority, earnings, either from themselves or from their spouse, continue to play an important role for many even above state pension age, even as people draw a state pension and potentially a private pension.
Figure 11. Proportion of people with some family income from each source, by age, 2021–22, split by economic activity
Note: ‘Any other benefits’ excludes Winter Fuel Payment and Christmas bonus.
Source: FRS 2021–22. ‘Retired’ 50–54 year olds supressed due to low sample size. ‘Out of work, not retired’ for 70–74 year olds suppressed for the same reason.
Note: Incomes are not ‘equivalised’ (adjusted for household size).
Source: Author’s calculations using the FRS.
Figure 13. Proportion of disposable household income coming from each source, by equivalised income quintile, 2021–22
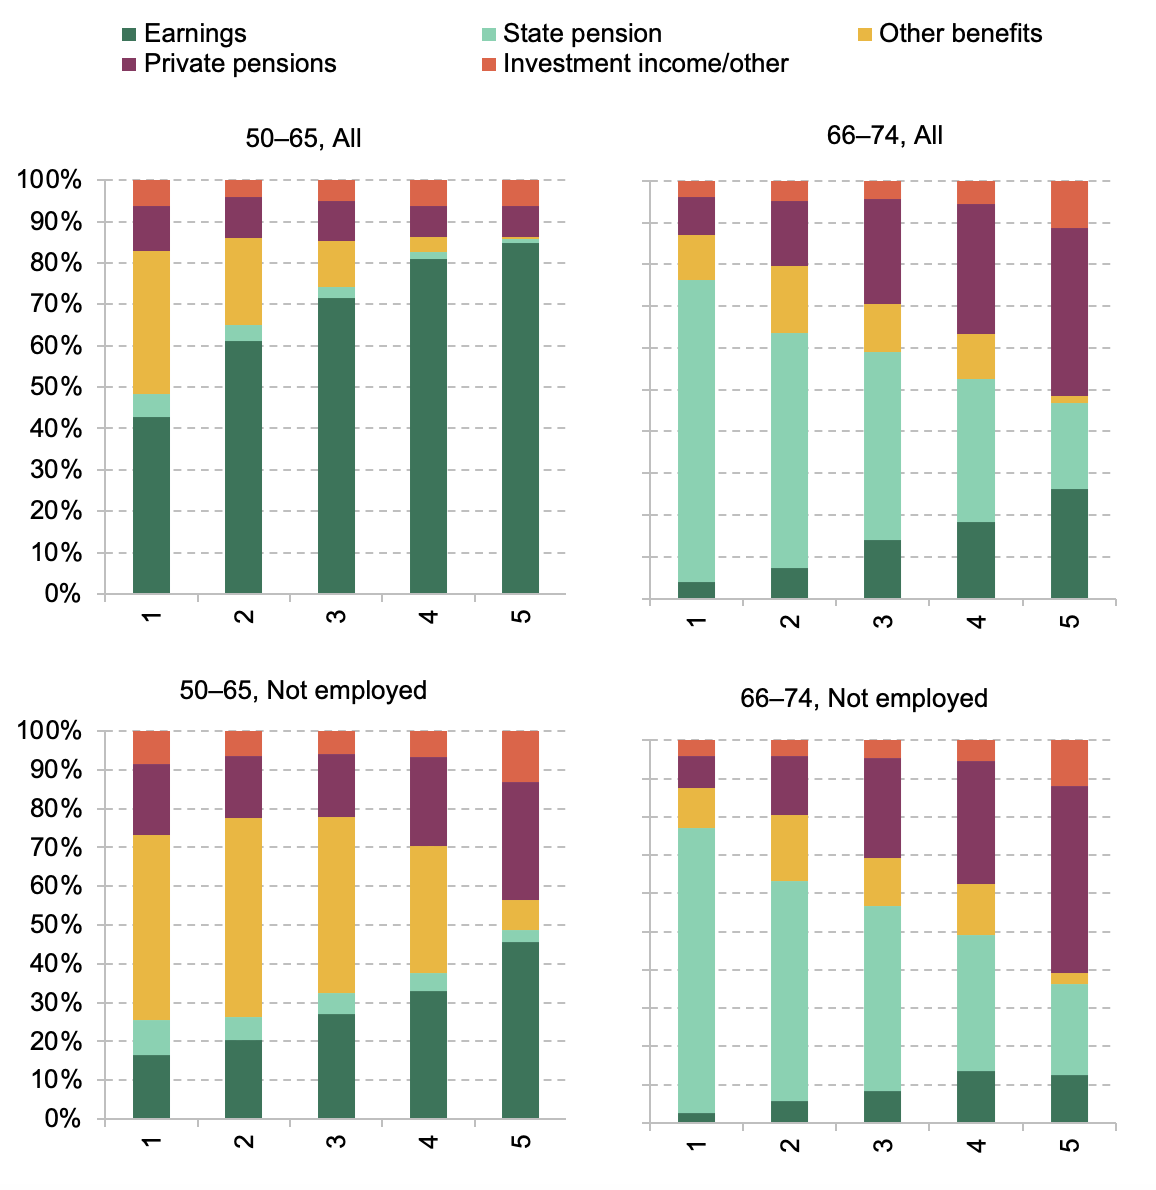
Note: Income quintiles are defined within the sample shown in each graph.
Source: Author’s calculations using the FRS.
4. Conclusions
This report has set out key facts and trends regarding the employment and retirement patterns of those approaching, and those above, the state pension age in the UK. Despite a lot of recent policy commentary regarding falling employment rates of older people since the COVID-19 pandemic, these are small in comparison to longer-running trends, starting in the mid-1990s, which have pushed up the employment rates of men and women. The patterns of employment and retirement, before and after state pension age, are shown to be radically different, not only because fewer people are employed, but because of the kinds of people who stay in work after state pension age.
For people in their late 50s and early 60s, employment rates are the highest for those with around average levels of wealth, with poorer people more likely to be economically inactive (but not retired) and richer people more likely to be retired. Above state pension age, it is those with higher levels of wealth that are more likely to stay on in paid work, though that is particularly likely to be either on low hours or in self-employment. These people are also more likely to draw a number of different incomes – as well as employment income, most will also draw their state pension, and a large minority will also be in receipt of private pension income.
It is hard to tell to what extent the relatively recent (post-pandemic) falls in employment rates for people in the run up to, and beyond, state pension age will persist. If retirement expectations data on people aged 40–54, albeit from before the pandemic, translate into changed behaviour, we can likely expect further rises in employment at older ages. From the perspective of policymakers, most would probably desire higher employment rates both before and after state pension age – this generates higher tax revenues and less call on the state for financial support. But it is notable that the trends in employment at older ages have not occurred in a way that would most obviously ease the strain on the state. Rather than the biggest employment increases being among low-income wealth individuals (who are most reliant on state benefits), it has occurred for middle-wealth people instead.
Figure A.1. Employment rates above state pension age (people aged 66–69 and 70–74), by characteristics, 2021–22
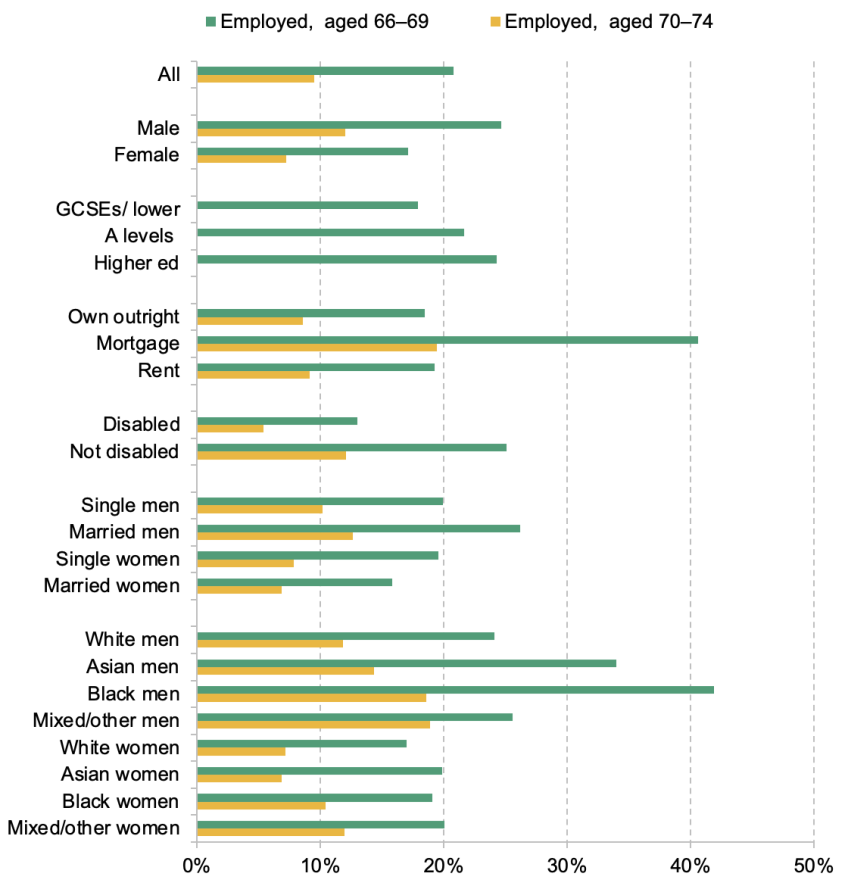
Note: Education is not measured for all people aged 70+ so we cannot examine employment rates by education for people aged 70+.
Source: Author’s calculations using the LFS.
Endnotes
Authors

Jonathan Cribb
Jonathan is an Associate Director and Head of Retirement, Savings and Ageing sector, focusing on pensions, savings and later-life economic activity.
More from IFS
Understand this issue


Policy analysis


Academic research


