Downloads
R126.pdf
PDF | 836.46 KB
Education spending is the second-largest element of public service spending in the UK behind health, representing about 4.5% of national income in 2015–16. As Figure 1.1 below shows, the level of UK education spending has also risen significantly in real terms over time. Growth was particularly fast from the late 1990s through to the late 2000s, with real-terms growth averaging about 5% per year between 1998–99 and 2010–11. Education spending has since fallen in real terms as spending cuts began to take effect from 2010 onwards. Between 2010–11 and 2015–16, it has fallen by about 14% in real terms, taking it back to the same level it was in 2005–06 and a similar share of national income to that last seen through most of the 1990s.
Whilst important, trends in this headline measure of education spending beg further key questions. How is spending spread across different stages of education and how has this shifted over time? We know that policymakers have increasingly focused on the early years, that school spending has been prioritised both in years of spending increases and in years of cuts, and that there have been successive reforms to the higher education funding system. How have these reforms affected the balance of spending per pupil or student across different phases of education? These questions are a vital component of the education policy debate and we seek to answer them in this report.
Please note: This report was corrected in August 2018 and some of the numbers relating to higher education spending have changed (all other numbers remain completely unaltered). Full details below.
Figure 1.1. UK education spending (2016–17 prices)
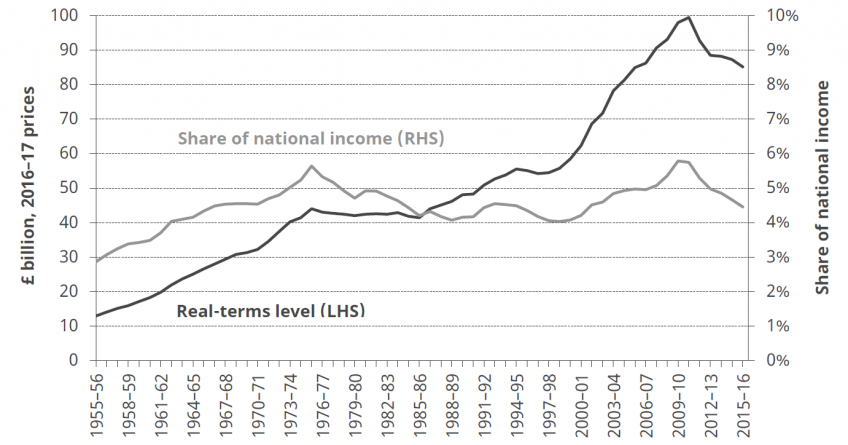
Source: HM Treasury, Public Expenditure Statistical Analyses 2016; previous PESAs; Office for National Statistics, Blue Book; authors’ calculations using PESA; HM Treasury deflators, November 2016, https://www.gov.uk/government/statistics/gdp-deflators-at-market-prices-and-money-gdp-november-2016-the-autumn-statement.
Corrections: Earlier this year, we noticed an error in our historical figures for higher education spending per student. We had incorrectly assumed that the introduction of tuition fees in 1998 represented additional resources for teaching. Instead, other elements of public spending on higher education were cut to leave overall resources per student largely unchanged. Because we also used historical growth figures to project resources per student before 1998, this error also had a substantial impact on our figures before 1998 too. For example, our estimates of resources per student have gone up from around £6,000 per student in 1990 to about £8,000 per student. We are grateful to the Office for Students for helping us correct this error. As part of this, we have also corrected some minor inconsistencies around deflators and actual fees levels after 2012. Changes to figures after 2006 are relatively small though. It is still the case that resources per student remain around £9,000 per student after 2012 and were substantially increased as a result of the 2012 higher education finance reforms.
Authors

Claire Crawford
Claire is a Research Fellow at IFS, working on the determinants and consequences of participation in childcare and education for parents and children.

Luke Sibieta
Luke is a Research Fellow at the IFS and his general research interests include education policy, political economy and poverty and inequality.

Chris Belfield
More from IFS
Understand this issue


Policy analysis


Academic research


