Over the second half of the twentieth century, government spending fluctuated between around 35% and 45% of national income, growing in real terms at an annual average rate of 2.7% between 1948–49 and 1999–2000. After a period of sustained increases in public spending over the 2000s, the financial crisis and associated recession in 2008 led to a sharp increase in spending as a share of national income. In response, the coalition government and the new Conservative government have acted to keep total public spending relatively flat in real terms, resulting in spending as a share of national income falling dramatically between 2009–10 and 2019–20. The Conservative government's latest plans are for total public spending to rise in line with national income in 2020–21.
What is total spending?
In the financial year 2014–15, the UK government spent £734.4 billion, or 40.6% of the UK’s national income. This translates into nearly £40,000 for every family in the UK.1 Total public spending is called 'total managed expenditure' (TME) and covers spending by the entire public sector – including central government, local authorities and public corporations. (See here for more information about the components of TME and how spending is planned.) Figure 1a shows TME in real terms (that is, after adjusting for economy-wide inflation) since 1948–49, including the latest forecasts. Figure 1b shows TME as a share of national income over the same period, also including the latest forecasts.
Figure 1a. TME in real terms, 1948–49 to 2020–21 (£ billion, 2015–16 prices)
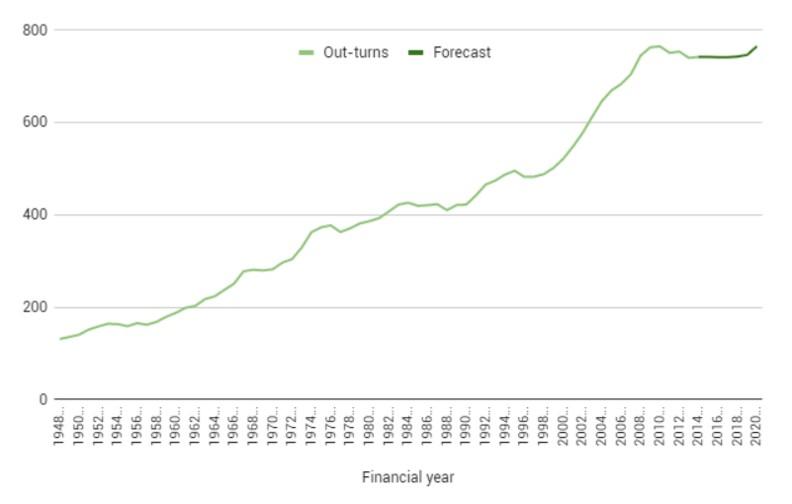
Note: TME is adjusted for £10 billion of investment due to the transfer of Royal Mail’s pension assets in 2012–13.
Source: TME is from the Office for National Statistics (ONS) series KX5Q and Office for Budget Responsibility forecasts (all available from the OBR's Public Finances Databank). Converted into real terms using the GDP deflator.
Figure 1b. TME as a share of national income, 1948–49 to 2020–21 (%)
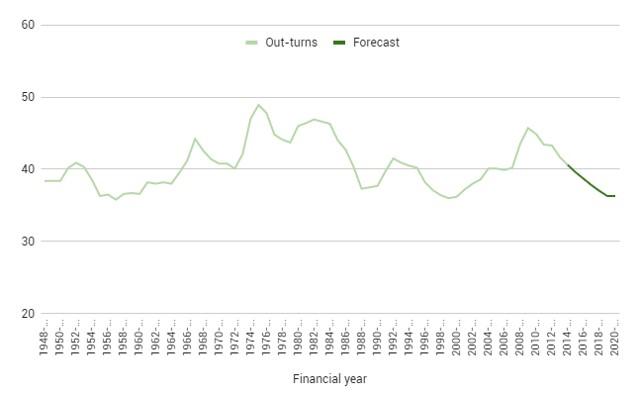
Note: TME is adjusted for £10 billion of investment due to the transfer of Royal Mail’s pension assets in 2012–13.
Source: TME is from the Office for National Statistics (ONS) series KX5Q and GDP is from ONS series BKTL. Forecasts are from the Office for Budget Responsibility. All available from the OBR's Public Finances Databank.
How has spending changed over time?
During the second half of the twentieth century, TME grew relatively steadily in real terms, with an average annual growth rate of 2.7% between 1948–49 and 1999–2000. Total spending then accelerated under the Labour government of the 2000s, increasing at an average annual rate of 4.3% between 1999–2000 and 2009–10. These increases stalled following the financial crisis and associated recession, as the coalition government restrained public spending. TME was cut by 2.7% between 2009–10 and 2014–15, and is planned to be broadly flat until 2019–20. Under the Conservative government's latest plans, total public spending will increase in line with national income in 2020–21.
Figure 2 uses an alternative measure of government spending – general government expenditure – to look at spending over a longer period. This is a narrower measure of government spending than TME because it excludes spending by public non-financial corporations, such as the formerly nationalised utilities.
Figure 2. General government expenditure as a share of national income, 1900 to 2000 (%)
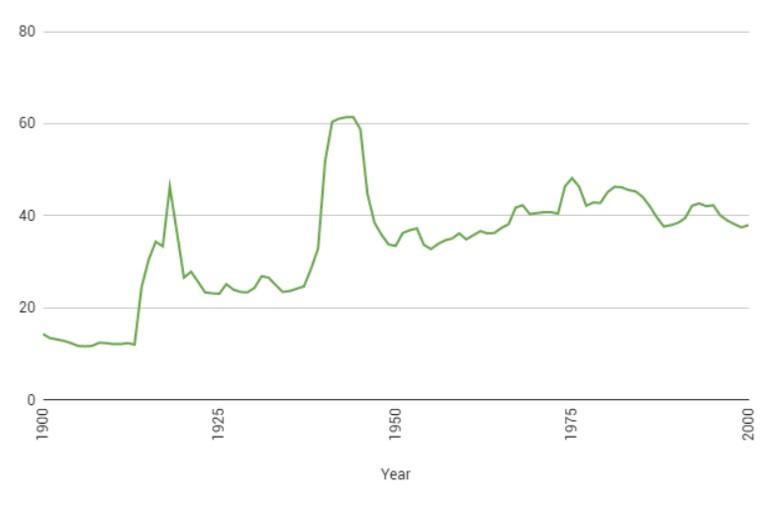
Source: T. Clark and A. Dilnot, ‘Long-term trends in British taxation and spending’, IFS Briefing Note 25, June 2002.
Why has spending changed over time?
Fluctuations in public spending can be driven by two factors: first, the natural variability of the economic cycle; and second, active policy decisions to curb or boost spending. Figure 2 illustrates two examples of the latter, as the two sharp spikes in general government spending coincided with the First and Second World Wars. General government spending as a percentage of national income was relatively low (below 30%) in the 1920s and 1930s, grew rapidly during the Second World War, and fell back to about 10 percentage points above its pre-war level in the 1950s. From the 1960s onwards, the fluctuations in the path of general government expenditure are very similar to those shown in Figure 1a and 1b for TME.
World wars and other active policy decisions are not enough to explain every fluctuation in spending shown in Figures 1 and 2. TME tends to rise as a proportion of national income during periods of economic weakness, which is particularly evident in the recession of the late 2000s in Figure 1, but also in the recessions of the early 1980s and the early 1990s. This happens both because recessions are associated with slow growth in national income and because certain components of public spending (for example, spending on social benefits and debt interest payments) tend to rise during recessions. The former makes the denominator of the fraction relatively small (particularly important during the late 2000s recession, as inflation was, and is, exceptionally low) and the latter makes the numerator larger. Conversely, during the boom of the late 1980s, the ratio of TME to national income fell.
Spending under Labour, 1997–98 to 2009–10
Changes in TME under the last Labour government between 1997–98 and 2007–08 are more easily explained with reference to active policy decisions than by the economic cycle. Labour came into power in 1997 having promised to stick to two years of Conservative spending plans (in 1997–98 and 1998–99), in an attempt to reform its reputation for poor fiscal management. It achieved an average annual real increase of 0.6% in those two years, compared with the previous government’s average between 1978–79 and 1996–97 of 1.5%. However, after these two years of restraint, there was a significant loosening of the purse strings.
Growth in public spending accelerated over the 2000s relative to the rate of growth seen in the second half of the twentieth century, even though it was a period of relative prosperity. Between 1999–2000 and 2007–08, Labour increased public spending by an average annual rate of 4.3%, targeting areas such as reducing child and pensioner poverty. Public spending rose as a share of national income but, as this was a policy choice rather than being driven by ‘natural’ variability of the economic cycle, it represented a structural increase in public spending.
In 2008–09, the financial crisis and associated recession drove up real government spending and led to a significant fall in GDP. Both of these factors led to a sharp increase in TME as a share of national income, from 40.2% in 2007–08 to 45.7% in 2009–10. The recession opened up a hole in the public finances – that is, a permanent increase in the difference between the government’s receipts and spending. IFS analysis has shown that with no policy change the UK’s public finances would have been on an unsustainable path.2 Instead, successive governments have introduced policies that increase tax revenues and cut public spending, in order to bring borrowing back to sustainable levels. For more detail on these recent spending cuts, click here.