
Downloads
Download 'The triple lock: costs and uncertainty'
PDF | 361.89 KB
Key findings
1. On Tuesday (12 September), the Office for National Statistics will release its estimate for average earnings growth over the three months from May to July 2023 compared with the same months in 2022. It is this figure that is typically used as the measure of earnings for the pensions triple lock and, because it is likely to be above both 2.5% and CPI inflation, it will probably determine next April’s increase in the state pension.
2. Since its introduction in 2011, the triple lock has increased the value of the state pension and the cost to the government of providing it. State financial support to pensioners is now greater as a result of the triple lock. Had the value of the state pension grown in line with either prices or earnings since 2011, it would now be around 11% lower than it is – a full new state pension would be worth around £180 per week, compared with the actual current amount of £204 per week. Compared with the state pension rising in line with prices or earnings, the government now spends an additional £11 billion per year on state pensions as a result of the triple lock.
3. The triple lock creates significant uncertainty regarding the state pension people might receive in the future. A full new state pension is currently equivalent to 25% of full-time mean earnings. If the triple lock is kept in place indefinitely, a reasonable range (occurring 80% of the time) for the value of the state pension in 2050 is between 26% and 32% of mean full-time earnings. In today’s terms, this would mean a range of £10,900 to £13,400 per year – a difference of £2,500 per year in today’s terms.
4. This uncertainty over the value of the state pension makes it harder for people to plan for retirement. Generating an income that would make up an additional £2,500 per year from state pension age (at 68) would cost at least £50,000–£60,000 today (and more in the future). An additional concern is that the triple lock increases the exchequer cost of providing the state pension to such a great extent that it leads to other reforms to control spending. Perhaps the most likely of these would be even greater increases in the state pension age, which would hit harder those who anticipate being in poorer health, are less able to remain in paid work, and are less likely to enjoy a retirement that stretches into older ages.
5. The triple lock also generates considerable uncertainty for the future level of public spending on the state pension. Based on our calculations, a reasonable estimate (taking place 80% of the time) for additional spending on the state pension in 2050 due to the triple lock, above and beyond earnings indexation, would be between £5 billion and £45 billion a year in today’s terms (taking into account the growing size of the pensioner population). This range is so large because of the uncertainty over the path of the state pension that the triple lock creates. This unpredictability makes it much more difficult for the government to plan future finances.
1. Introduction
On Tuesday (12 September), the Office for National Statistics will release its latest labour market statistics, which will include the growth in average employee earnings between the three months from May to July 2022 and the three months from May to July 2023. This number is likely to determine how much the state pension will rise by next April for over 12 million pensioners. Last month’s data (covering April to June 2023) showed annual earnings growth of 8.2%.1 Unless this falls dramatically in the next data release, or unless CPI inflation (currently at 6.8%) makes a sharp surprise upward turn in September, state pensions will rise next April in line with the earnings growth figure announced on Tuesday.
The reason why both earnings growth and inflation matter for the state pension is the pensions ‘triple lock’. In place since 2011 (except for a one-year temporary suspension in 2022), under the triple lock the state pension rises in line with the highest of CPI inflation, average earnings growth or 2.5%.
In this report, we first discuss how the triple lock has led to an increased level of the state pension, thereby increasing state financial support to pensioners at an increased cost to the government, over the last 13 years. We then present new analysis showing how the peculiar nature of the policy creates uncertainty around the level of the state pension for both current and future generations of pensioners. We also provide a concluding discussion.
2. What has the triple lock done?
Table 1 summarises how the state pension has risen (in cash terms) each year since the triple lock was introduced. By increasing the state pension in line with whichever is the highest of earnings growth, inflation or 2.5%, the level of the state pension ‘ratchets’ up over time. That ratchet effect has been particularly dramatic since the introduction of the triple lock, due to poor economic performance and the high level of economic volatility, with abysmal growth following the Great Recession, the Brexit referendum and the COVID-19 pandemic. Before this period of macroeconomic volatility, earnings growth was larger than both inflation and 2.5% in most years – this is what we would expect in normal times with household inflation around its 2% target and productivity improvements feeding through to above-inflation earnings growth. But in the 13 years since the triple lock was introduced (between April 2011 and April 2023), the state pension has risen in line with inflation six times, by 2.5% three times, and in line with earnings growth just three times. Overall, this has led to the state pension rising by 60% in cash terms between 2010 and 2023, compared with prices rising by 42% and earnings rising by only 40%. As noted above, it is likely that April 2024 will be the fourth time under the triple lock that the state pension rises in line with earnings.
This increase in the state pension implies an annualised 3.7% cash-terms growth rate and 0.9% real (i.e. after adjusting for inflation) growth rate from 2010 to 2023. Even under earnings indexation of the state pension (rather than the triple lock), in 2010 we would have expected the state pension to grow faster in real terms than it has, because long-run real earnings growth was expected to be higher than 0.9% per year. But the fact that real-terms growth of the state pension has not been higher ultimately reflects the poor economic record over the last decade-and-a-half.
A full new state pension, which can be received by those who reached the state pension age from April 2016 onwards, is currently worth £203.85. A full basic state pension, which can be received by those who reached the state pension age before that date, is £156.20. Both are, by default, currently linked to the triple lock. The triple lock has increased the amount of state financial support to pensioners: had the values of the basic state pension and the new state pension instead been determined by inflation or earnings growth since 2011, they would both now be around 11% lower, with a full new state pension worth around £180 per week and the basic state pension worth around £140 per week. This increased level of support means that the triple lock policy has also increased the total cost of the state pension for the government. Compared with the state pension increasing in line with prices over the same period (which has a very similar result to increasing it in line with earnings), the government now spends an additional £11 billion per year on state pensions as a result of the triple lock policy.
Table 1. Triple lock indexation since its introduction
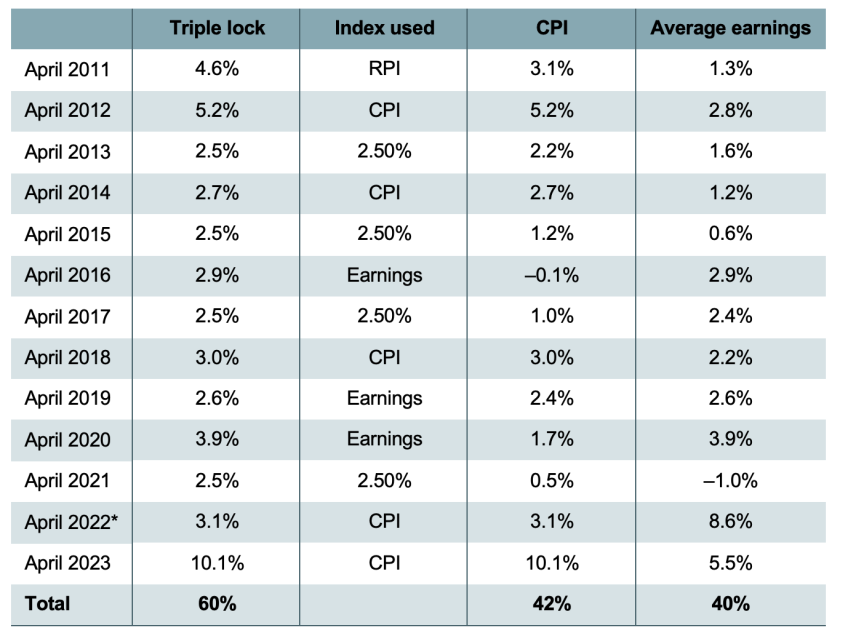
* The triple lock was suspended in April 2022 because of dramatic growth in earnings in Summer 2021 caused by the unwinding of the effects of the furlough scheme (Coronavirus Job Retention Scheme).
Note: Indexation was in line with the Retail Prices Index (RPI) measure of inflation in 2011, before the government moved to Consumer Prices Index (CPI) indexation of state benefits and public pensions.
Source: Updated from Thurley and McInnes (2020) using Office for National Statistics, https://www.ons.gov.uk/employmentandlabourmarket/peopleinwork/earningsandworkinghours/datasets/averageweeklyearningsearn01 and https://www.ons.gov.uk/economy/inflationandpriceindices/bulletins/consumerpriceinflation/july2023.
With the introduction of the new state pension in 2016 (and, to a lesser extent, the implementation of the triple lock), the value of the state pension compared with average earnings has also risen significantly (see Figure 1). In 1979, the basic state pension was worth 26% of average (mean) full-time weekly earnings. In the Social Security Act 1980, Margaret Thatcher’s government broke the ‘earnings link’ and instead moved to price indexation of the state pension. As the economy and earnings subsequently grew, this led to a substantial decline in the level of the state pension as a percentage of earnings. With the policy of price indexation of the state pension, retained during the period of New Labour governments, it fell to less than 16% of earnings in 2008. But the introduction of the new state pension, aided to a lesser extent by the triple lock and a period of very poor earnings growth relative to inflation and 2.5%, has reversed this trend, with the new state pension in 2022 worth almost 25% of average full-time earnings, the highest level since 1980 and close to its record high as a fraction of earnings.
Figure 1. Basic state pension and new state pension as a share of average full-time weekly earnings
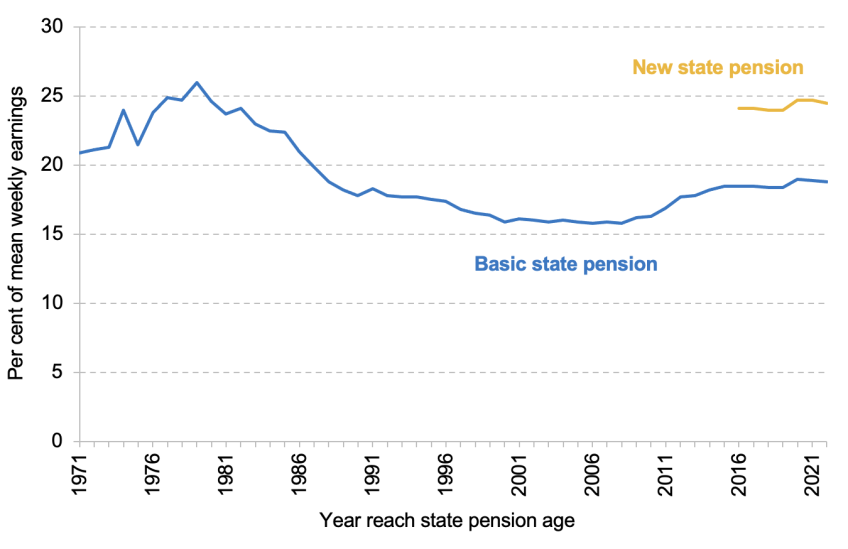
Source: DWP abstract of benefit rate statistics: 2022.
3. Uncertainty over what state pension people will receive
The triple lock has resulted in a higher state pension and substantial additional government spending on the state pension over the last 13 years compared with obvious alternative indexation policies, mostly due to the high levels of macroeconomic volatility seen in that period. But the triple lock also generates high levels of uncertainty over the future level of the state pension. This is again because of the ratchet effect – any one year of macroeconomic volatility that increases the level of the state pension relative to earnings or prices is permanently locked in, which means a higher starting point for the state pension (and state pension spending) for all future years. In other words, the level of the state pension in a decade’s time will not depend solely on the rate of earnings growth, or inflation, over that period but also on how volatile earnings growth and inflation are, how the volatilities of growth in earnings and growth in prices are correlated, and how the levels of earnings and price growth compare with 2.5%.
Figure 2 shows new estimates of the modelled volatility of the new state pension under the triple lock policy from 2024 to 2070, expressed as a share of mean full-time earnings. The figure is based on simulations of potential outcomes of the triple lock using historical data on inflation and earnings from 1993 to 2023.2 It shows the projected median (50th percentile), 10th and 90th percentiles of the ratio of state pension to average earnings if the triple lock is kept in place. If the period between 1993 and 2023 is representative of what we can expect going forwards, then we can anticipate that with 10% probability the state pension will be worth less than the 10th percentile, and with 10% probability it will be worth more than the 90th percentile. We have shown the outcomes until 2070, as that is when (under current legislation) current 21-year-olds entering the labour market would reach their state pension age of 68.
It is worth noting that the outcome of this analysis is sensitive to which period of historical data we use. In the period from 1993 to 2008, average earnings growth was above inflation in all but one year. Since then, we have had 10 years where average earnings growth was lower than CPI inflation and/or 2.5%. The Office for Budget Responsibility (2023) estimates that the ‘triple lock wedge’, the amount by which the state pension increases each year on average relative to average earnings growth, is 0.58 percentage points when estimated based on data since 1993, but 1.04 percentage points when estimated based on data since 2011.
Figure 2. Value of the new state pension relative to mean full-time earnings: 10th, 50th (median) and 90th percentiles of simulated outcomes from 2024 to 2070
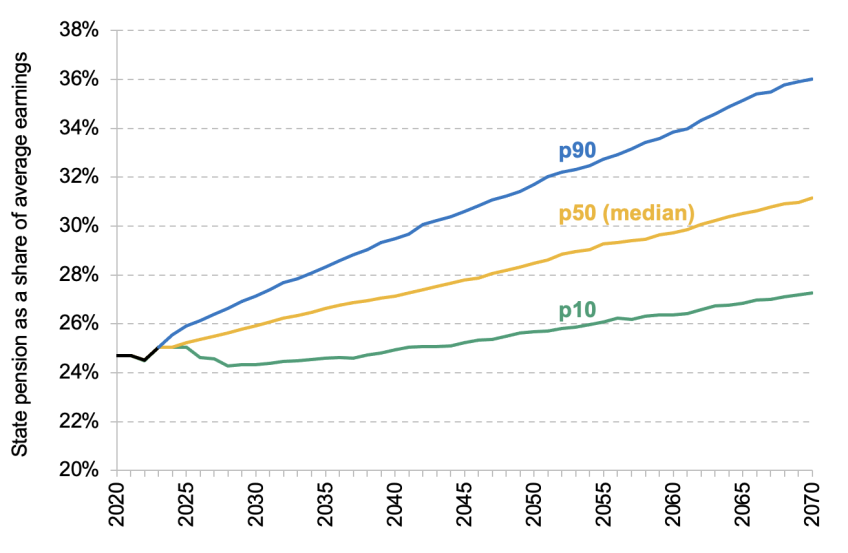
Note: Estimates of the modelled volatility of the new state pension under the triple lock from 2024 to 2070, as a share of average earnings. Based on drawing 1,000 independent series of potential outcomes of the triple lock using historical data on inflation and earnings from 1993 to 2023. While the triple lock means that the value of the state pension cannot drop below the previous year’s level relative to earnings, we include in the simulation 2022 where the triple lock was suspended. Years 2020–23 are out-turn data.
Source: Authors’ calculations using ONS CPI data series, ONS Average Earnings Index for 1993 to 2000, ONS average weekly earnings statistics for 2001 to 2023 and DWP abstract of benefit rate statistics: 2022.
First, Figure 2 shows how, for all three points of the distribution shown, the value of the state pension continues to rise relative to earnings over time. This is because, unless the triple lock is temporarily suspended as it was in 2022, the value of the state pension is always at least stable relative to earnings. And because of the ratchet effect, any rise in the value of the state pension relative to earnings is locked in for all future years.
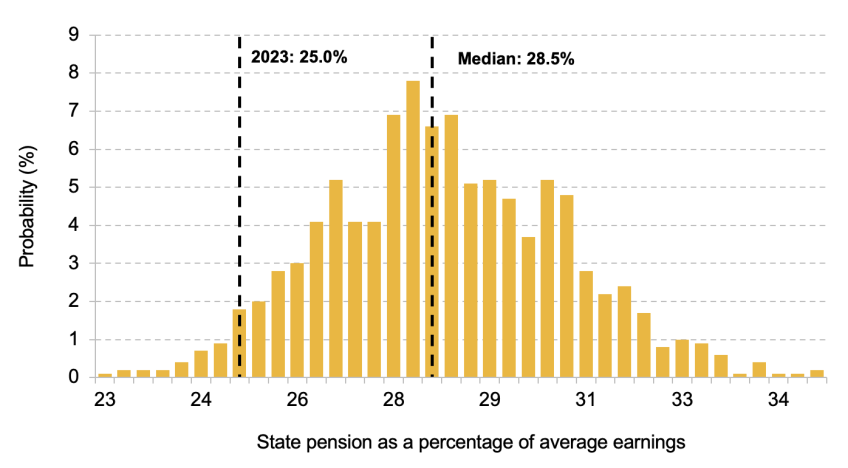
Focusing on the year 2050, which is when today’s 41-year-olds will (under current legislation) reach their state pension age of 68, Figure 2 – and Figure 3 – show that the 10th percentile is 26% of average earnings, implying there is a 10% chance the state pension in 2050 will be worth less than this amount. The median is 28% and the 90th percentile is 32%. This implies that there is a 10% chance that the state pension is worth more than 32% of mean full-time earnings by 2050. In other words, a reasonable range (occurring 80% of the time) for the value of the state pension in 2050 is between 26% and 32% of mean full-time earnings. Based on today’s average earnings and state pension, this would mean a range of £10,900 to £13,400 per year (compared with a current full state pension of £10,600).3 Figure 3 shows the full distribution of potential outcomes for the year 2050.
Together, Figures 2 and 3 illustrate the extent of volatility in the future level of the state pension, and thus future spending on the state pension. Based on our calculations, a reasonable estimate (taking place 80% of the time) for additional spending on the state pension in 2050 due to the triple lock, above and beyond earnings indexation, would be between £5 billion and £45 billion a year in today’s terms (taking into account the growing size of the pensioner population). The longer the current period of macroeconomic volatility continues, the more likely it is that the cost of the triple lock is towards the higher end of this range.
Figure 3. Value of the new state pension relative to mean full-time earnings: distribution of simulated outcomes in 2050
Note: For notes and source, see Figure 2.
Uncertainty around the future level of the state pension is not just an issue from the perspective of government spending, but it also makes planning for retirement more difficult for individuals. If a working-age person today wanted to make sure that at state pension age they reach a specific level of income from pensions relative to average earnings, they would at least need to know how much of that income will come from the state. This is even before all of the uncertainty about how much income in retirement any private saving will generate. Using the same reasonable range for 2050, the difference between the 10th and 90th percentiles of state pension income in 2050 is £2,500 per year in today’s terms. Generating that amount of income from private saving (by purchasing an annuity with payments that are guaranteed until death and increase in line with prices) would cost approximately £50,000–£60,000 at today’s annuity rates (assuming a rate of 4.5% to 5% in line with current annuity rates).4 This means that in order to reach a specific standard of living in retirement relative to average earnings, those reaching the state pension age in 2050 (i.e. those currently in their early 40s) may need to accumulate an additional £50,000–£60,000 of savings in today’s prices under different triple lock scenarios.
The inherent uncertainty around the cost of the triple lock also goes beyond these figures. The triple lock could lead to the state pension in its current form becoming sufficiently expensive that policymakers respond by implementing reforms that they would not otherwise have done, to reduce spending on the state pension. Perhaps the most likely of these would be even greater increases in the state pension age, which would hit harder those who anticipate being in poor health and therefore less able to remain in paid work and less likely to enjoy a retirement that stretches into older ages. The possibility of such reforms also generates further uncertainty for working-age individuals trying to plan well for retirement.
4. Summary
The triple lock increases the state pension over time relative to both earnings and prices. Resulting from the introduction of the new state pension in 2016 and (to a lesser extent) the triple lock, the new state pension is now worth as much as a share of mean full-time earnings (25%) as the basic state pension was when price indexation was introduced and the link between the basic state pension and average earnings was broken in 1980.
Our new analysis also shows that the triple lock creates uncertainty for individuals and for the public finances. There is a wide range of potential future levels of a triple-locked state pension as we do not know how volatile inflation and earnings growth will be. This uncertainty makes it difficult for individuals to plan appropriately for retirement because it makes it especially hard to know what level the state pension might be. This also creates substantial uncertainty for the future public finance cost of the state pension.
Finally, an additional real risk for individuals is that retaining the triple lock for too long increases state pension spending so significantly that it leads to insurmountable pressure for a much higher state pension age. This would particularly affect people with poorer health who struggle to remain in employment until they reach state pension age.
Endnotes
Authors

Jonathan Cribb
Jonathan is an Associate Director and Head of Retirement, Savings and Ageing sector, focusing on pensions, savings and later-life economic activity.

Carl Emmerson
Carl, a Deputy Director, is an editor of the IFS Green Budget, is expert on the UK pension system and sits on the Social Security Advisory Committee.

Heidi Karjalainen
Heidi is a Senior Research Economist in the Retirement, Saving & Ageing sector. Her current research is on pensions and saving for retirement.
More from IFS
Understand this issue


Policy analysis


Academic research


