
Downloads
Download report PDF
PDF | 2.52 MB
Executive summary
This report uses data on food and non-alcoholic drink purchases from shops, takeaways, restaurants and other outlets to analyse how the diets of a large, representative panel of households in Great Britain evolved 15 months before and up to 24 months after the start of the onset of the COVID-19 pandemic in March 2020. The report extends previous work by O’Connell, Smith and Stroud (2022), which documented a substantial and sustained increase in calories purchased for consumption at home for the average household, more than offsetting reductions in calories purchased for consumption on-the-go during the first year of the pandemic. This report also examines whether households with and without children have different purchasing patterns.1
Key findings
1. After increasing during the first year of the pandemic, in 2020, calories purchased for at home consumption remained higher in 2021 than pre-pandemic, in 2019. In the first quarter of 2021, households were on average purchasing 295 (or 16.5%) more calories per day than in the first quarter of 2019. By the beginning of 2022, calories purchased into the home were back to their 2019 levels.
2. Calories purchased for at-home consumption became less healthy through 2020, with 54% of calories coming from less healthy sources in the latter half of that year, compared to 52.6% in 2019 Q2. By the end of 2021, the share of calories coming from less healthy sources had, like the overall number of calories, returned to their pre-pandemic level.
3. In 2019, 2020 and 2021, there is a strong income gradient in the healthiness of diets as measured by the average nutrient profiling score across all of their purchases. Richer households purchased more healthily than poorer households; their average nutrient profiling score is lower. Households with children have slightly higher nutrient profiling scores than households without children.
4. The number of calories purchased for consumption outside of the home decreased on average and remained low into the first half of 2021. After this point, they recovered to roughly their 2019 level.
5. When sources of out-of-home calories are examined, calories from fast food and takeaway outlets rose both in absolute terms and as a share of out-of-home calories consumed. By the end of 2021, they accounted for almost half (47%) of calories compared to around a third in 2019. While fast food and takeaways remain the largest source of out-of-home calories for households both with and without children, they maintained more of an elevated share for households with children, at 55% versus 44%.
1. Introduction
The COVID-19 pandemic disrupted many aspects of people’s lives. It led to significant changes in where people worked, ate, socialised, and how they spent their time. The sudden social changes associated with the lockdown measures compounded this shock by disrupting many of the formal and informal ‘safety nets’ that support family nutrition, such as face-to-face schooling, community groups and family gatherings.
These changes have had a meaningful impact on dietary choices. On average, households in Great Britain purchased around 280 extra calories’ worth of food per adult each day between March and July 2020, falling to a still-substantial 150 extra calories per adult per day between July and the end of that year (O’Connell et al., 2022). The first year of the pandemic also saw major changes in the composition of households’ food purchases. Whilst purchases of fruit and vegetables, snacks and treats, ingredients and ready-to-eat foods all increased, the biggest shift came in calories from ingredients. Calories from snacks and treats and ready-to-eat foods did not rise by as much. The large increase in purchases of ingredients meant that other food groups either remained flat or fell as a share of purchases; see figures 5.1(b) and 5.3(c) in O’Connell et al. (2022). Related work shows that the initial spike in spending at the onset of the pandemic was related to households stockpiling staples and household supplies (O’Connell, De Paula and Smith, 2021). Later on, higher spending was driven by ‘discretionary calories’ such as alcohol, desserts, confectionery and sugary drinks. Wealthier households exhibit larger demand spikes.
The scale of the long-term impact of these changes will depend, in part, on whether they represent a permanent shift in households’ food purchasing patterns or a shorter-term (but still large) disruption in response to the original lockdowns and re-openings. In this report, we carry forward the analysis by documenting how families’ food purchases changed throughout the pandemic, up to April 2022. We consider overall calories, total spending on food, and also the healthiness of shopping baskets, as measured by the nutrient profiling score. The calculation of the score is given in Department of Health (2011) and is outlined in Appendix F.
Given the well-documented impact of the pandemic in increasing many inequalities (Blundell et al., 2021), we also explore whether the changes in food purchasing throughout the pandemic were especially strong for particular groups. We focus on two potentially important dimensions of inequality: unequal impacts by socio-economic status (as measured by household income), and differences across families with and without children.
The rest of the report is structured as follows. We begin in Section 2 with a discussion of the data used, including their limitations, followed by a description of the methodology and the analysis sample. Section 3 begins by examining the impact on at-home calorie purchases and their healthiness before moving on to out-of-home calories purchases and their sources. Section 4 proceeds to look at calorie purchases by households with and without children, before Section 5 concludes.
2. Data and methodology
2.1 Data
In this report, we focus on households’ purchases of food and non-alcoholic beverages (which we sometimes refer to as ‘food’ as a shorthand). We use two datasets collected by the market research firm Kantar, covering the period from January 2019 until March 2022 (Kantar, 2020).
To capture household purchases, we use the Kantar Worldpanel fast-moving consumer goods (FMCG) panel, covering roughly 30,000 British households. The Take Home data cover food and beverage products purchased for ‘at-home’ consumption from nearly all sources, including all supermarkets and grocery stores, corner stores and convenience stores, and smaller-scale vendors such as fruit stalls, markets and milkmen. Importantly for the pandemic period, the data capture both in-person and online purchases. To record their purchases, Kantar FMCG members scan the barcodes of all food and drink purchases brought into the home.2 These barcode-level data mean that the FMCG panel records very detailed product characteristics, including price, package size, nutrition information and calories.
We complement the Take Home data with a second dataset: the Out of Home (OOH) panel. The OOH panel is a subset of the main panel that targets around 7,500 individuals and records their purchases of food for ‘out-of-home’ consumption. This includes food eaten ‘on-the-go’ (which could have been purchased at the same sources as for at-home consumption) as well as food from restaurants and takeaways. Individuals record their purchases on a mobile phone app and can take part in the OOH panel from the age of 13. Multiple individuals from the same household can be selected to take part in the OOH panel, though in OOH data from 2019 over 85% of households only have one member represented. A further 13% have two household members recording, and the remaining have more than two members recording. In households with more than one member appearing in the OOH data, we aggregate purchases to the household level, as in O’Connell et al. (2022).3
The information in the OOH data is somewhat more limited than in the FMCG panel; in particular, we do not have information on calories or nutritional details for these purchases. We instead use data from the Office for National Statistics’ Living Costs and Food Survey (LCFS) to estimate the calories of these out-of-home purchases (Office for National Statistics, 2024). The LCFS collects information on spending patterns and cost of living for a representative sample of UK households. It also has nutritional information from food diaries.
Finally, the Kantar data include an annual snapshot of household demographic information. These household data include the gender and age of all household members, the household’s income, and additional characteristics of the main shopper, such as their age, gender, ethnicity and employment status.
While the Kantar data are broadly representative of the population of Great Britain, some minority groups are under-represented (Leicester and Oldfield, 2009a, b). However, Leicester and Oldfield (2009b) and Griffith and O’Connell (2009) show that conditioning on households that regularly report expenditure ensures that Kantar’s data are consistent with other data sources.
The Kantar data are exceptionally rich and provide a detailed, high-frequency picture of households’ food purchases over time. However, there are some important limitations. The data capture the purchase of food and non-alcoholic beverages, but not necessarily their consumption. This means that we can analyse the costs and nutritional make-up of households’ food shopping baskets, but not their diets. Further, the Worldpanel data are collected at the household level, meaning that we cannot see which household members purchase particular items.
In the OOH data, the challenge is the opposite – individual-level information is collected but we do not have purchases that cover the whole household. Without information on the out-of-home purchases of the rest of the household, costs in these data are not directly comparable to the household-level Take Home data. The OOH data are also more limited in the information they contain on purchased foods. In particular, without direct information on their purchases’ nutritional value, we need to use LCFS data to impute nutrition information (see Appendix A for further information).
2.2 Methodology
Our focus is on documenting how households’ food purchases evolved during the pandemic period up to March 2022. To provide a pre-pandemic baseline, we compare purchases to 2019 levels. We are interested in several aspects of households’ shopping baskets: their overall cost; their overall caloric value; and their nutritional profile, as measured by the nutrient profiling score.4
In order to ensure that costs are comparable over time, we adjust spending to January 2019 prices using monthly data from the consumer prices index. Similarly, to ensure that calorie counts are comparable across households of different sizes, we equivalise calories to reflect household composition. This uses an established formula based on the age and sex of each household member and the associated reference intake.5 We show in Appendix B that our primary results are similar when not equivalising calories.
Our analysis is focused on food and non-alcoholic beverages. Because the OOH data do not capture spending on alcohol outside the home, we follow O’Connell et al. (2022) in excluding alcohol from our analysis of Worldpanel purchases.6 Also, as mentioned above, we follow O’Connell et al. (2022) in using data from the LCFS to impute nutritional information about out-of-home food purchases, which is not available in the Kantar data.
2.3 Analysis sample
Approximately 30,000 households report their at-home food purchases to Kantar across any given year. A subset of these households also report their out-of-home purchases.
We make several restrictions to our analysis sample. First, we impose a requirement that households are well-behaved reporters. Following previous work with the Kantar data (see O’Connell et al., 2022), we remove any household year–months that coincide with a period of more than 14 days in which no home shopping is recorded, as these are very likely to be periods when the household is on holiday or not reporting for some other reason. We further remove outlier households, which we define as those whose mean yearly calorie purchases are below the first percentile, or above the 99th percentile, of the 2019 calorie purchase distribution. Finally, we restrict the sample to households that are consistently present, requiring that they are present in the data for at least four weeks before and after the onset of the pandemic.
In addition to periods of non-reporting, there is also attrition from the FMCG panel. Households who leave the panel have main shoppers who are generally younger and have children present. Kantar aims to balance these outflows out through targeted recruitment into the Worldpanel data. However, to ensure that our analysis of time trends in household purchasing behaviour is not affected by changes in the composition of the panel, in the main part of the report we focus on the balanced sample of households.
Finally, we exclude households where the main shopper is older than 65 years or there are more than two adults. This sample restriction ensures that our analysis comparing the behaviour of households with and without young children looks at a more similar group of households (rather than comparing younger parents with children with, for example, disproportionately older and retired households).7
2.4 Summary statistics
Table 2.1 presents summary statistics for the final at-home and out-of-home analysis sample. The at-home sample contains 7,431 households that purchase on average 1,966 calories per adult equivalent, per day. The average household spends £25 per week per adult equivalent on at-home food and non-alcoholic drinks.
Table 2.1. Summary statistics for the analysis sample
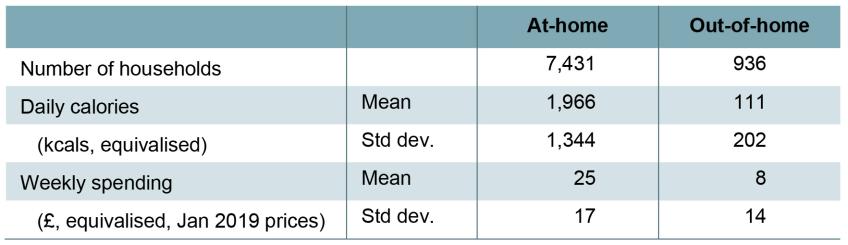
Note: Values equivalised relative to adult reference intake of calories. Statistics based on Kantar Worldpanel Take Home and Out of Home data.
Our final out-of-home sample contains individuals from 936 households.8 These individuals purchase on average 111 calories per day on-the-go (per adult equivalent) and spend £8 a week per equivalent adult.9
Appendix D repeats the analysis in Table 2.1 for the full sample available to us, as well as the sample imposing a balanced panel restriction. Overall, we find that calories and weekly spending look similar across all three samples for the Take Home data. In the OOH panel, spending and calories are both roughly twice as high in the analysis sample as in the unrestricted sample. This suggests that households with few (reported) out-of-home purchases are less likely to remain in the panel throughout the 2019–22 period we consider.10
3. Results
3.1 What were households buying to eat at home?
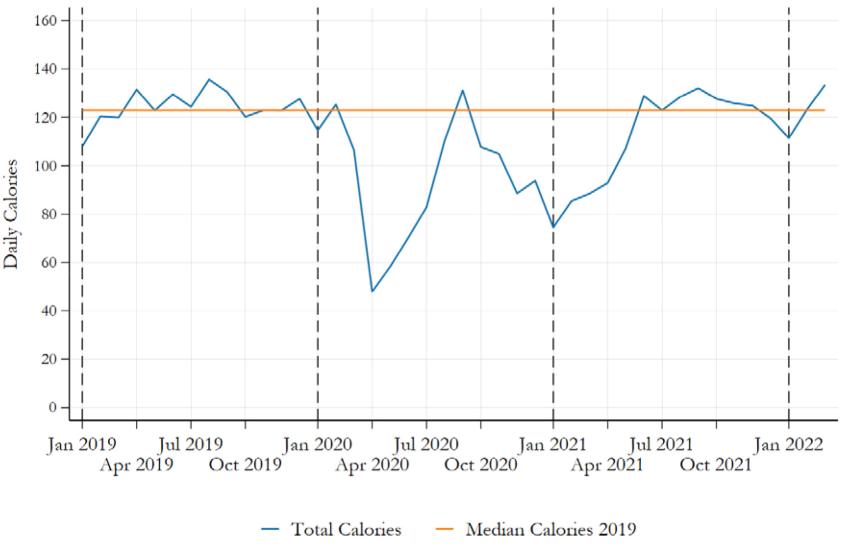
Figure 3.1 shows the evolution of average calories from food and non-alcoholic beverages bought into the home in 2019, 2020, 2021 and early 2022.11 Previous research gives a sense of the contribution that calories consumed at home make up of overall consumption. Data from the LCFS show that in 2018, at-home calories accounted for 90% of total household calories (O’Connell et al., 2022).
Figure 3.1. Total at-home calories
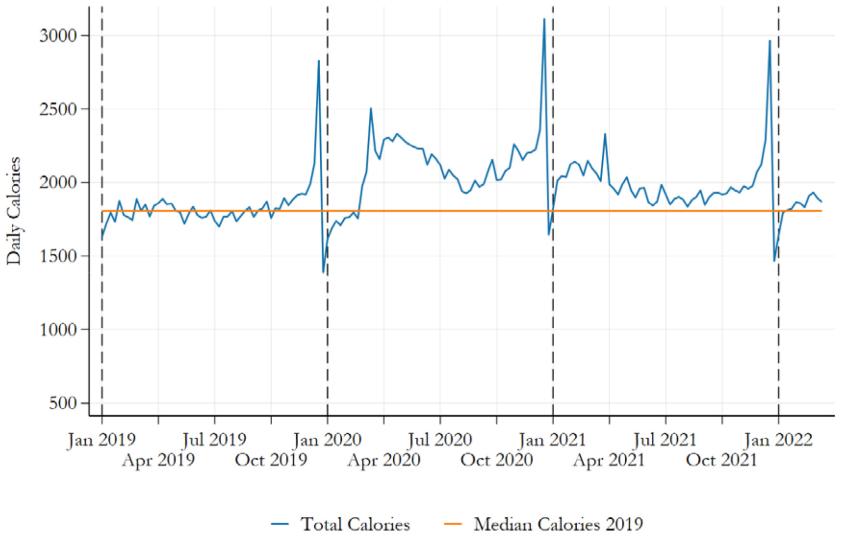
Note: Based on Kantar Worldpanel Take Home data for January 2019 to March 2022. The orange line represents median calories in 2019. Calories are measured at the household level, but shown here as per adult equivalent.
One immediately striking pattern from Figure 3.1 is the amount of variation in calories purchased throughout the year, particularly for purchases into the home. Food purchases spike in December, over the winter festive season.12 The 2019 data reflect a regular, recurring pattern in pre-pandemic years, as highlighted in previous work (Cherchye et al., 2020).
However, the pandemic period saw both the level and the pattern of food purchases over the course of the year change. In 2020, a relatively normal first quarter was followed by substantially higher at-home calories in Q2 (coinciding with the first national lockdown); O’Connell et al. (2022) find that overall calories purchased during Q2 of 2020 increased by 280 calories per equivalent adult per day. This large increase in extra calories roughly halved during the latter half of the year (which included the second national lockdown in November 2020). In our restricted, and younger, sample, the increase in calories purchased during Q2 of 2020 is larger, at around 400 calories per equivalent adult per day.
The first quarter of 2021, which brought the third national lockdown and the second period of school closures, saw changes in food purchasing that look similar to the first national lockdown. Per adult equivalent, the average household purchased an extra 295 calories per day (16.5%) more than in 2019. However, during the rest of the year, at-home food purchases fell back and became more similar to their pre-pandemic level. In the second half of 2021, the average household bought around 105 daily additional calories per equivalent adult; by the first quarter of 2022, this fell further to around 60. So, while at-home purchasing remains somewhat elevated compared with before the COVID-19 pandemic, there is evidence that the bulk of the increase seen at the start of the pandemic was transient.13
3.2 How healthy were calories bought to be eaten at home?
So far, we have documented significant disruption in food purchasing patterns during the first year and a half of the COVID-19 pandemic, followed by a return to something much closer to the pre-pandemic levels in at-home calorie purchases by the beginning of 2022. An important question, though, is whether the pandemic had lasting impacts on the types of foods that households bought for at-home consumption, and on the healthiness of their shopping baskets.
We therefore classify households’ at-home purchases into ‘healthier’ and ‘less healthy’ groups, based on their nutrient profiling score. This results from the nutrient profiling model, which provides an overall assessment of the nutritional content of products as it accounts for nutrients of concern (saturated fat, sugar, salt and calories) as well as beneficial nutrients (fibre, fruit, vegetable and nut content). If a food product scores 4 or more, or a drink product scores 1 or more, then the product is considered less healthy.14 It is also considered to be high in fat, sugar or salt (HFSS) if the score is above 4.15
Overall, we find that the initial lockdown period coincided with an increase in less healthy calories (from a daily equivalised average of around 990 in Q2 2019 to 1,255 a year later). As Figure 3.2 shows, this was not just down to an increase in total calories; households also increased the share of their shopping basket taken up by less healthy calories. Less healthy calories made up 52.6% of total calories in Q2 2019, rising to 54.0% the following year.
However, while the changes in the amount of calories in households’ shopping baskets persisted throughout 2020 and into 2021, the change in the share of less healthy calories was shorter-lived. By the latter half of 2020, less healthy foods made up 0.5 percentage points more of families’ food basket than a year earlier; by the second half of 2021, these differences had almost entirely disappeared.
Figure 3.2 also shows a second line (in grey) that gives the share of calories from sources that have a nutrient profiling score of more than 10. This includes less healthy foods with higher nutrient profiling scores, such as bacon, biscuits and cheese (see Figure F.2). Most of the calories coming from less healthy sources appear to be of this type with the share of calorie purchases coming from foods with nutrient profiling scores between 4 and 10 standing at around 10% on average over time.
Figure 3.2. Share of Take Home calories that come from less healthy sources
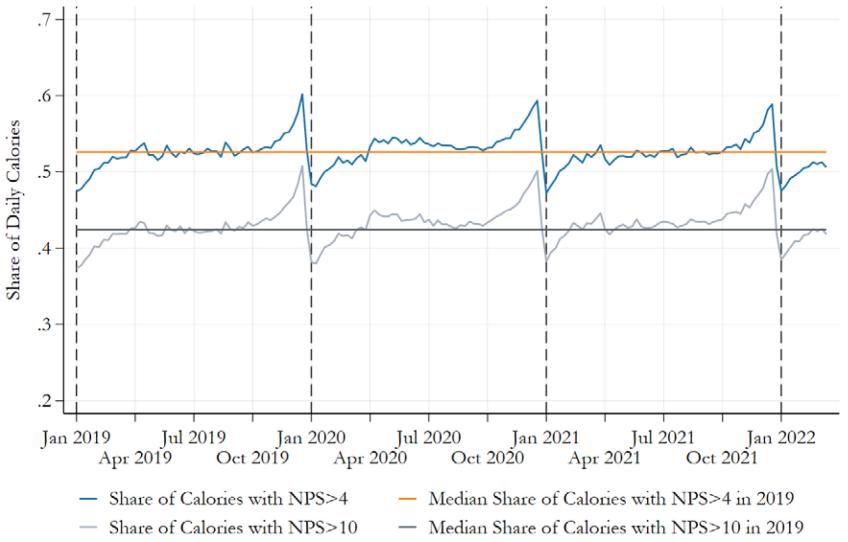
Note: Based on Kantar Worldpanel Take Home data for January 2019 to March 2022. The chart shows the share of calories that come from foods that are defined as less healthy according to the nutrient profiling model – those with a nutrient profiling score (NPS) of over 4. The share of foods that are even less healthy (i.e. those that have a higher NPS of over 10) are also shown.
3.3 What was bought from takeaways and for consumption out-of-home?
Figure 3.3 shows the trajectory of out-of-home calorie purchases. Though the chart is showing the same for out-of-home purchases as Figure 3.1 did for Take Home purchases, we remind the reader that these two figures are not directly comparable; while Figure 3.1 shows calories at the household level, Figure 3.3 shows individual-level calories. That said, the patterns in Figure 3.3 look quite different to the Take Home data in Figure 3.1. First, they are more volatile, reflecting the smaller sample size in this dataset. In 2019, out-of-home calories are essentially uncorrelated with at-home calories.16
Figure 3.3. Total out-of-home calories
Note: Based on Kantar Worldpanel Out of Home data for January 2019 to March 2022. The orange line represents average calories in 2019. Here calories are measured at the individual level. They cannot be directly combined with the at-home calorie picture.
The most obvious pandemic pattern in out-of-home purchases is their sharp drop-off during national lockdowns in Q2 2020, Q4 2020 and Q1 2021. But even during periods when restrictions had been eased (and when government programmes, such as ‘Eat Out to Help Out’, aimed to increase the number of people eating in restaurants and other food outlets), out-of-home purchases remained well below their pre-pandemic levels during 2020.17
During 2021, the patterns in out-of-home consumption look more similar to (the inverse of) at-home data: consumption remained well below its pre-pandemic average in the first half of the year, but returned to virtually where it had been by the end of 2021. In the first quarter of 2022, daily out-of-home consumption was around 5% higher than it had been in 2019; as we discuss below, this is driven by a persistent increase in takeaways.
Figure E.1 in Appendix E shows that food expenditure follows a very similar pattern to calories purchased over time. One notable difference is that out-of-home expenditure remains below the 2019 average throughout 2021 and early 2022 (although with a smaller difference than in 2020).
3.4 What types of outlet did out-of-home calories come from?
Figure 3.4 shows information on where individuals purchase their out-of-home calories, considering four different sources: supermarkets (blue); fast food and takeaways (orange); coffee shops (light grey); and pubs and restaurants (dark grey).18
Prior to the pandemic, at the beginning of 2019, the source of (non-alcohol) out-of-home calories remained relatively stable across the year: 34% of out-of-home calories came from pubs and restaurants; 19% from coffee shops; 31% from fast food and takeaways; and 16% from supermarkets.19
The lockdown in late March 2020 led to a sharp drop in purchases from all sources, except fast food and takeaways (which grew from an average of 44 calories a day in Q2 2020 to 58 calories by the end of the year). While the summer period saw out-of-home calories rapidly return to their pre-pandemic level (particularly in August 2020, when the Eat Out to Help Out scheme was in place), additional restrictions over the autumn reduced purchases in pubs, restaurants and coffee shops. Excluding fast food and takeaways, out-of-home calories reached their lowest level in January 2021, with a third national lockdown coinciding with the start of the year (which typically sees somewhat lower consumption). But, by the second half of 2021, out-of-home calories had returned to a similar level to 2019.
Figure 3.4. Place of purchase: OOH, 2019–22
(a) Total calories by place
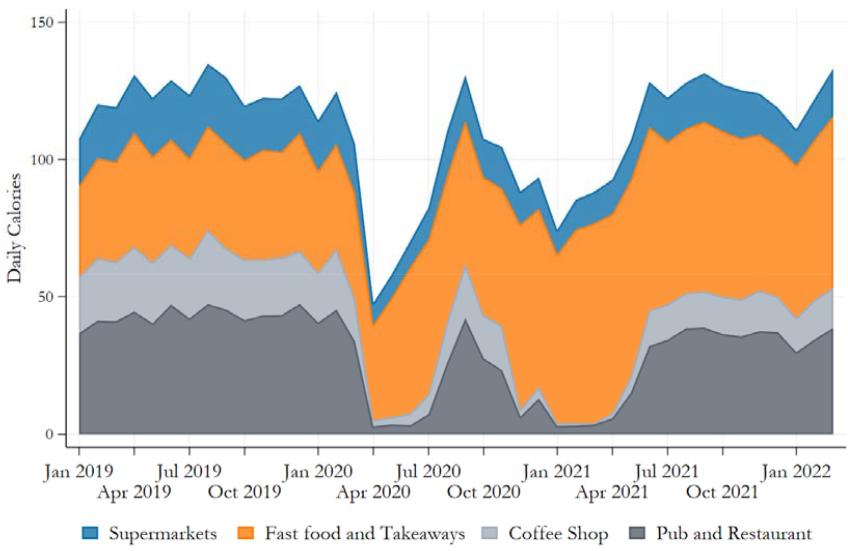
(b) Percentage of calories by place
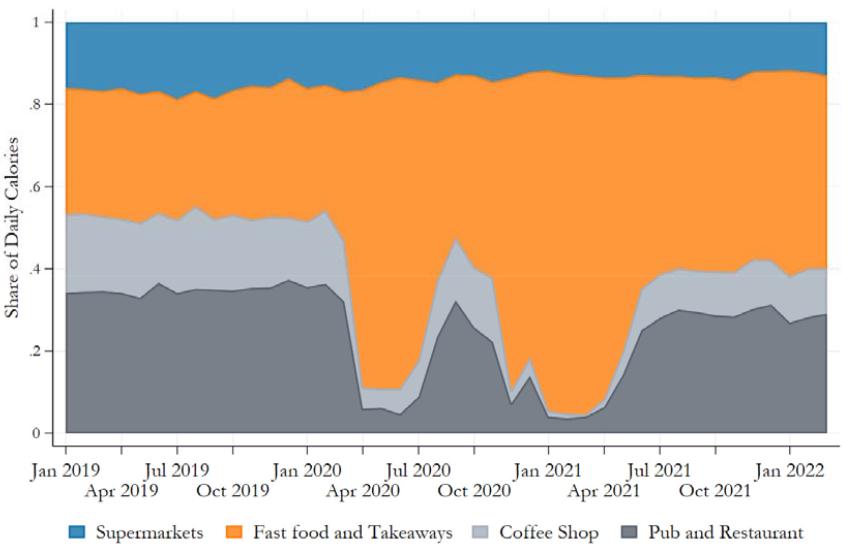
Note: Based on Kantar Worldpanel OOH data for January 2019 to March 2022.
This return to 2019 levels, though, masked a significant shift in the composition of out-of-home purchases. This can be seen more clearly in panel (b) of Figure 3.4, which shows the share of out-of-home calories from different sources. The shift towards purchasing more out-of-home calories from fast food and takeaways during the lockdown can be seen in the orange part of the graph, which accounts for around 80% of total out-of-home calories when households are asked to stay at home. By the second half of 2021, fast food and takeaways accounted for nearly half (47%) of out-of-home calories, compared to 31% at the start of 2019. This growth came mostly at the expense of calories from coffee shops (which fell from 19% to 11% of out-of-home calories) and from pubs and restaurants (which experienced a 15% fall).
We show this drastic shift towards purchasing more out-of-home calories from fast food and takeaways in Figure H.1 by expanding the period considered, starting in 2017. While the share of takeaways is gently rising over time from the beginning of 2017 through to the onset of the pandemic in early 2020, the 2021 share is significantly higher than might have been expected if the share that takeaways represent had continued their pre-pandemic path.
4. Results by household composition
The COVID-19 pandemic brought enormous changes to almost all aspects of life. In many cases, the pandemic acted to exacerbate existing inequalities. O’Connell et al. (2022) show that the households who changed their food purchasing habits the most tended to have higher levels of qualifications, and tended to be of working age rather than retired. They relate some of these differences to the impacts of changes in the labour market, such as home working – more common among highly educated professions.
Another potentially important dimension of difference is household composition. Families with young children faced two periods of national school closures, totalling 22 weeks in England – and children in many regions were at home for longer.20 During this period, children lost access to important parts of their food environment, most notably school meals (free or paid).21
Families with children, and particularly single-parent families, are also much more likely to experience food insecurity than childless households. Data from the Family Resources Survey suggest that around 4.7% of households with children experienced food insecurity in 2021–22, more than twice the rate of 2.3% among childless households. Among single-parent families with children, the food insecurity rate was 12.3%.
These differences mean that household composition is a particularly important dimension of inequalities to explore, both for understanding the pandemic’s impact and for shaping policies designed to support post-pandemic recovery. In this section, therefore, we explore how changes in food purchasing differed across households with one dependent child, households with two or more children, and working-age households with no dependent children.
4.1 How did Take Home purchases differ by household composition?
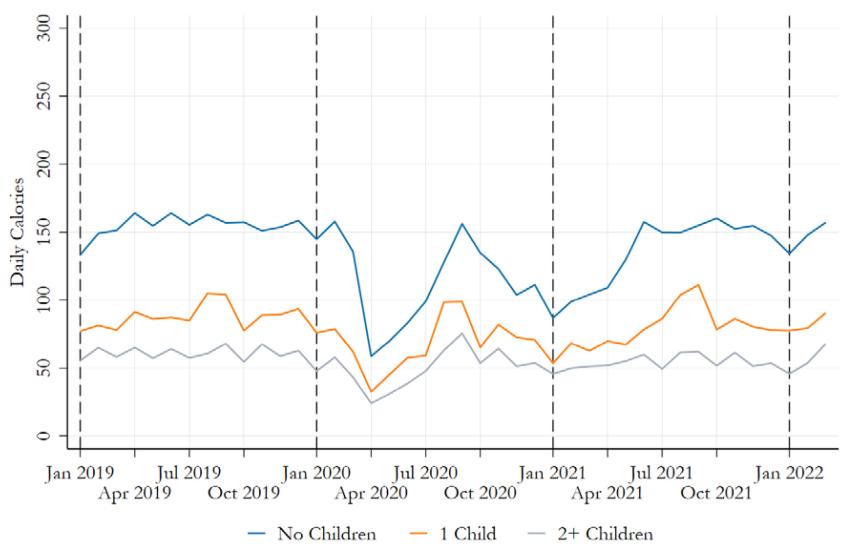
Figure 4.1 shows calorie purchases at home over time, similar to Figure 3.1, but now broken down by household type.22 Two observations stand out.
First, households with children tend to purchase fewer calories per adult equivalent than households without children and, second, the gap widens (though not proportionally) as the number of children increases. In 2019, the average household with no children purchased around 2,000 calories per equivalent adult per day, compared to around 1,610 for households with one dependent child and around 1,485 for those with two or more dependent children.23
Of course, children on average require fewer calories than adults. Our approach to present per equivalent adult is employed to strip this out by adjusting for household composition. There may, however, be differences in eating patterns that undermine the comparisons; for example, children may eat their lunches at school or participate at breakfast clubs, which would reduce the total calories purchased into the home on their behalf.
While there are significant level differences between households with and without children, the pattern of calories purchased into the home over time is very similar across household types – and this holds both before and during the pandemic. Despite the arguably greater shock experienced by households with dependent children, who lost access to school food, we find little evidence that the impacts of the pandemic on food purchasing for this group were substantially different.
Figure 4.1. Total at-home calories by household composition
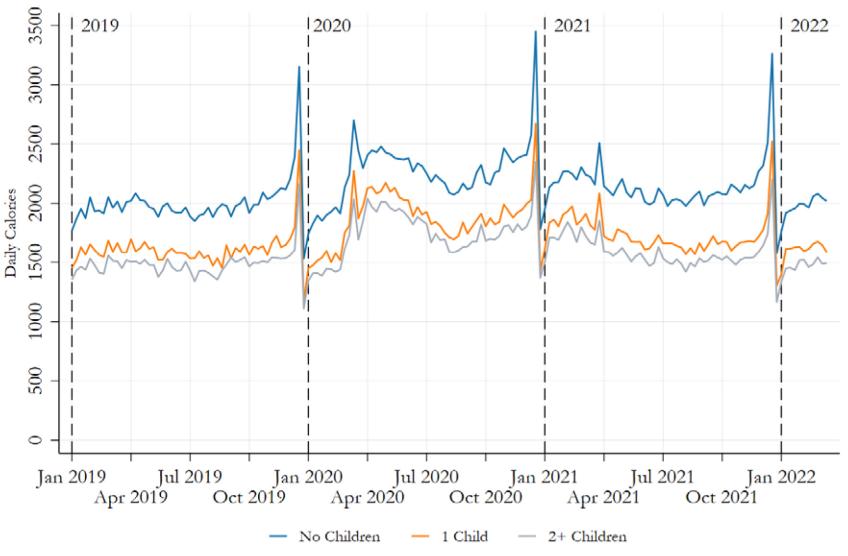
Note: Based on Kantar Worldpanel Take Home data for January 2019 to March 2022.
4.2 How healthy were the purchases of different household types?
We turn to the healthiness of calories purchased by household types. Overall, as Figure 4.2 shows, we see relatively little evidence that households with children purchase disproportionately healthier or less healthy food, or that this changed over the course of the pandemic compared with households without children.
Next, we examine whether there is an income gradient in the healthiness of food purchases and whether this differs by households with and without children. Figures 4.3, 4.4 and 4.5, for 2019, 2020 and 2021, move beyond the picture presented in Figure 4.2, which showed the share of foods that are ‘less healthy’ or HFSS according to the UK government’s nutrient profiling model, to show the average nutrient profiling score of all purchases.24 As companions to Figure 4.2, these charts shows whether the average purchase a household makes is healthy or less healthy, and how that is associated with their household income.
Across the three charts, a consistent picture emerges. First, at every level of income, households with children appear to purchase less healthily than those without children – their average nutrient profiling score is higher. This gap is not large, however. Second, higher-income households tend to purchase healthier baskets of food. For example, among households with children, the average nutrient profiling score falls by a little over a point in each of the years 2019 to 2021 when moving from the lowest household income band to the highest. Third, the extent of this income gradient does not seem to differ much by household composition, though it is perhaps slightly steeper for households with children. In each of Figures 4.3, 4.4 and 4.5, the gap is largest among households on the lowest incomes (earning less than £10,000 a year) and at its smallest among those on the highest incomes. Fourth, when comparing points on each line in Figure 4.3 with Figures 4.4 and 4.5, it is clear that the healthiness of purchases is stable across time, as in Figure 4.2. For example those earning £20,000–£30,000 in 2019 have an average nutrient profiling score of 2, which is also the case in 2020 and 2021.
Figure 4.2. Share of at-home calories that come from less healthy sources by household type
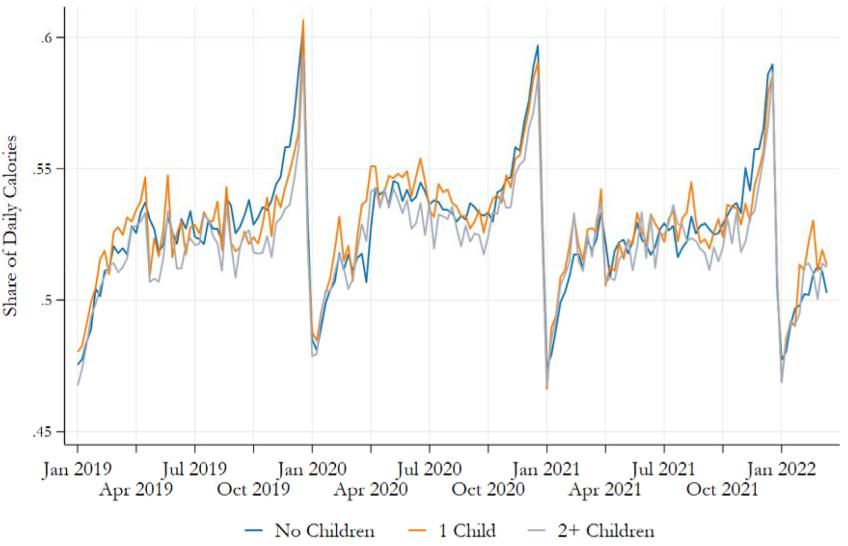
Note: Based on Kantar Worldpanel Take Home data for January 2019 to March 2022.
Figure 4.3. Healthiness of calories purchased by household type and income, 2019
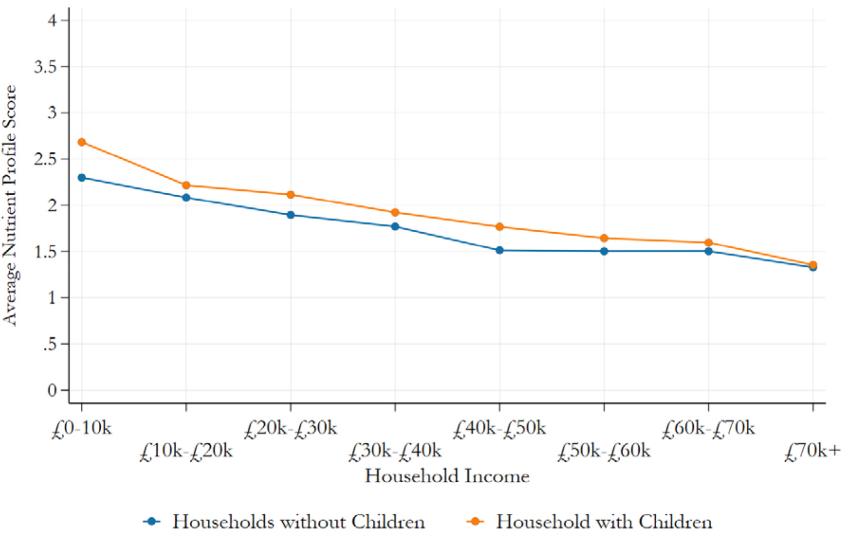
Note: Based on Kantar Worldpanel Take Home data for 2019.
Figure 4.4. Healthiness of calories purchased by household type and income, 2020
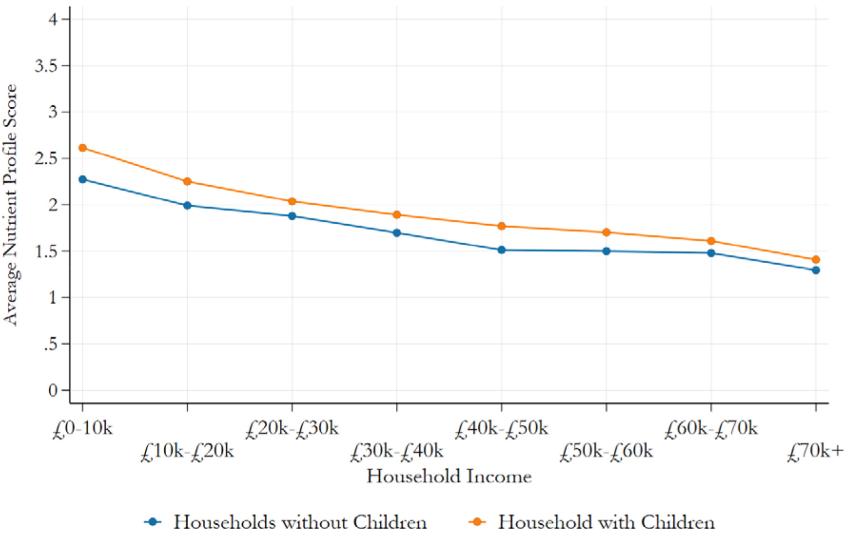
Note: Based on Kantar Worldpanel Take Home data for 2020.
Figure 4.5. Healthiness of calories purchased by household type and income, 2021
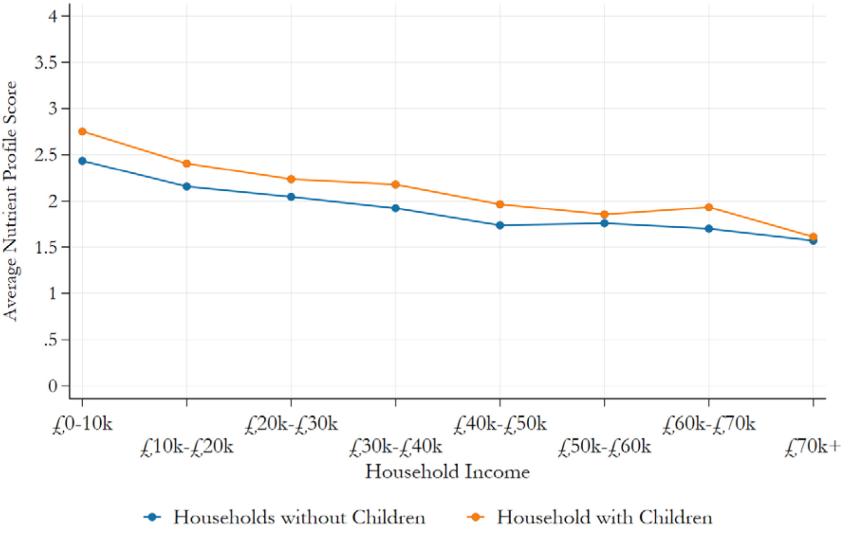
Note: Based on Kantar Worldpanel Take Home data for 2021.
Table 4.1 shows this same picture in the form of a regression. There are three groups of coefficients in the table: a binary variable that indicates whether there are children present in the household; an indicator for which household income band a household is in; and the interaction between the two.
Households with children (the first group in the table) have less healthy diets overall (their scores are higher). For example, in 2019, the average nutrient profiling score for households with children was around 0.25 points higher than for childless households. This gap grows slightly across the two years in 2020 and 2021 (Columns 2 and 3). And, unlike many of the data series in this report, there is little sign that things are returning to their pre-pandemic ‘normal’ by 2021.
The second part of the table shows how household income relates to the average healthiness of at-home calories. The table confirms the sizeable income gradients that we have shown in Figures 4.3–4.5. Compared with households with income below £10,000 a year (the omitted reference category), higher levels of income are associated with a lower average nutrient profiling score. Being in the top income band (earning more than £70,000 a year) seems to be especially beneficial.
Table 4.1. Regression of nutrient profiling score on household income and presence of children in the household
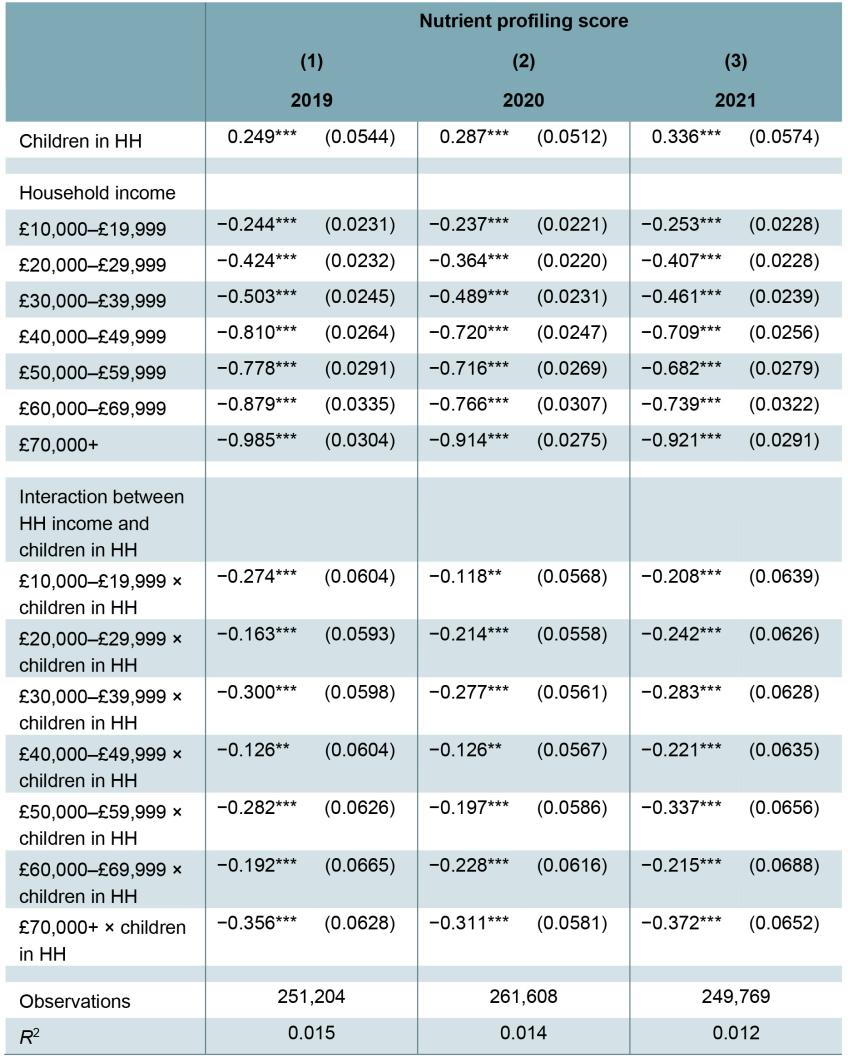
Note: Standard errors in parentheses. *** p < 0.01; ** p < 0.05; * p < 0.1. Each of the income bands and its interaction with the presence of children in the household is jointly significant at the 1% level. Results are based on Kantar Worldpanel Take Home data for 2019 to 2021.
The final panel of the table shows how these income gradients interact with household composition. Here, the coefficients tell us how the gradient changes with children in the household. In 2019, the gradient is steeper for households with children than their childless counterparts: the coefficients are all negative and statistically significant, though much smaller than the household income coefficients alone. This aligns with the story told by Figures 4.3–4.5.
4.3 How did out-of-home calorie purchases differ by household composition?
Figure 4.6 shows calorie purchases out of home by household type, just as Figure 3.3 does for the whole sample. Prior to the pandemic, an individual living in a childless household purchased around 155 calories a day for out-of-home consumption, twice that of households that contain at least one child. The gaps narrow during periods of national lockdowns, when the non-takeaway sources would have been subject to restrictions. Post-pandemic the picture has largely returned to what it was before the onset of the COVID-19 pandemic.
Figure 4.6. Total out-of-home calories by household composition
Note: Based on Kantar Worldpanel Out of Home data for January 2019 to March 2022.
4.4 Where did different households make purchases when outside the home?
Figures 4.7 and 4.8 show the sources from which out-of-home calories are purchased. Households without children purchase more adult equivalent calories from all sources than households with children. In terms of shares of the total, before the pandemic (Q2 of 2019) the two groups are similar in terms of the share of their calories that come from pubs and restaurants (at around a third) and from supermarkets (at around 17%). But households with children purchased a higher share of fast food and takeaways than those without, at 38% versus 29%. Households with children have lower purchases from coffee shops as a result, at 13 % versus 19% for households without children.
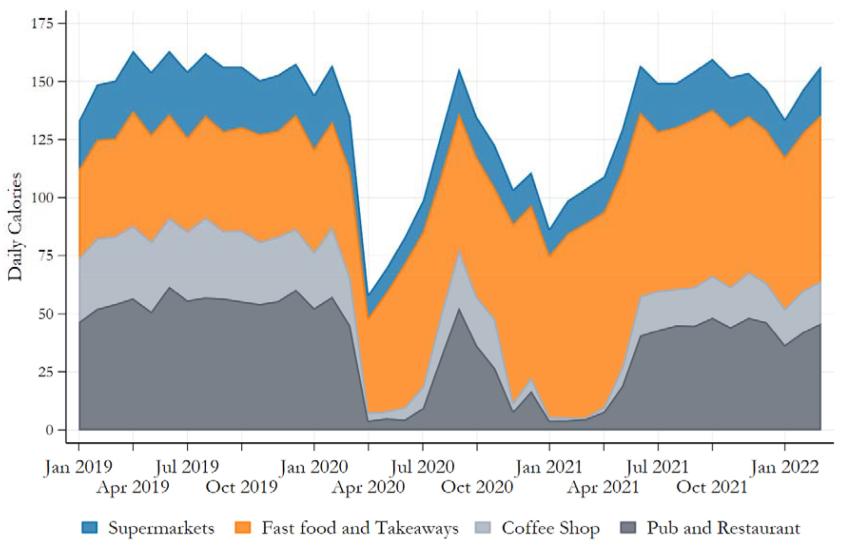
Note: Based on Kantar Worldpanel Out of Home data for January 2019 to March 2022.
Figure 4.8. Sources of out-of-home calories: households with children
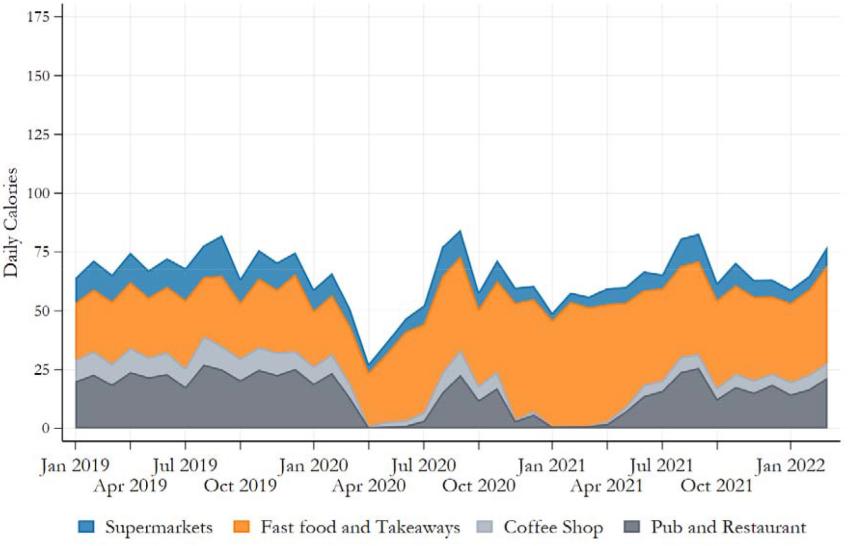
Note: Based on Kantar Worldpanel Out of Home data for January 2019 to March 2022.
In Q2 of 2020, households with children get over 80% of their out-of-home calories from fast food and takeaways, whilst households without children are closer to 72%. Although a lower share of their total, this represents a greater shift towards fast food and takeaways for households without children. The fact that the share is lower may reflect greater willingness or ease for those without children to consume from out-of-home sources during the first lockdown. By Q2 of 2021, fast food and takeaways dominate for both groups, but those with children still consume a higher share of calories from fast food and takeaways than those without children (72% versus 64%). Other categories make up a smaller share of the total for households without children.
5. Conclusion
The COVID-19 pandemic disrupted many aspects of the food environment. National and local lockdowns and rules restricted access to out-of-home environments such as restaurants and pubs, while shopping for both at-home consumption and deliveries and takeaways increased. Overall, the early months of the pandemic saw the average household buy almost 370 calories more per person, per day. There was particular concern that the substantial shock to food environments and behaviour would lead to long-term changes in purchasing and consumption habits.
In this report, we show that there is instead evidence that most aspects of food purchasing returned close to their pre-pandemic ‘normal’ by late 2021. Total at-home calories in the final quarter of 2021 were 5% higher than in the same quarter of 2019. Out-of-home purchasing, too, had largely returned to its pre-pandemic levels after a sharp fall during national lockdowns.
During the earliest period of the pandemic, households’ food baskets became somewhat less healthy; in the second quarter of 2020 (when the first national lockdown was in place), the share of calories from less healthy foods rose to 54% (compared to 52.6% a year earlier). But the healthiness of food baskets returned to close to pre-pandemic levels by the start of 2021, and by the end of that year the gap compared with 2019 had entirely closed.
Families with dependent children were exposed to additional disruption to their food environment, as school closures left children without access to school lunches (free or paid for). Despite this, we find little evidence that the impacts of the pandemic on food purchasing for this group were substantially different to childless households.
There are some aspects of households’ food purchases that have followed a different path, with more persistent impacts from the pandemic period. The share of out-of-home calories coming from fast food and takeaways rose from 31% to 74% during the first lockdown, when spending at coffee shops, pubs and restaurants was restricted by law. But, by the end of 2021, they remained at an elevated level, accounting for 46% of out-of-home calories, and higher than would have been the case if they had followed their pre-pandemic trend. The shift towards takeaways was particularly pronounced among households without dependent children.
Appendix
References
Blundell, R., Cribb, J., McNally, S., Warwick, R. and Xu, X. (2021). Inequalities in education, skills and incomes in the UK: the implications of the COVID-19 pandemic. IFS report, https://ifs.org.uk/publications/inequalities-education-skills-and-incomes-uk-implications-covid-19-pandemic
Cherchye, L., De Rock, B., Griffith, G., O’Connell, M., Smith, K. and Vermeulen, F. (2020). A new year, a new you? Within-individual variation in food purchases. European Economic Review, 127, 103478, https://doi.org/10.1016/j.euroecorev.2020.103478.
Department of Health (2011). Nutrient profiling technical guidance. https://assets.publishing.service. gov.uk/government/uploads/system/uploads/attachment_data/file/216094/dh_123492.pdf.
Griffith, R. and O’Connell, M. (2009). The use of scanner data for research into nutrition. Fiscal Studies, 30, 339–65, https://doi.org/10.1111/j.1475-5890.2009.00099.x.
Kantar (2020). Kantar Worldpanel (Take Home and Out of Home data), https://www.kantarworldpanel.com/global/.
Leicester, A. and Oldfield, Z. (2009a). An analysis of consumer panel data. IFS Working Paper W09/09, https://ifs.org.uk/publications/analysis-consumer-panel-data.
Leicester, A. and Oldfield, Z. (2009b). Using scanner technology to collect expenditure data. Fiscal Studies, 30, 309–37, https://doi.org/10.1111/j.1475-5890.2009.00098.x.
O’Connell, M., De Paula, Á. and Smith, K. (2021). Preparing for a pandemic: spending dynamics and panic buying during the COVID-19 first wave. Fiscal Studies, 42, 249–64, https://doi.org/10.1111/1475-5890.12271.
O’Connell, M., Smith, K. and Stroud, R. (2022). The dietary impact of the COVID-19 pandemic. Journal of Health Economics, 84, 102641, https://doi.org/10.1016/j.jhealeco.2022.102641.
Office for National Statistics (2024). Living Costs and Food Survey. [data series]. 4th release. UK data service. SN: 2000028. Technical report, DOI: http://doi.org/10.5255/UKDA-Series-2000028.
Endnotes
Authors

Britta Augsburg
Britta is an IFS Associate Director, Associate Staff at the Department of Economics at the UC and Researcher at NIHR Obesity Policy Research Unit.

Christine Farquharson
Christine's research examines inequalities in children's education and health, especially in the early education and childcare sector.

Andrew McKendrick
Andrew is a Research Economist in the Education and Skills sector. He focuses on education, health and nutrition and the impact of government policy.
More from IFS
Understand this issue


Policy analysis


Academic research


