Last updated: 29 September 2015
Spending on public order and safety grew strongly between 1978–79 and 2008–09, fluctuating around 2% of national income. The departments that are responsible for most of this spending, such as the Home Office and the Ministry of Justice, are facing particularly large cuts up to 2015–16, marking a change in the prioritisation of these areas.
Spending on public order and safety (POS) includes the criminal justice system (which itself includes police spending, the Crown Prosecution Service, the criminal courts and the prison and probation services), immigration and citizenship functions and the fire services.
POS spending made up 3.3% of total spending in 1978–79 and rose steadily as a fraction of total spending to peak at 5.8% in 2001–02, but then fell to 4.1% in 2014–15. Figure 1a shows POS spending growing steadily in real terms from 1978–79 to 1994–95 (under the last Conservative government). Over this period, it was one of the fastest-growing areas of public spending, growing even faster than health spending.
Under the new Labour government (from 1997–98), real spending on public order and safety initially grew at a similar pace to that under the previous Conservative government, as Labour stuck to the fairly restrictive spending totals set by the outgoing government. In around March 2000, however, spending in this area began to grow more rapidly again, although not quite as quickly as in health and education. Strong economic growth at the same time meant that the growth in spending as a share of national income was much less dramatic: spending on POS has fluctuated between 1.7% and 2.3% of national income since 1989–90.
From 2009–10, spending on POS has fallen both in real terms and as a share of national income, as shown in Figure 1b. This has happened as the departments administering this spending (the Home Office, Ministry of Justice and areas of Local Government) have been hit relatively hard in the austerity imposed since the financial crisis and recession.
Figure 1a. Spending on public order and safety in real terms (£ billion, 2015–16 prices), 1978–79 to 2014–15
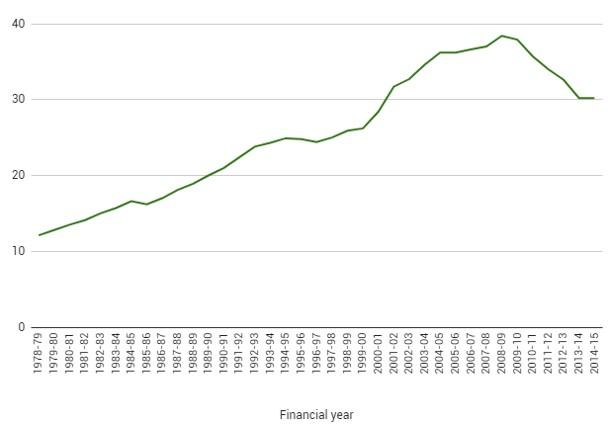
Source: HM Treasury, Public Expenditure Statistical Analyses (PESA) 2015 and previous PESAs.
Figure 1b. Spending on public order and safety as a share of national income (%), 1978–79 to 2014–15
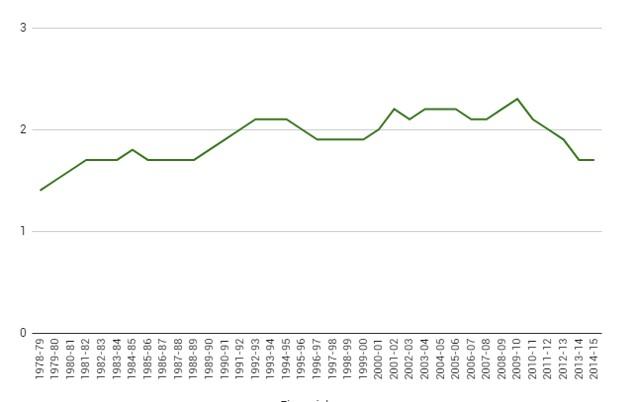
Source: HM Treasury, Public Expenditure Statistical Analyses (PESA) 2015 and previous PESAs.
Useful resources
- 2015 Green Budget chapter looking at changes in departmental spending since 2010–11