
At the time of the last general election, UK tax revenues amounted to around 33% of national income. By the time of the next election in 2024, on current forecasts, taxes will amount to around 37% of national income – a level not sustained in the post-war period. Compared with a world in which taxes had stayed at 33% of national income, the UK government will be raising upwards of £100 billion more in tax revenues next year. This is equivalent to around £3,500 more per household, though of course the tax rise will not be shared equally.
The government may decide to announce tax cuts in the run-up to the next election. But there is no world in which this parliament – or indeed the period since Rishi Sunak became Prime Minister – turns out to be anything other than a tax-raising one. In fact, it is currently on track to be the biggest tax-increasing parliament since comparable records began.
Taxes in the UK are heading for an all-time high
The UK government is currently raising more in tax revenue, as a percentage of national income, than at any time since the 1940s (Figure 1). This is, in no small part, due to a raft of tax-raising measures announced over the past few years. Notable examples include the big increase in the main rate of corporation tax from 19% to 25%, the energy profits levy, and freezes to various income tax and National Insurance thresholds. Economic developments mean that some of these measures will now raise considerably more than originally planned or intended. That is particularly true of freezes to income tax allowances (which would otherwise have risen in line with CPI inflation).
Figure 1. UK tax revenues as a percentage of national income
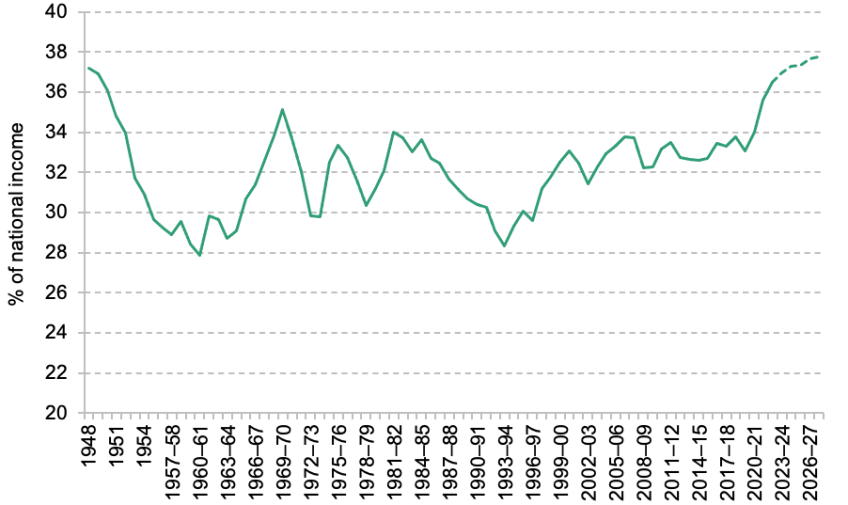
Note: Calendar years prior to 1955–56. Values denote national account taxes. Dotted line denotes March 2023 forecast.
Source: Office for Budget Responsibility, public finances databank (accessed September 2023).
Comparing with parliaments of the past
The upshot is that the overall level of taxation will increase by more over this parliament than under any previous parliament since the 1950s (when comparable records began). This is illustrated in Figure 2. Between 2019–20 and 2024–25, tax revenues are set to increase by 4.2% of national income under the latest official forecasts (we return to the issue of recent GDP revisions below). The next-biggest tax-raising parliament was during Labour’s first term under Tony Blair (defined here as 1996–97 to 2001–02), when taxes increased by 2.9% of national income.
Figure 2. Changes in tax revenues as a percentage of national income, by parliament since 1951
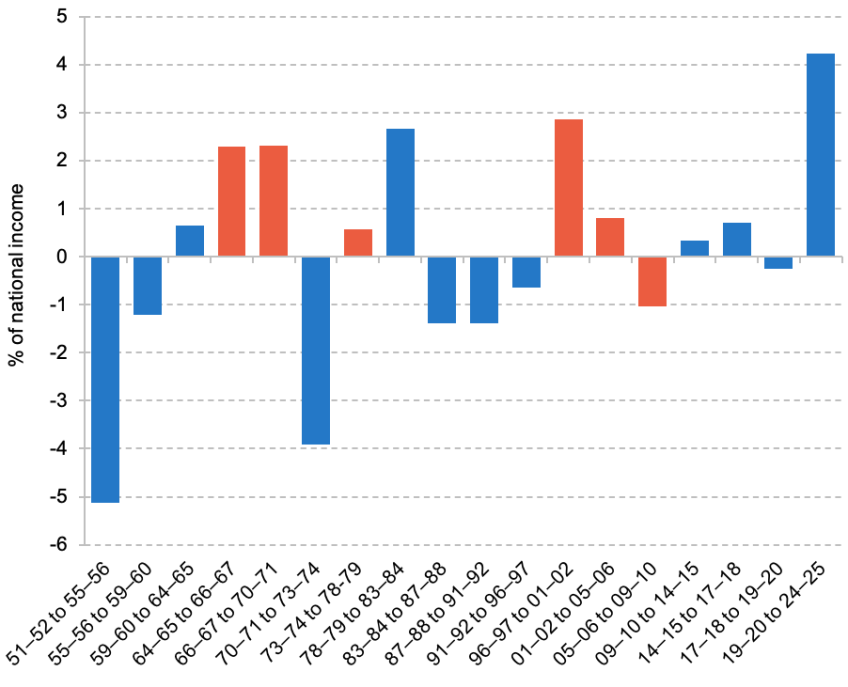
Note: Values denote the change in national account taxes as a percentage of national income (GDP), as per official out-turn data (and the latest forecasts for 2023–24 and 2024–25). This is distinct from the change in tax revenues as a result of discretionary policy measures. Start and end financial years have been selected to best reflect the period covered by each parliament. The colour of each bar denotes the party affiliation of the prime minister of each government. The February–October 1974 parliament has been combined with the subsequent parliament running to 1979.
Source: Authors’ calculations using Office for Budget Responsibility, public finances databank (accessed September 2023).
The data on tax revenues only go back to 1948. We can look back further if we instead look at total government receipts (i.e. all revenues, not just those from taxes). The figures back to 1900 are presented in Figure 3, and tell a similar story. Only during and in the immediate aftermath of the two world wars have government revenues grown by as much as they have in the period since 2019. To some extent, this ought not to be a surprise: the COVID-19 pandemic represented the most significant economic dislocation since the Second World War. But while the response to the pandemic and its after-effects does explain some of the tax rises announced in recent years, it is far from the only – or even the most significant – explanation. Instead, tax rises have largely been the consequence of a desire for higher government spending on things that pre-date the pandemic (such as manifesto promises to expand the NHS workforce and hire more police officers, and a September 2019 declaration to be ‘turning the page on austerity’).
Figure 3. Changes in total government receipts as a percentage of national income, by parliament since 1900
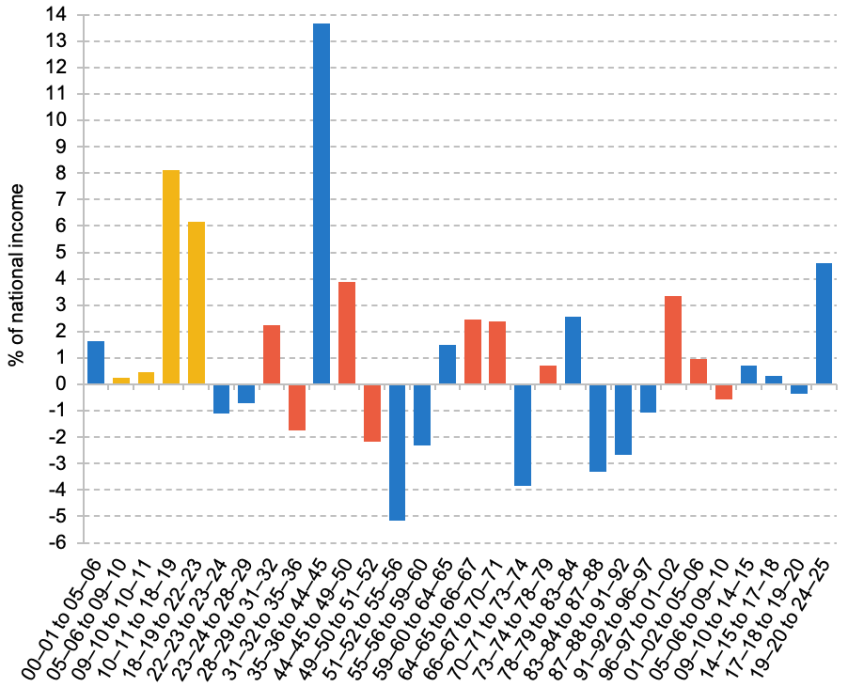
Note: Values denote the change in public sector current receipts as a percentage of national income (GDP), as per official out-turn data (and the latest forecasts for 2023–24 and 2024–25). This is distinct from the change in public sector receipts as a result of discretionary policy measures. Start and end financial years have been selected to best reflect the period covered by each parliament. The colour of each bar denotes the party affiliation of the prime minister of each government (for which purpose Ramsay MacDonald is treated as Labour for the entirety of his time in office). The February–December 1910 parliament has been combined with the subsequent parliament running to 1918; the February–October 1974 parliament has been combined with the subsequent parliament running to 1979.
Source: Authors’ calculations using Office for Budget Responsibility, public finances databank (accessed September 2023).
There are three further things worth noting. First, the level of overall taxation in the UK – while high by historical standards – is fairly middling when compared with other developed countries. Given the scale of the tax rises announced in recent years, the UK may well climb some way up the rankings – though this of course also depends on what happens to tax revenues in other countries.
Second, where the UK is more of an outlier internationally is the extent to which taxes did not meaningfully increase between the financial crisis and the onset of the pandemic. The upper panel of Figure 4 shows that between 2008 and 2019, according to OECD data, tax revenues increased by 0.2% of national income (GDP) in the UK. That compares with an average increase of 1.2% across all developed (OECD) economies and an average increase of 1.5% across EU-15 (broadly speaking, Western European and Scandinavian) economies. Since 2019, on the OECD measure, taxes have risen more quickly in the UK (an increase of 1.3% of GDP between 2019 and 2021, versus an average 0.7% across the OECD and 0.5% across the EU-15). But this is, to some extent, just the UK playing ‘catch-up’ after having kept tax revenues relatively flat over the 2010s, in the face of demographic change and weak economic growth. That said, over the whole period between 2008 and 2021, the tax rise seen in the UK, while large, is still below the average increase seen across either the EU-15 or the OECD.
Figure 4. Change in tax revenues as a percentage of GDP in EU and OECD countries
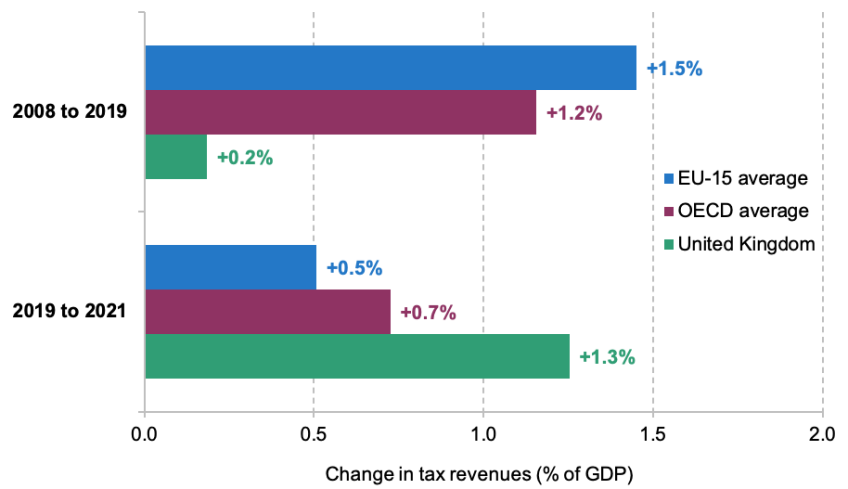
Note: EU-15 area countries are Austria, Belgium, Denmark, Finland, France, Germany, Greece, Ireland, Italy, Luxembourg, Netherlands, Portugal, Spain, Sweden and the UK.
Source: https://stats.oecd.org/Index.aspx?DataSetCode=RS_GBL.
Third, forecasts for tax as a percentage of GDP are affected by forecasts for the latter. A bigger economy means a bigger denominator, and so a reduction in the tax–GDP ratio. The Office for National Statistics (ONS) recently revised upwards its estimates for UK GDP in the post-pandemic period. But these were primarily upwards revisions to real GDP (with a corresponding downwards revision to estimates for economy-wide inflation, as measured by the GDP deflator) in 2020 and 2021. When assessing the tax–GDP ratio in 2024–25, what matters is nominal GDP, for which we might expect less of an upwards revision. Nonetheless, suppose that the forecast for nominal GDP in 2024–25 is revised upwards by 2% (the upper end of what seems plausible) and forecasts for tax revenues remain unchanged. That would reduce the forecast for tax revenue from 37.3% of national income to around 36.6%. That would mean an increase in the level of taxation of around 3.5% of national income over the parliament, rather than 4.2%. That would still leave the UK with taxes at their highest level since the 1940s, and would still make this the biggest tax-raising parliament since records began. Similarly, an upwards revision to GDP would do nothing to change the fact that total government receipts are set to rise by more during this parliament than any other since Clement Attlee’s post-war Labour government.
In any case, it is beyond the realms of plausibility that any change announced in either the autumn or the spring will undo the tax increases over the parliament. Taxes at the end of this parliament will be considerably higher than at the beginning.
Authors

Carl Emmerson
Carl, a Deputy Director, is an editor of the IFS Green Budget, is expert on the UK pension system and sits on the Social Security Advisory Committee.

Paul Johnson
Paul has been the Director of the IFS since 2011. He is also currently visiting professor in the Department of Economics at University College London.

Ben Zaranko
Ben is a Senior Research Economist and an editor of the IFS Green Budget. His work focuses on the health and social care system and UK fiscal policy.
More from IFS
Understand this issue


Policy analysis


Academic research


