
The NHS has more funding and more staff than pre-pandemic, but the number of patients being treated in hospital has increased by nowhere near the same amount. On the face of it, that implies that the system has become less productive – and alarmingly so. But is that the whole story? This week, Amanda Pritchard, NHS England Chief Executive, suggested to the Health and Social Care Select Committee that ‘there is a misunderstanding at the moment of the state of productivity in the NHS’ and that although ‘this doesn’t mean there aren’t still productivity challenges’, these might be much smaller than often suggested.
It is certainly true that measuring productivity in the health service is wrought with difficulty. But in our view, the available evidence strongly points to the NHS – or, at the very least, NHS hospitals – having an ongoing productivity problem. This piece briefly outlines some of the evidence behind that judgement.
More broadly, the focus on productivity in the public sector is welcome. The first step to resolving a problem is admitting that you have one. The government’s review into public sector productivity, and the NHS’s commissioning of a review of evidence, suggest that the right questions are being asked. But this focus on productivity sits a little oddly with other recent actions, such as the plundering of hundreds of millions of pounds from capital and digital budgets to meet day-to-day spending pressures in the health service, which could hinder efforts to boost productivity in the medium term.
Hospital volumes and staffing
Last year, we published analysis showing that the NHS was treating fewer patients than pre-pandemic despite having much higher funding and staffing. Figure 1 summarises the latest data available for hospitals in England, relative to 2019. The NHS is now treating more patients than it was a year ago: treatment volumes over the first nine months of 2023 have been close to 2019 levels (rather than below 2019 levels, as was the case in 2022). This still begs the question: if the NHS has many more staff than pre-pandemic, and more funding, why is it only managing to treat the same number of patients?
Figure 1. Hospital staffing and treatment volumes in 2023 compared with 2019
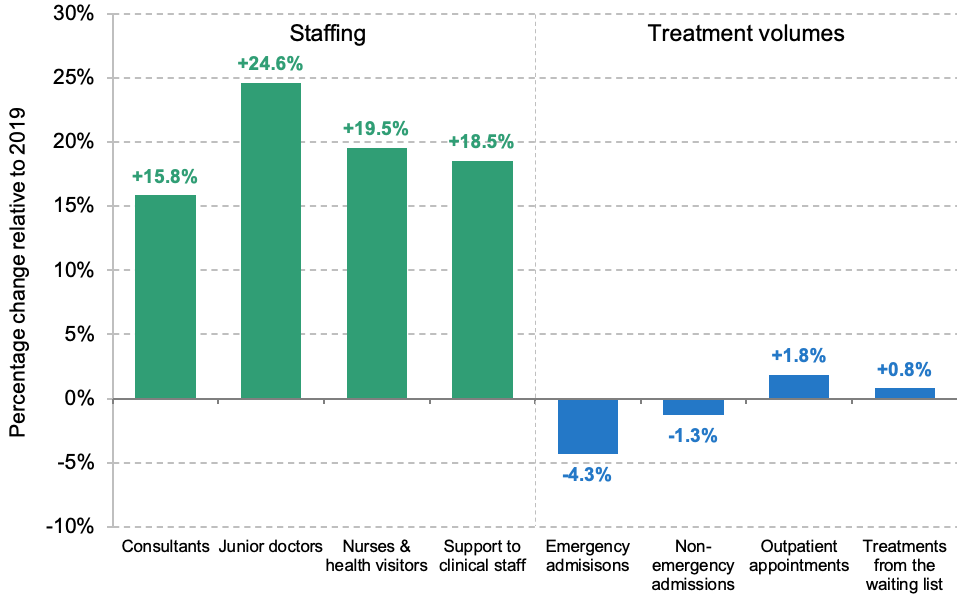
Note: Staffing is measured in full-time equivalents. Outpatient appointments only include attended appointments. Treatments from the waiting list are also included in outpatient appointments and non-emergency admissions. Hospital staffing refers to staffing in acute NHS trusts, and compares January–July 2023 with January–July 2019. Hospital treatment volumes compare January–September 2023 with January–September 2019.
Source: NHS Workforce Statistics (various), Provisional Monthly Hospital Episode Statistics and Consultant-led Referral to Treatment Waiting Times Data.
Hospitals had 15.8% more consultants, 24.6% more junior doctors, 19.5% more nurses and health visitors, and 18.5% more clinical support staff in January to July 2023 than in January to July 2019. But in the first nine months of 2023, they had 4.3% fewer emergency admissions and 1.3% fewer non-emergency admissions than over the same period in 2019. They carried out 1.8% more outpatient appointments and 0.8% more treatments from the waiting list than in 2019. This means that the number of patients treated per staff member – one crude measure of productivity – has fallen substantially.
This is all the more striking and puzzling when contrasted with the experience over the 2010s, when staffing (and funding) grew at a slower rate, but output grew more quickly. This is illustrated in Figure 2, which compares growth rates in NHS staffing and treatment volumes from the waiting list, pre- and post-pandemic.
Figure 2. Annual growth rates in staffing and treatment volumes from the NHS waiting list, pre- and post-2019
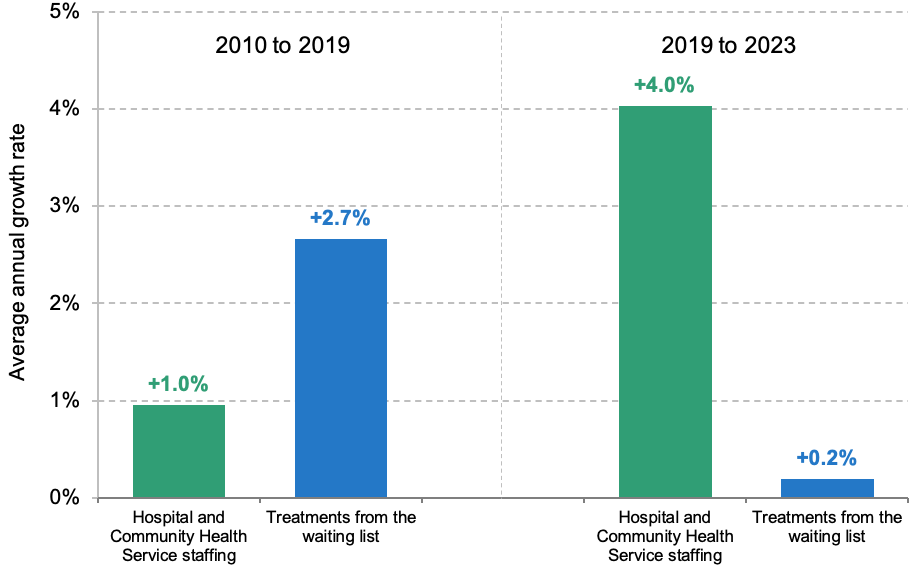
Note: 2010 to 2019 compares January–December 2010 with January–December 2019. To ensure comparability, 2019 to 2023 compares January–July 2019 with January–July 2023 for staffing and January–September 2019 with January–September 2023 for treatments from the waiting list (the latest available data in each case).
Source: Same as Figure 1.
Fewer patients being treated per staff member should not be interpreted as NHS staff working less hard. Staff are not the only input into the system. The point is that if there are more staff, or staff are working more hours, but the system is providing less care, then something appears to be going wrong. As we and others have previously discussed, many other factors – including capital, management and technology – could be responsible for poor NHS productivity performance. We should not lose sight of the fact that there are still several thousand patients in hospital with COVID-19, and the pandemic has had all sorts of wider lingering effects. Patients may now be sicker, on average (an issue we return to below). Industrial action has undoubtedly had a major impact on efforts to secure the post-pandemic recovery. And some of the poor productivity performance may not be the fault of the NHS: there have been well-documented difficulties in discharging patients out of hospital and into social care, for instance. This comment does not seek to explain the ‘why’ or to assign blame. The point is, there still seems to be a major productivity puzzle in the NHS.
Is this the right measure of productivity?
In her Select Committee appearance, Ms Pritchard was asked about the productivity assumptions underpinning the long-term workforce plan. In her answer, she discussed NHS productivity more broadly and gave two reasons why the sort of productivity analysis in the previous section is incomplete. While we think both points are valid, we do not think that they adequately explain away the NHS productivity problem.
Ms Pritchard’s first argument was that the typical approach to measuring NHS productivity is ‘particularly focused on measuring what is happening in acute trusts [hospitals], and even then, it doesn’t fully measure everything that happens’. This is a valid point – though often such analysis focuses on the acute (hospital) sector because this is the sector for which the NHS publishes the most detailed and long-running data series. It would be easier to examine the output of other sectors (such as community care) if similarly high-quality data were recorded and published.
We would also note that cutting NHS waiting lists is one of the Prime Minister’s five priorities for 2023, and the volume of patients treated in hospital is a key determinant of success against that objective. Indeed, the NHS’s own backlog recovery plan requires a 21% increase in the number of patients treated in hospitals by 2024–25, relative to pre-pandemic levels, as well as an increase in the amount of activity provided in non-hospital settings. The acute sector also represents the largest component of the NHS budget. A focus on hospitals is therefore well justified.
This does not mean that these other sectors of the NHS are not important, and it may be that some are more productive than pre-pandemic. It continues to be the case, for example, that the NHS delivers more GP appointments (11.8% more so far in 2023) with fewer GPs (3.1% fewer in September 2023 than in September 2019). The number of key diagnostic tests delivered by the NHS was 11.2% higher in the first nine months of 2023 than over the same period in 2019, likely in part due to community diagnostic hubs, which may increase productivity (as well as staffing, capital and other inputs). But successes in these sectors do not change the fact that within the much larger hospital sector, there are now more inputs with little change in outputs.
Ms Pritchard’s second argument was that measuring output in terms of the number of patients treated does not account for the quality of care that is delivered, and ‘doesn’t reflect some of the innovation in the ways that we have evolved services’. This is also a valid point, and if quality of care has improved relative to pre-pandemic, then it could be that the NHS is treating the same number of people, but providing more care on a quality-adjusted basis. If that were the case, then examining patient volumes alone would overstate the extent to which NHS productivity has fallen.
It is very difficult to accurately measure quality in anything close to real time, especially with publicly available data. But one salient measure of quality is the length of time people have to wait for treatment. Waiting times for many types of treatment are much higher now than they were pre-pandemic. Consider Accident & Emergency departments, for instance, where staffing is (almost certainly) up, patient attendances are up only slightly, and the fraction of patients waiting more than four hours is through the roof. If one were to adjust for only this measure of quality then productivity would have fallen by even more than a simple volumes-based calculation would suggest.
There is one final caveat worth considering. The population has continued to age, and age-adjusted health spending (i.e. spending adjusted for changes in the population’s size and demographic structure) has increased by less than headline figures would suggest (though it has still increased). It is possible also that the mix of cases and/or the average clinical severity of patients has changed. There are certainly worrying signs that the health of the population as a whole has deteriorated. That could account for some portion of the apparent fall in productivity, though is highly unlikely to be the whole story.
Conclusion
Measuring NHS productivity is far from easy. A simple count of how many patients are being treated in hospital does not account for changes in the quality of care, the amount of care each patient requires, or changes in the volume of care provided in non-hospital settings. But because more sophisticated estimates of healthcare productivity (such as those produced by the Office for National Statistics and the University of York) come out only with a lag of more than a year, any attempt at real-time monitoring must use simpler metrics. Even with those caveats, it looks to us that the NHS does have an ongoing productivity problem.
The NHS productivity problem is a big deal. The less productive the NHS is, the more the government – and therefore current or future taxpayers – have to spend for the same quality and quantity of healthcare services. The government’s poor fiscal position means that increasing NHS funding further would require difficult fiscal trade-offs to be made. It is therefore right that the government takes public sector productivity seriously. Everybody should want an NHS that can deliver more for the same amount of money. The risk is that the government and NHS will deprioritise management, capital and technology in order to pour ever-more money into front-line staffing, and undermine efforts to make that happen.
Authors

Max Warner
Max joined the IFS in 2020 as a research economist in the Healthcare Sector, with a focus on the NHS labour force and adult social care in England.

Ben Zaranko
Ben is a Senior Research Economist and an editor of the IFS Green Budget. His work focuses on the health and social care system and UK fiscal policy.
More from IFS
Understand this issue


Policy analysis


Academic research


