
Downloads
R129%20-%20HBAI%20report%202017.pdf
PDF | 2.49 MB
This report examines changes in the distribution of household incomes in the UK, and the determinants and consequences of recent trends. This includes analysing not only changes in average living standards, but also inequality in household incomes and measures of income poverty and deprivation. We put these into historical context using comparable data spanning the last 50 years.
The analysis is based on data from two main UK household surveys. The first is the Family Resources Survey (FRS), a survey of more than 20,000 households a year, which contains detailed information on different sources of household incomes. We use household income variables derived from the FRS by the UK government’s Department for Work and Pensions (DWP). These measures of incomes underlie the DWP’s annual statistics on the distribution of income, known as ‘Households Below Average Income’ (HBAI). In addition, we use information from Understanding Society. This is a longitudinal survey
that follows the same people from one wave to the next, which allows us to examine changes in individual households’ incomes and economic circumstances.
The trends described in this report have of course taken place in the wider context of changes in household incomes across the whole of the UK. These were summarised upon the release of the latest household income data, for 2015–16, in a previous IFS Briefing Note.
Our analysis of the latest HBAI data begins in Chapter 2 with a look at average living standards and how they have changed over time. Chapter 3 analyses how changes in incomes have differed across the income distribution, focusing in particular on the factors affecting inequality. Chapter 4 examines in more detail recent trends in income poverty and its context in a longer-run. Finally, Chapter 5 analyses changes in income poverty among families with children.
Key findings:
The geography of inequality
- London is the most unequal part of the UK. But since the late 2000s the incomes of low-income households in London (the 10th percentile) have risen by more 10%, while the incomes of high-income households (the 90th percentile) have fallen by more than 10%. The particularly large fall in income inequality in London is down to large falls in real earnings (down 10% at the median since 2007) and strong growth in employment (up 5 percentage points since 2007). What has happened in London is a more pronounced version of what has happened elsewhere in Britain. In the UK as a whole, income inequality was still lower in 2015–16 than prior to the recession, with median earnings down by around 5% and the employment rate up 1.5 percentage points.
- One in four poor children live in the 10% most deprived local authorities. Poverty is especially geographically concentrated for working-age households: only 13% of pensioners in poverty are in the 10% most deprived localities.
- Average (median) income in the highest-income region in Britain (the South East) is 25% higher than in the lowest-income region (West Midlands). Nevertheless, income inequalities within regions are far larger than differences in average incomes across regions.
Regional differences
- Average incomes in the south of England (excluding London) and Scotland have grown faster than in Britain as a whole over the last 40 years. This means the South East is now nearly twice as far above the national average as it was in the 1970s (13% compared with 7%). East Anglia the South West and Scotland are all around the national average, having been below the national average 40 years ago. On the other hand, average incomes in London have actually fallen back towards the national average over the same period.
- The Midlands have fared worst in terms of income growth over the last 40 years. Having had slightly higher incomes than average in the mid 1970s, average incomes in the East and West Midlands are now 6% and 9% below the national average respectively. Incomes in Wales and the North of England are also slightly further below average than was the case 40 years ago.
The national picture
- Average (median) income in 2015–16 (the latest data available) was only 3.7% higher than before the recession (2007–08). With real wages currently falling and working age benefits and tax credits being cut, income growth since then is likely to have been very weak.
- Evidence from data on employees’ earnings shows that those towards the very top (99th percentile) have been harder hit than those at the middle (median). Earnings at the 99th percentile are still around 10% below their pre-crisis level, compared with a 5% fall at the median. However, it should be noted that it is hard to track how the household incomes of the very richest have been changing.
- Absolute poverty (according to the official government measure) has changed little over the last decade. This lack of progress is historically unusual and reflects the more general lack of real income growth. It follows especially large reductions in poverty over the preceding decade as the incomes of low-income households grew strongly.
- Average incomes and poverty rates miss the fact that different households can experience dramatically varying changes in income even while population averages remain relatively stable. They also do not tell us whether low income is a temporary or persistent phenomenon.
- Between 2010–2011 and 2014–2015, 37% of people experienced a fall in their household income of more than 5%, and 50% saw a rise of more than 5%. Large income changes are often associated with changes in the number of people in the household who are in employment. Hence the incomes of older people tend to be more stable.
- Low income is more likely to be persistent (i.e. to last for multiple years) for pensioners, lone parents, and those with more than three children. Persistent poverty is defined as being in poverty in three out of the last four years.
- Persistently low parental earnings and persistent parental worklessness are both important in explaining persistent child poverty. Although the risk of persistent poverty is low (5%) for children who consistently live with a parent in paid work, most children are in this situation and so they still account for 38% of persistently poor children.
Presentations
- Agnes Norris Keiller, Living Standards
- Andrew Hood, Inequality
- Robert Joyce, Poverty
- Jonathan Cribb, In work poverty
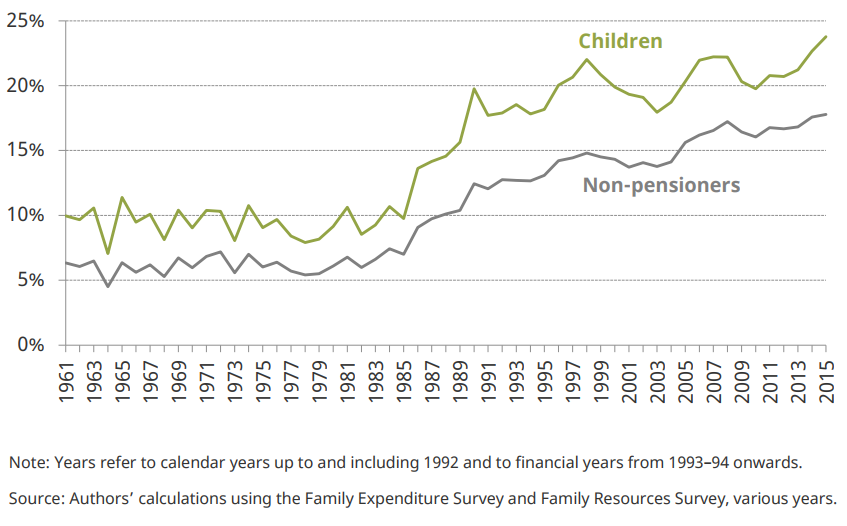
Figure 4.7. Relative poverty rates (AHC) among individuals in working households since 1961 (GB)
Click here to access data on living standards, poverty and inequality since 1961 and to view our other annual reports on the topic.
Authors

Robert Joyce
Robert is a Deputy Director. His work focuses on primarily on the labour market, income and wealth inequality, and the design of the welfare system.

Jonathan Cribb
Jonathan is an Associate Director and Head of Retirement, Savings and Ageing sector, focusing on pensions, savings and later-life economic activity.

Andrew Hood
Agnes Norris Keiller
More from IFS
Understand this issue


Policy analysis


Academic research


