Strong employment growth has reduced the number of people living in households with incomes below a fixed poverty line over the last two years, but planned cuts to benefits and tax credits will mean no growth in the incomes of poorer households on average over the next five years. These are among the main findings from a new IFS Report funded by the Joseph Rowntree Foundation, published today, that examines the prospects for incomes and poverty until 2020.
The latest official data on household income only run up to 2013–14. The report first estimates what has happened since then, given labour market trends and changes in tax and benefit policy:
- Household incomes have been growing right across the income distribution. Between 2013–14 and 2015–16, we estimate real (CPI-adjusted) growth of 4.1% at the 10th percentile, 4.9% at the median (50th percentile), and 3.2% at the 90th
- This income growth partly reflects strong employment growth, particularly towards the bottom of the income distribution. Without any employment growth we estimate that incomes at the 10th percentile would have grown by 2.5% rather than 4.1% and at the median would have grown by 3.3% rather than 4.9%. Ultra-low inflation has also been key, boosting the value of workers’ pay and of benefits.
- All the major demographic groups have seen falls in the number in ‘absolute’ poverty – that is, the number falling below a fixed real poverty line. In 2015–16 we estimate that there were about 400,000 fewer children, 300,000 fewer working-age adults without children, and 200,000 fewer pensioners in absolute poverty than in 2013–14.
- Relative poverty rates have not changed as the incomes of poorer households have grown at a similar rate to median income.
- Young adults will have seen particularly strong income growth over the last two years, though this only represents a partial bounce-back following severe income losses for this group between 2008–09 and 2012–13. Median income among those aged 22 to 30 is estimated to have increased by 10.5% between 2012–13 and 2015–16; but this comes after a 13% fall in incomes for this group since 2007–08.
The report also looks at what would happen to incomes over the next few years if current policy plans remain and the Office for Budget Responsibility’s economic forecasts are correct:
- Incomes are likely to continue growing for many households as earnings rise faster than inflation. The pace of growth will be relatively slow though, with median income increasing at an annual average of 1.5% between 2015–16 and 2020–21.
- The outlook looks less favourable for low-income households. In contrast to the stability of inequality over the past two years (and the decline in inequality since the recession), incomes at the 90th percentile are projected to increase by 2.3% per year while incomes at the 10th percentile are expected to remain constant in real terms.
- Even so, by 2020–21 we project that income inequality will be little changed over the 13 years from 2007–08 as a whole, with incomes at the 10th percentile projected to be 8% higher than they were in 2007–08 and incomes at the 90th percentile 8.9% higher.
- But poverty trends will vary across groups. Child poverty rates are expected to rise between 2015–16 and 2020–21: by 3 percentage points (ppts) for absolute poverty and by 8ppts for relative poverty. And that in itself is driven almost entirely by rising poverty among families with at least 3 children, who are hit relatively hard by benefit cuts. Meanwhile, pensioner poverty is likely to continue its long-run downward trend.
- Increases in relative poverty and inequality are not just caused by benefit changes. Less than a third of the projected increase in overall relative poverty, and around 40% of the increase in relative child poverty, is attributable to planned reforms.
James Browne, one of the authors of the report said “Following an historically slow recovery in living standards after the recession, stronger growth in household incomes at all income levels over the last two years will have been welcome news. For some, particularly the better off and pensioners, this is likely to continue over the next five years as earnings and state pensions grow more quickly than inflation. But the prospects are not so good for others, including large families with low incomes, who will bear the brunt of planned benefit cuts”.
ENDS
Notes to Editors
If you have any queries please contact: Bonnie Brimstone at IFS: 020 7291 4818 / 07730 667 013, @email
The Joseph Rowntree Foundation is an independent organisation working to inspire social change through research, policy and practice. For more information visit www.jrf.org.uk
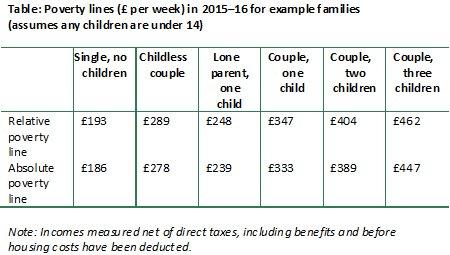
The report measures income in the same way as the official HBAI statistics: at the household level, after deducting taxes and adding on state benefits and tax credits, rescaled (‘equivalised’) to take into account the fact that households of different sizes and compositions have different needs. The report only considers incomes measured before housing costs are deducted (BHC). It follows official statistics in defining the absolute poverty line as 60% of inflation-adjusted 2010–11 median income and the relative poverty line as 60% of contemporaneous median income. However, the figures calculated in the report differ from official statistics as they use the Consumer Prices Index (CPI) to adjust the absolute poverty line over time rather than the Retail Prices Index (RPI) used by official statistics. This is because the RPI is known to significantly and systematically overstate inflation, meaning that using it to adjust incomes over time would understate growth in real incomes. The table below shows the absolute and relative poverty lines in 2015–16 used in the report.
Authors

James Browne
Andrew Hood
More from IFS
Understand this issue


Policy analysis


Academic research


