Since 2000, all households containing a person aged 75 or over have been entitled to receive a free TV licence, paid for by the government. This year this is worth £150.50. However, from June 2020 onwards, the government will no longer provide the funds for these free TV licences. The BBC therefore has to decide whether to continue to provide free TV licences for the over 75s from within its own funds (rather than from the Treasury), or alternatively for whom it will continue to provide free licences. The BBC consultation on what to do closes tomorrow, Tuesday 12 February.
In this short observation we show that, in contrast to the position when free TV licences were introduced in 2000, the over 75s now on average have higher incomes than groups such as families with children and households where the oldest member is under 35, and also have significantly lower poverty rates than the under 75s. They have seen their incomes grow faster than other groups and can expect to see more growth in the future.
Growth in average incomes for over 75s
When comparing the incomes of older people with younger people, it is important to take account of the different housing costs that people face. In 2017, about three-quarters of over 75s owned their own home (almost always “outright” – having paid off their mortgage) leaving them with very low housing costs. In contrast, most working-age adults have significant rental or mortgage payments to make each month. Therefore, to compare “like with like”, we use a measure of income that deducts housing costs from income. We also measure income after taxes and benefits have been paid (including the state pension) and adjust for the household size and structure (because a single person needs less income for a given standard of living than a couple does).
Figure 1 shows how the median (middle) household income has changed for people in households where someone is aged 75 plus and compares it to those where everyone is under 75. It shows that in 2016, the average income for people eligible for free TV licences is almost £395 per week - about 8% (£35 per week) lower than those for households who are not eligible for a free TV licence. It also shows the substantial growth in average incomes for both groups over the last twenty years. In particular, since free TV licences were introduced in 2000, the median income of households with someone older than 75 has increased by 38%, compared to 20% growth for those under 75.
This means that the incomes of households with older people have been catching up with the rest of the population – in 2000 their incomes were 20% behind the rest of the population, and now are only 8% behind. Having said that, since 2013, the gap between those aged 75+ and the rest of the population has widened slightly, with average income growing by 5% for households eligible to free TV licences compared to 8% for the rest of the population. In part, this is likely to be because the working age population has benefitted more from the recovery in the labour market that has occurred in recent years.
Moreover, between 2000 and 2014 the incomes for households containing people aged 65-74 (but not 75 or older) have grown even faster than for the over 75s. They have risen by 44% in real terms. So we would expect the better performance of the over 75s to continue as increasingly richer generations enter this age group.
The strong growth in the average incomes of the over 75s means that they now enjoy significantly higher average incomes than both working age families with children and households where the oldest person is under the age of 34. In the year 2000, the median incomes for these two groups were respectively 9% and 10% higher than the over 75s. By 2016, their average incomes were respectively 8% and 7% below the average income for the over 75s.
Figure 1 Real median net household income, after housing costs are deducted, for households with and without someone aged 75, 2000 to 2016
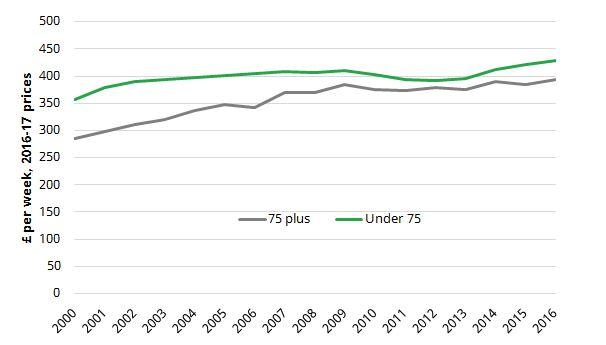
Source: IFS calculations using the Family Resources Survey. Adjusted for household size and structure. Notes: Years refer to financial years.
Poverty rates for the over 75s
Of course we are not just interested in averages. It also matters if different groups have different rates of poverty. In Figure 2, we show the relative poverty rates of households that do and do not contain someone aged 75 plus. Relative poverty is defined as having an income less than 60% of average (median) income.
The Figure shows that around 18% of those currently eligible for free TV licences were poor on this measure, compared to 23% for households with no one aged 75+. This contrasts with the differences for average incomes – where the older group have lower incomes on average. It is also different to the situation in 2000 – when 28% of households with someone aged 75+ were in relative income poverty (and the rate for the rest of the population was 23%). All of the reduction in relative poverty for the group aged 75+ occurred between 2000 and 2010 - since when it has begun to rise again. But overall, compared to 2000 people eligible for free TV licences have gone from being more likely than average to be in relative poverty, to being less likely.
Figure 2 Relative poverty rate (measured after housing costs),for households with and without someone aged 75, 2000 to 2016
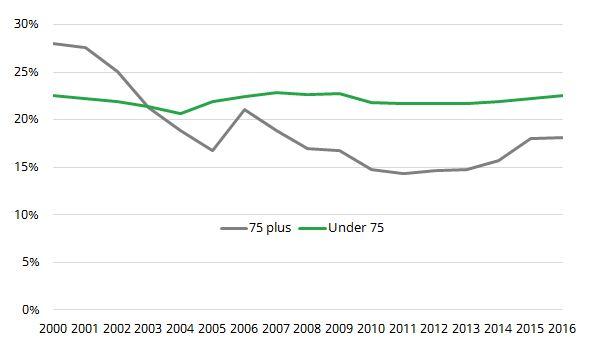
Source: IFS calculations using the Family Resources Survey. Notes: Years refer to financial years.
Summary
The latest official income data from 2016 shows that households that receive free TV licences have slightly lower incomes on average, but significantly lower poverty rates, than the rest of the population. Certainly, the incomes of households with someone aged 75+ have changed substantially since free TV licences were first introduced – in 2000 their incomes were 20% lower than the rest of the population, and now are only 8% lower. Their relative poverty rates have also fallen dramatically from 28% in 2000 to 18% in 2016. On the other hand, the last few years have seen poor income growth and relative poverty creeping back up for this group.
Of course, considerations other than household incomes will determine whether it is appropriate to spend almost £750 million per year providing free TV licences for this group. But looking at measures of household income in isolation, it is hard to believe that if one were starting from scratch one would prioritise spending such a sum on providing this benefit for the over 75s as a whole group.
Authors

Paul Johnson
Paul has been the Director of the IFS since 2011. He is also currently visiting professor in the Department of Economics at University College London.

Jonathan Cribb
Jonathan is an Associate Director and Head of Retirement, Savings and Ageing sector, focusing on pensions, savings and later-life economic activity.
More from IFS
Understand this issue


Policy analysis


Academic research


