
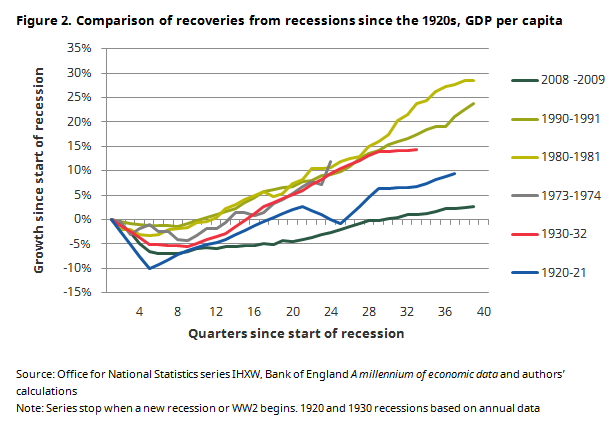
The financial crisis broke in 2008 and was followed by the deepest recession experienced in the UK, and much of the western world, since the Second World War. What has proved most remarkable about the crisis and recession though was not its initial scale but the persistence of its effects. We had got used to the economy, and with it the public finances and household incomes, bouncing back strongly following previous downturns. That has not happened this time.
While the economy has been growing for eight years now, it has been growing only slowly by historic standards. While the government’s deficit, which ballooned to record levels by 2010, is now relatively low, public debt is double its pre-crisis level relative to the size of the economy. The crisis precipitated what has proved to be a big and permanent hit to the size and structure of the UK economy. It affects our incomes and the tough choices we face today.
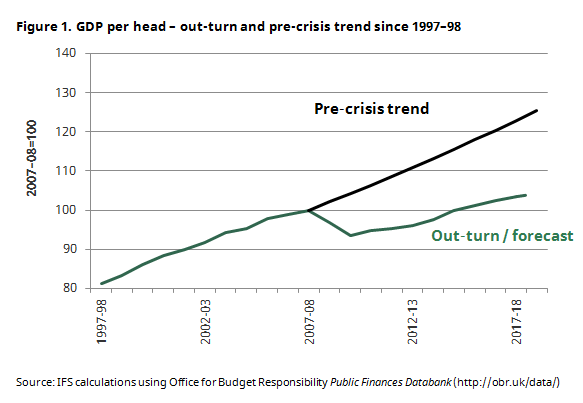
- GDP (national income) is just 11% higher today than it was at its pre crisis peak in 2007–08. As a result the economy is 16%, or £300 billion, smaller than it would have been had it followed the pre-crisis trend. GDP per capita is now £5,900 per person lower than it might have been had pre crisis trends continued.
- This remarkably poor performance has been driven in part by the initial fall in output but more importantly by dreadful productivity performance since 2008. Over that period measured productivity per hour has grown by just 0.3% a year against an historical trend of 2% a year. The most direct effect of this has been to hit workers’ pay packets. Median real earnings for employees are, remarkably, still 3% below where they were in 2008 and are 13% (or £3,500 per year) below where we might reasonably have expected based on rates of growth seen in the years prior to the crisis (of around 1.4% per year).
- It is important to understand the time profile of earnings changes. Over the past 20 years there have been four distinct periods. Between 1997 and 2002 median earnings grew at 2.2% a year; 2002-2009 at 1.0%; they fell 1.8% per year between 2009 and 2014; and grew at 1.5% a year between 2014 and 2017.
- The growth in real earnings of employees has differed for different groups over the last 10 years. For those in the 20s or 30s, median earnings in 2017 were 5% and 7% lower than in 2008 respectively, while for those aged 60 and over, they were only 1% lower than in 2008. The spreadsheet downloadable at the bottom of this observation provides a full breakdown of earnings changes by age and region.
- On the upside this has been a period of strong employment growth. There are 2.7 million more people in paid work today than there were in 2008. At 75.6% overall the working-age employment rate is at its highest ever. The male employment rate at 80.1% is at its highest level since 1991.
- Strong employment growth is one reason that average household incomes are higher than in 2008, despite lower earnings. Median real household income has risen from £24,300 to £25,700 (a 6% rise) since 2008. But had incomes continued to grow at the same rate as the decade before the crisis, average household income would now be £29,900 - £4,200 higher than it actually is.
- The combination of high employment growth, and the pattern of poor earnings growth means that household income inequality has actually fallen somewhat since 2008. For example the most recent figures suggest that the bottom 20% of people saw incomes rise by 9% between 2007–08 and 2016–17, the middle 20% by 6% and the top 20% actually saw a 2% fall in incomes.
- Interest rates set by the Monetary Policy Committee of the Bank of England have been, for the whole period since 2009, at their lowest levels since the Bank was founded in 1694. Alongside extensive Quantitative Easing this remarkably loose monetary policy has helped cushion the economy from what would otherwise have been a much worse outcome. Alongside poor earnings growth and government policy decisions which have tended to favour the old, though, this has contributed to a decade during which the living standards of young people have done much less well than those of older people. For example, the after housing costs incomes of those in their 20s are still below where they were in 2008, whereas for those over 60 it they are almost 10% higher.
- The initial recession reduced the size of the economy dramatically. Public spending rose from 38.9% of national income in 2007–08 to 44.9% in 2009–10 while tax revenues fell from 36.2% of national income to 35.0% of national income. The immediate result was a deficit of £153 billion or very nearly 10% of national income.
- Since then an historically unprecedented set of government spending cuts has brought public spending back to 38.4% of GDP: i.e. very slightly below where it was just before the recession hit in 2007–08 (and after a decade of Labour government). Net tax rises helped push tax revenues up to 36.7% of national incomes, about 0.5% of national income higher than they were in 2007–08 and at their highest level since 1987.
- After all that, the annual government budget deficit is now back to pre-crisis levels. However, the government has accumulated a huge amount of additional debt from all the deficits (i.e. borrowing) that it has run in the interim. Debt is now 50% of GDP higher than it was pre-crisis: it is about £1 trillion higher than it was.
- This legacy of much higher public debt, nearly a decade of spending cuts and the enduring hit to household incomes and tax revenues makes future challenges all the more stark. The OBR, for example, has suggested that spending on health, pensions and social care would need to rise by 4% of national income (£80 billion in today’s terms) over the next 20 years as the population ages if demand is to be met. It seems implausible that there are significant savings that could be easily made from other elements of public spending over this period after the austerity we have recently experienced. This is likely to imply substantial tax rises to come.
We should never stop reminding ourselves just what an astonishing decade we have just lived through, and continue to live through. The UK economy has broken record after record, and not generally in a good way: record low earnings growth, record low interest rates, record low productivity growth, record public borrowing followed by record cuts in public spending. On the upside employment levels are remarkably high and, in spite of how it may feel, the gap between rich and poor has actually narrowed somewhat, but the gap between old and young has grown and grown. With public debt twice its pre crisis level, economic growth remaining sluggish and the population ageing rapidly there will be no shortage of tough decisions over the coming decade.
Authors

Paul Johnson
Paul has been the Director of the IFS since 2011. He is also currently visiting professor in the Department of Economics at University College London.

Jonathan Cribb
Jonathan is an Associate Director and Head of Retirement, Savings and Ageing sector, focusing on pensions, savings and later-life economic activity.
More from IFS
Understand this issue


Policy analysis


Academic research


