Downloads
R136.pdf
PDF | 872.74 KB
Download press release | Download full report
Debates over living standards, poverty and inequality in the UK are often hampered by the fact that official data on household incomes are available only with a significant lag. Currently, the latest statistics are for 2015–16. In this report, we attempt to fill this gap by estimating what has happened since 2015–16 to household incomes and poverty rates. We also look at how they might evolve up to 2021–22 if current tax and benefit policy plans are kept to and if the macroeconomic forecasts from the Office for Budget Responsibility (OBR) – for things such as earnings and employment – were correct.
Key findings
- Real median income is projected to grow by around 5% between 2015–16 and 2021–22 – but this is highly sensitive to future earnings growth. Real median income in 2015–16 (latest data) stood 3.7% above its pre-recession level. We project that median income has grown by around 1% in total over the past two years and will grow by around 4% in total over the next four years. This is very slow growth by historical standards, and would leave real median income in 2021–22 around 20% lower than if growth since 2007–08 had continued in line with the long-run trend. But these projections depend upon what happens to pay: our previous report showed that for every percentage point (ppt) that earnings growth differs from the OBR expectation, median income growth differs by 0.6ppts per year.
- While income inequality has fallen since the recession, it is projected to rise over the next four years. Between 2007–08 and 2015–16, real incomes rose by 7.7% at the 10th percentile but fell at the 90th percentile. However, this trend is projected to be reversed over the next four years, as real earnings growth boosts the incomes of high-income households and working-age benefits are cut. This is especially true if incomes are measured after housing costs have been deducted: we project that AHC incomes below the 20th percentile will fall in real terms between 2015–16 and 2021–22. However, the future path of inequality is highly dependent upon the distribution of growth in workers’ earnings, which is itself highly uncertain.
- The official rate of relative AHC poverty is projected to rise by over 2ppts between 2015–16 and 2021–22. All of the projected increase in relative poverty is driven by relative child poverty, which is projected to increase by almost 7ppts. The relative poverty rates among pensioners and working-age non-parents are projected to remain fairly constant. Planned tax and benefit reforms account for about a third of the projected increase in relative poverty.
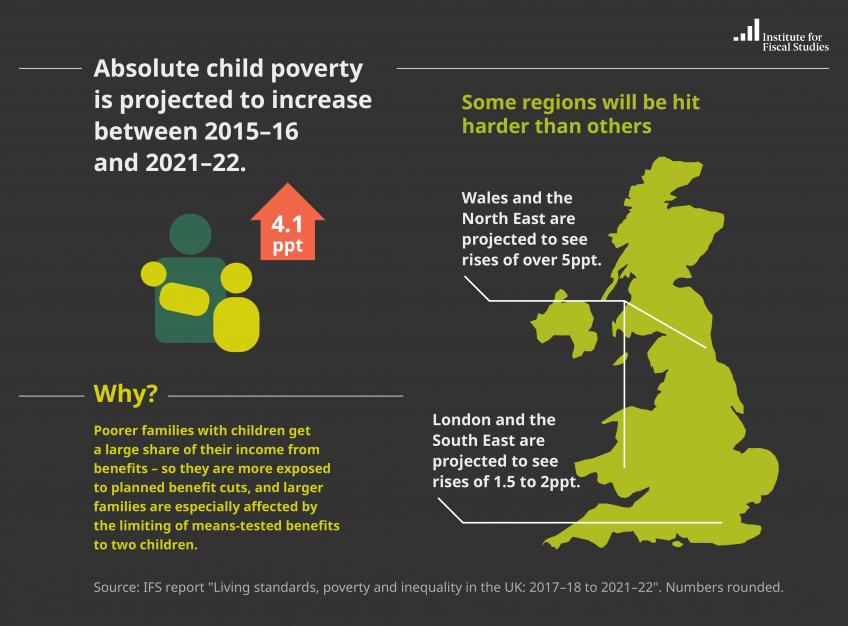
- With real incomes of poor households stagnant or falling, the official rate of absolute AHC poverty is projected to remain roughly unchanged between 2015–16 and 2021–22, but to increase for children. These projections are somewhat sensitive to the path and distribution of future earnings growth, but tax and benefit policies also matter: planned reforms are projected to increase absolute poverty by about 1ppt. Absolute child poverty is projected to rise by around 4ppts, primarily due to the impact of planned reforms. Absolute pensioner poverty is projected to fall by over 2ppts, due in large part to the fact that beyond 2018 the basic state pension and pension credit are projected to rise in line with earnings.
- Different regions face differing prospects for overall absolute poverty, but all are projected to see absolute child poverty rise between 2013–2015 and 2019–2021. Absolute poverty is projected to fall in southern regions, the East, Yorkshire & the Humber and Scotland, but rise in the North East, the North West, Wales, Northern Ireland and the Midlands. Although absolute child poverty is projected to increase in each nation and English region, the largest projected rises are in the North East, East Midlands and Wales, which see increases of at least 5ppts. With the exception of London, poverty is generally projected to rise more in areas where it is already higher. The relative fortunes of different regions could be different from our projections if there is significant geographical variation in future growth in rent or pay.
- Differences in projected poverty trends across the country are partly driven by the share of income that low-income families get from earnings. Working-age families in poverty or just above the poverty line in regions such as London and the South East get over half of their income from earnings, whereas those in the North East get only about a third (with most of the rest of their income coming from benefits). Families that are more dependent on benefits are more exposed to benefit cuts, and gain less when real earnings rise.
- The projected impact of upcoming tax and benefit reforms on poverty varies across regions, partly due to the differing effects of limiting the child element in tax credits and universal credit to the first two children in a family. This ‘two-child limit’ is projected to increase overall absolute poverty by a little under 1ppt and absolute child poverty by over 2ppts. Some regions are affected much more heavily than others: Northern Ireland and the West Midlands, with twice as many large poor families as Scotland and the South West, are projected to see a larger increase in poverty as a result of the policy.
There is, of course, significant uncertainty around any macroeconomic forecasts, and hence around any projection of future trends in household incomes based on those forecasts. Notably, the OBR has already indicated that it will downgrade its forecast for productivity – the key driver of earnings – at the Budget later this month. Such a downgrade would leave our projections for median income (based on the OBR’s March forecast) looking optimistic. However, our poverty projections, and those for relative poverty in particular, are less sensitive to forecast earnings growth.
Snapshot of our findings...
Authors

Andrew Hood

Tom Waters
Tom is an Associate Director at the IFS and Head of the Income, Work and Welfare sector.
More from IFS
Understand this issue


Policy analysis


Academic research


