Last updated: 28 September 2015
Pre-crisis, UK government spending was around 40% of national income. This level was not particularly high, either by the UK’s own historical standards or by international standards. However, over the financial crisis, the UK government experienced a particularly large increase in spending as a share of national income.
In 2014, the UK was not an outlier by international standards in terms of government spending as a share of national income. UK total government disbursements, as measured by the OECD, were 44% of national income. As shown in Figure 1, this gave the UK the fourteenth highest level of public spending as a proportion of national income out of the 31 countries for which the OECD has consistent data, and the third highest out of the G7 countries.
Figure 1. Total public spending in OECD countries, 2014
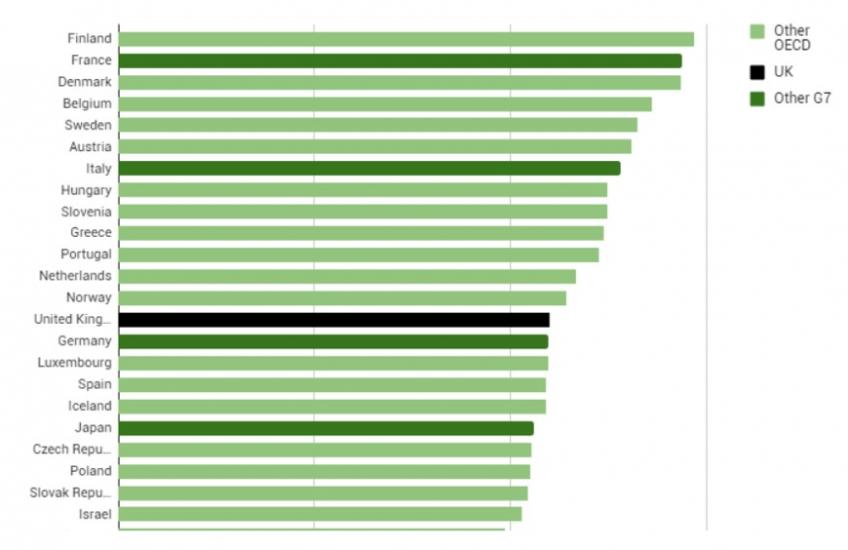
Note: Figure refers to general government total disbursements.
Source: OECD Economic Outlook No. 97 - June 2015.
Figure 1 masks the different path of government spending in the UK relative to other developed countries. If the snapshot shown in Figure 1 had been taken 10 years earlier, the UK would have appeared to have relatively lower spending as a share of national income. Figure 2 therefore shows how the changes in government spending as a proportion of national income in the UK between 1970 and 2014 compared with the experience of a selection of other countries.
Figure 2. Total public spending as a share of national income in selected countries, 1970 to 2014 (%)
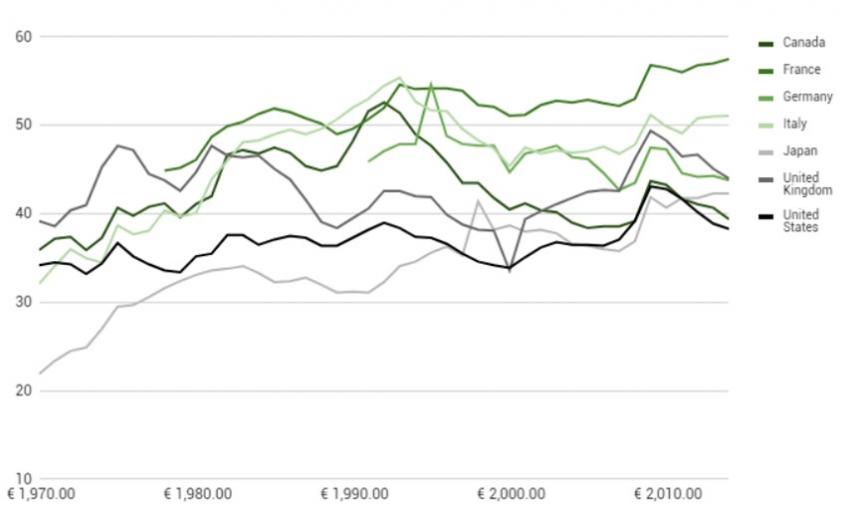
Note: Figure refers to general government total disbursements. UK spending in 2000–01 is not adjusted for the sale of the 3G spectrum, and spending in 2012–13 is adjusted neither for the transfer of assets from the Royal Mail pension plan to the public sector nor for the sale of the 4G spectrum.
Source: OECD Economic Outlook No. 97 - June 2015.
All countries shown saw increases in government spending during the recession of the early 1990s, which were then reversed by the late 1990s. In 2000, the UK had lower government spending as a share of national income than France, Germany and Italy. The expansion of government spending over the early to mid 2000s brought the UK closer towards these three European countries, which typically either maintained or saw falls in their levels of public spending as a share of national income over this period. All countries saw their public spending rapidly increase as a share of national income between 2007 and 2009 as a result of the recession. The position of the UK shown in Figure 1 should be taken in the context of the increase in UK government spending of 6.8% of national income between 2007 and 2009 – this was the largest among the countries shown in Figure 2.