Last updated: 29 September 2015
Social security is the largest single component of public spending. Spending on social security has steadily increased in real terms and as a share of national income since the modern welfare state was introduced after the Second World War, as shown in Figures 1a and 1b. In 1948–49, social security spending accounted for around 3.3% of national income; by 2009–10, it had reached 12.5%. Social security has also taken up an ever-increasing proportion of public spending: in 1948–49 it accounted for around a tenth of all spending, whereas today it accounts for closer to 30%.
Figure 1a. Social security in real terms (£ billion, 2015–16 prices), 1948–49 to 2020–21
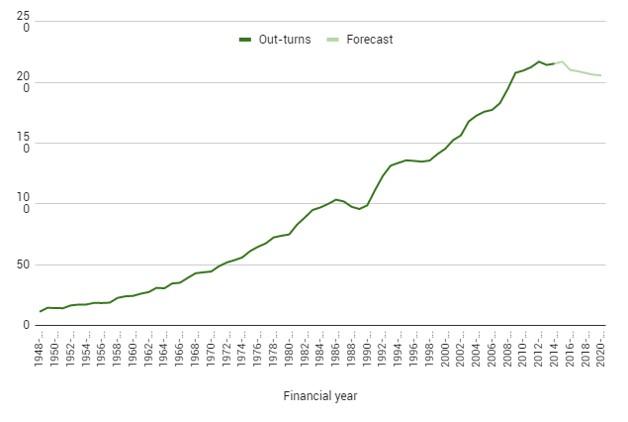
Source: Authors' calculations based on Department for Work and Pensions, Benefit Expenditure and Caseload Tables and Office for Budget Responsibility, Public Finances Databank and July 2015 Economic and Fiscal Outlook. Converted into real terms using the GDP deflator.
Figure 1b. Social security as a share of national income (%), 1948–49 to 2020–21
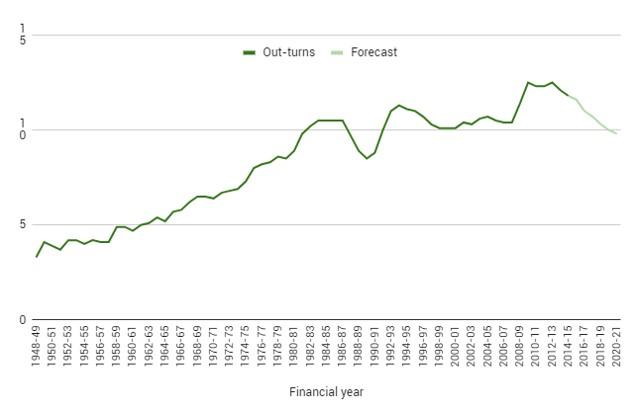
Source: Authors' calculations based on Department for Work and Pensions, Benefit Expenditure and Caseload Tables and Office for Budget Responsibility, Public Finances Databank and July 2015 Economic and Fiscal Outlook.
Social security spending can increase for two reasons. First, for a given set of eligibility criteria and benefit generosity, the population eligible for benefits may increase – for example, because of an economic downturn increasing the number of unemployed people or because of an ageing population increasing the number of state pension claimants. Second, government policy may increase or decrease the generosity of the social security system, or loosen/tighten the eligibility criteria for benefits, which would raise or lower social security spending on a particular population.
Figure 2 shows real spending on social security split between spending on pensioner-specific benefits (such as state pensions) and spending on all other benefits. Spending on both has clearly risen over time, and until the 1980s spending on pensioner-specific benefits accounted for around half of total benefit spending. The figure shows three periods of accelerating spending on non-pensioner-specific benefits: first, during the early 1990s; next, after the Labour government took office in 1997–98 up until 2003–04; and finally, at the end of the 2000s. The first and last of those were due to recessions driving up working-age benefit spending, whereas the acceleration from 1997–98 to 2003–04 happened in a period of relative prosperity, as the government expanded spending on areas such as tax credits. As working-age benefit spending was increasing more quickly than unemployment, this period of expansion represented an increase in benefit generosity per head, rather than an increase in the number of claimants.
Figure 2. Real spending on working-age and pensioner benefits, 1948–49 to 2014–15 (£ billion, 2015–16 prices)
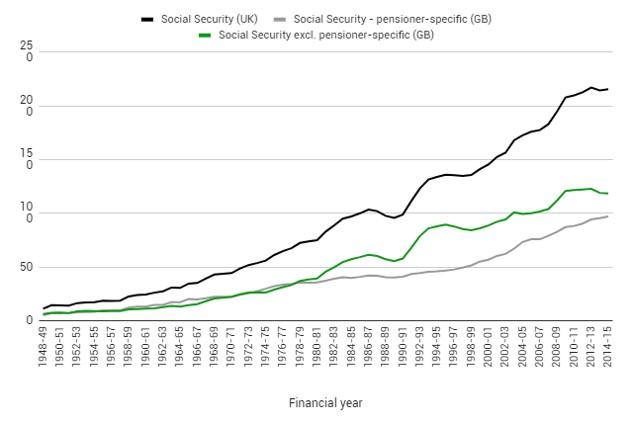
Note: Council tax benefit is excluded from social security spending as in the National Accounts it is taken to be a negative tax. Figures are converted into real terms using the GDP deflator.
Source: Authors’ calculations based on Department for Work and Pensions, Benefit Expenditure and Caseload Tables 2015. GDP deflators are derived from the Office for Budget Responsibility, Public Finances Databank and ONS series YBHA and ABMI.
Useful resources
- Survey of the GB benefit system
- Welfare trends report from the Office for Budget Responsibility
- Briefing note on long-term trends and recent changes to the social security system in the UK
- Briefing note on the coalition government's record on benefit spending and reforms
- Fiscal facts containing information on benefit spending and benefit rates
- Briefing note on the history of the UK state pension from 1948 to 2010
For more information regarding social security spending, contact Andrew Hood.