Last updated: 29 September 2015
In 2014, the UK government spent £12.0 billion on official development assistance (ODA), as defined here by the OECD. This sum amounted to 0.67% of gross national income (GNI), slightly below the official target of 0.7% of gross national income. However, on a measure excluding some accounting changes implemented in September 2014 that affected estimated GNI, spending was 0.71% of GNI.
Figures 1a and 1b show ODA spending over time, in real terms and as a share of gross national income. The sharp increase between 2012 and 2013 was as a result of the government fulfilling its pledge to meet the UN target for aid spending (of 0.7% of GNI) in 2013. This goal of 0.7% is a long-standing international recommendation from a commission set up by the World Bank in 1969, subsequently endorsed by the UN and later in 2005 by those at the G8 summit in Gleneagles, Scotland. In March 2015, the target was set in UK legislation. In September 2014, there was a major revision to the methodology used for calculating GNI, which led to an increase in calculated GNI. This retrospective accounting revision meant that the government narrowly missed its target for 2013. However, on the old basis (shown in Figure 1b) the target was met.
Figure 1a. Official development assistance spending in real terms (£ billion, 2015–16 prices), 1970 to 2020
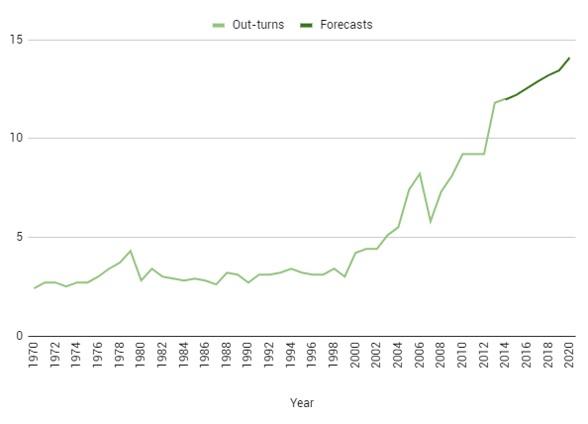
Note: Forecast assumes that ODA grows in line with GDP beyond 2014.
Source: Department for International Development, Statistics on International Development.
Figure 1b. Official Development Assistance spending as a share of gross national income (%), 1970 to 2020
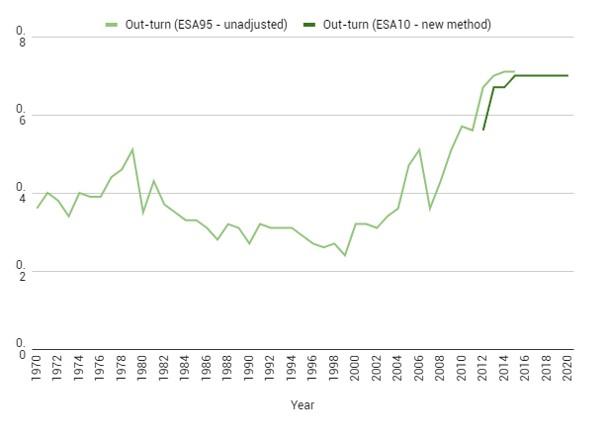
Note: Forecast assumes that ODA reaches 0.7% of GNI in 2015.
Source: Department for International Development, Statistics on International Development.
Figure 2 shows that the UK devotes a relatively high proportion of GNI to ODA by international standards. However, ODA spending still represents a tiny fraction of overall spending, and committing to 0.7% of GNI has only a small effect on the amount of money available for other areas of spending. The Scandinavian countries give a comparatively large share of their GNI in ODA – in excess of the 0.7% target – in contrast to countries such as Canada, Portugal, Spain and the US, which are all far short of 0.7%. However, the numbers in Figure 2 exclude private flows of aid, which are not captured in the ODA measure, and there are significant such flows originating in the US.
Figure 2. ODA from the UK and other countries as a percentage of GNI, 2014
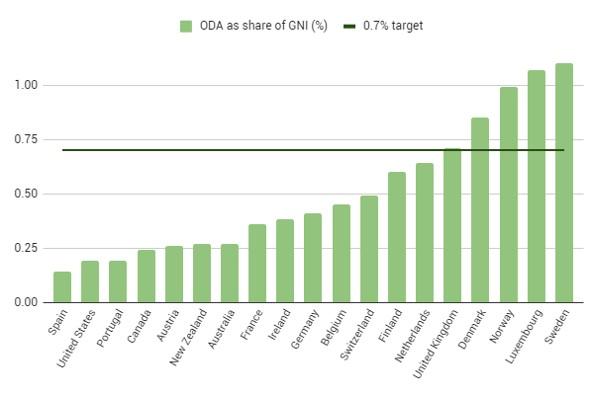
Source: OECD, Statistics on resource flows to developing countries, table 4 – Net Official Development Assistance by DAC Country.
Useful resources
- Department for International Development statistics
- OECD definition and coverage of ODA
- 2012 Green Budget chapter on UK development aid
- House of Commons Library Standard Note on the 0.7% target
- OECD statistics at compareyourcountry.org