While a proportion of this borrowing was purely cyclical (that is, just a result of short term economic weakness), a large proportion of it was judged to be structural (that is, a permanent hole in the public finances). Since the crisis, successive governments have planned and implemented a fiscal consolidation in an attempt to reduce structural public sector borrowing dramatically as a proportion of national income (GDP).
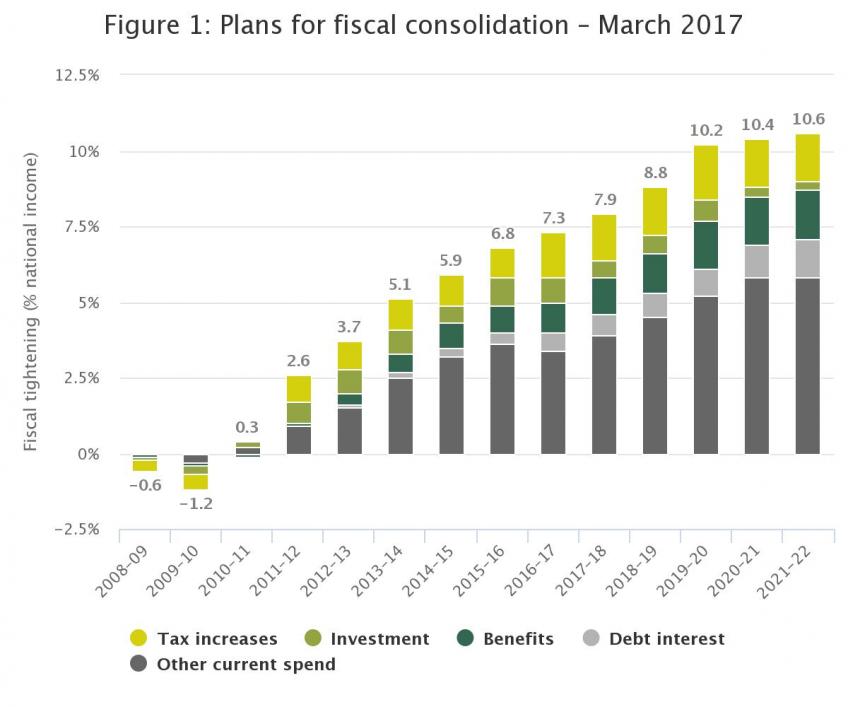
As of Budget 2017, the total value of discretionary tax increases and spending cuts announced since Budget 2008 is expected to be 10.6% of national income (see Figure 1), or around £199 billion in today’s terms. Of this tightening, around 16% (or 1.7% of national income) is expected to be achieved through net tax rises, while the other 84% (or 8.9% of national income) is expected to be achieved through reductions in public spending.
By the end of 2016–17, just over than two-thirds of the consolidation (that has been specified so far) had been completed. The rest is to be implemented over the years 2017–18 to 2021–22. However, the current fiscal targets require the deficit to be eliminated by 2024–25, so further consolidation is forecast to be required beyond 2021–22.
Source: IFS calculations using all HM Treasury Budgets and Pre-Budgets between November 2008 and March 2010 (available at http://webarchive.nationalarchives.gov.uk/20130129110402/http://www.hm-treasury.gov.uk/budget_archive.htm) and all OBR Economic and Fiscal Outlooks between June 2010 and March 2017 (available at http://budgetresponsibility.org.uk/efo/economic-fiscal-outlook-march-2017/ ).
You can download the data here.
Notes: See bottom of this page for methodology
How has the size of the response changed over time ?
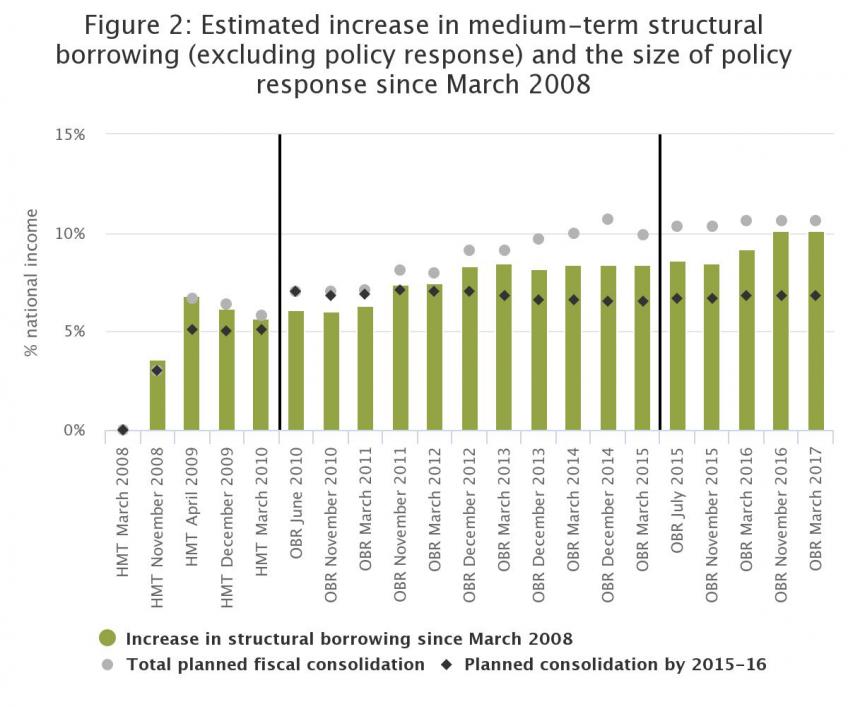
The planned fiscal consolidation has changed considerably over time, both in terms of overall size and composition. Figure 2 shows how the estimated structural 'hole' in the public finances, and the corresponding size of the fiscal response has changed since 2008. For example:
- In March 2010, the UK's structural deficit was estimated to have increased by 5.7% of national income since before the crisis (i.e. March 2008) and the government was planning fiscal tightening worth 5.8% of national income.
- By March 2017, the underlying increase in structural borrowing was estimated actually to be much larger (at 10.1% of national income), while the planned fiscal tightening had increased to 10.6% of national income.
Some forecasts - for example, those made in March 2009, November 2011 and March 2016 - increased the estimated size of the underlying deterioration in the public finances considerably. Both of these were accompanied by an increase in the planned size of the fiscal consolidation. At other times - for example, in June 2010 (the coalition government's first budget) and December 2014 - the estimated size of the problem was not much changed but the proposed size of the response nonetheless increased markedly.
How has the timetable for fiscal tightening changed over time ?
As a result of the worsened outlook for the public finances since 2010, the consolidation is now expected to be larger and to last much longer than originally intended. In March and June 2010, the plan was for the structural problem to have been eliminated by 2015-16, while Budget 2017 implied that the consolidation would need to extend beyond 2021–22.
It is worth noting that this extension of the timetable for consolidation was not a result of the government failing to implement its plansthe tax raising measures or spending cuts it had proposed. Figure 2 shows that the consolidation that was planned for 2015-16 remained fairly stable from June 2010 onwards. Instead, the structural problem has proved to be much larger than originally anticipated – in large part as the expected cash size of the UK economy has been revised down. In addition and so extra measures have had to be planned.the Chancellor is now seeking to eliminate the deficit entirely rather than allow borrowing up to the amount spent on investment.
Source: IFS calculations using all HM Treasury Budgets and Pre-Budgets between November 2008 and March 2010 (available at http://webarchive.nationalarchives.gov.uk/20130129110402/http://www.hm-treasury.gov.uk/budget_archive.htm) and all OBR Economic and Fiscal Outlooks between June 2010 and March 2017 (available at http://budgetresponsibility.org.uk/efo/economic-fiscal-outlook-march-2017/ ).
You can download the data here
Notes: See bottom of this page for methodology
How has the composition of the planned fiscal tightening changed over time ?
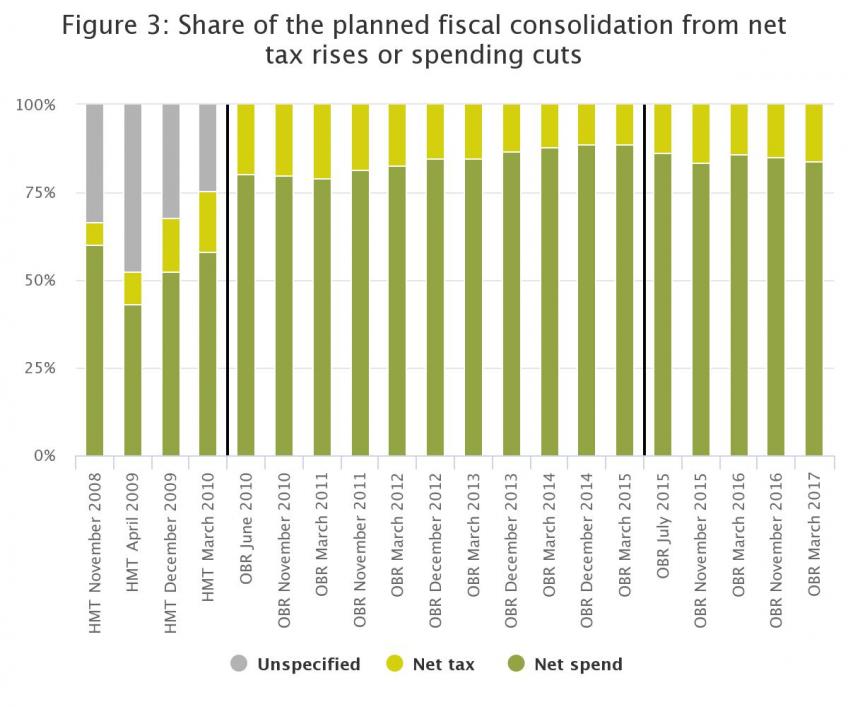
The proposed fiscal response has also differed over time in terms of its reliance on tax rises as opposed to spending cuts. Figure 3 shows how the balance of the proposed medium term consolidation has changed over time. In March 2010, 24% of the specified tightening was to be achieved through tax rises (though almost ¼ of the planned overall tightening was unspecified at that stage). Budget 2017 plans implied that net tax rises would account for around 16% of the tightening planned so far, while the latest plans imply that around 14% of the overall consolidation will be achieved through tax rises, with the rest achieved by spending cuts.
Source: IFS calculations using all HM Treasury Budgets and Pre-Budgets between November 2008 and March 2010 (available at http://webarchive.nationalarchives.gov.uk/20130129110402/http://www.hm-treasury.gov.uk/budget_archive.htm) and all OBR Economic and Fiscal Outlooks between June 2010 and March 2017 (available at http://budgetresponsibility.org.uk/efo/economic-fiscal-outlook-march-2017/ ).
You can download the data here.
Notes: See bottom of this page for methodology
Useful resources
The 2015 IFS Green Budget chapter on the fiscal consolidation under the coalition government.
Previous observations written by IFS researchers on this topic may also be of interest:
- Gemma Tetlow, Getting off the rollercoaster, Institute for Fiscal Studies, 15 July 2015, Observation
- Gemma Tetlow, Cutting the deficit: five years down, four to go?, Institute for Fiscal Studies, 27 March 2015, Observation
- Gemma Tetlow, Cutting the deficit: four years down, five to go?, Institute for Fiscal Studies, 29 April 2014, Observation
- Gemma Tetlow, Cutting the deficit: three years down five to go?, Institute for Fiscal Studies, 8 May 2013, Observation
Methodology: Measuring the size, composition and timing of the fiscal consolidation
There are a number of ways that one could define the size of the fiscal consolidation that has been announced since the crisis started. The method we follow essentially aims to quantify the difference between the levels that spending and revenues are now expected to be at and the levels they would have been at in the absence of any new policy announcements since March 2008. Three broad types of policy changes have been announced since March 2008: changes to taxes, changes to benefits and changes to public service spending.
The size of the fiscal consolidation arising from tax and benefit changes is taken to be the sum of the official estimates of the impact of tax and benefit policy changes (respectively). These costings are published alongside the policy announcements in Budgets, Pre-Budget Reports and Autumn Statements, and start from existing government policy - including the assumption that tax and benefit thresholds are increased each year using the normal uprating rules.
Measuring the size of the fiscal consolidation arising from changes to public service spending is more difficult, and requires us to define a counterfactual - what would have happened to levels of spending in the absence of policy change. The fiscal consolidation can then be calculated as the difference between actual (or the latest forecast for) spending and this counterfactual.
For years up to 2012-13, we take as the counterfactual the plans set out in the March 2008 Budget. At that point, the then government had set out plans for overall spending for the two years beyond 2010–11 (the end of the then current spending review period) alongside some small medium-term tax increases. A the time these were for The spending plans were for a real-terms increase in current spending, with investment held constant as a share of national income; this implied that overall spending would fall as a share of national income. To the extent that real spending is less than this baseline, this is part of the consolidation.
Beyond 2012-13, we have no explicit pre-crisis spending plans. There are perhaps two obvious counterfactuals we could take. One would involve an assumption that, had the crisis not happened, real-terms spending would have stayed constant. This seems to us an entirely unrealistic scenario; it would have implied the size of the state shrinking and borrowing falling (and, ultimately, a surplus growing) indefinitely. Much more plausible is an assumption that spending would have risen in line with trend national income; certainly no period since the Second World War has seen a sustained cut to public spending as a share of national income. So, from 2012-13, we take as our counterfactual that total spending grows in line with national income..