Last updated: 29 September 2015
After significant real-terms growth in defence spending up to the early 1980s, defence spending fell from 5.0% of national income in 1984–85 to 2.4% in 1997–98. Defence spending rose gradually in real terms through the 2000s, reflecting commitments in Iraq and Afghanistan, though the decline as a share of national income continued. Since 2010–11, defence spending has been cut both in real terms and as a share of national income.
Figure 1a shows how defence spending grew substantially in real terms between the late 1950s and the early 1980s, but then fell dramatically between the mid 1980s and the end of the 1990s.1 The decline began shortly before the end of the Cold War, when the UK’s five-year commitment to NATO (to increase defence spending by 3% a year) ended. This decline was slowly reversed after the end of the 1990s, as defence spending was increased to fund the ‘war on terror’ and UK military commitments in Iraq and Afghanistan. Defence spending then started to fall again after 2010–11, as the UK withdrew from Iraq (in 2011) and then from Afghanistan (in 2014), and in the context of overall spending cuts from 2010–11.
The strong economic growth experienced in the UK between the late 1990s and the late 2000s meant that, despite the increase in defence spending in real terms, defence spending fell as a share of national income (shown in Figure 1b). Defence spending as a share of total public spending has also been in gradual decline since the mid-1980s, falling from 10.7% in 1985–86 to 6.6% in 1997–98, and reaching 5.0% by 2014–15.
Figure 1a. Defence spending and Ministry of Defence budget in real terms (£ billion, 2015–16 prices), 1953–54 to 2015–16
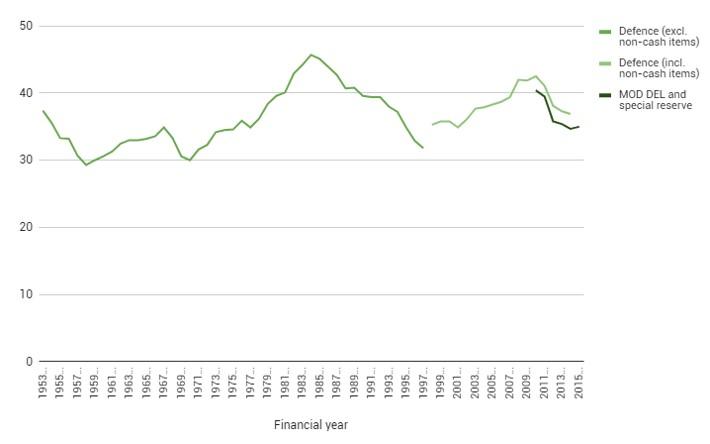
Note: Special reserve is a sum of money assigned for unanticipated increases in the need for defence spending, and is a cap rather than a target for extra spending in this area. Defence spending is slightly higher than MoD DEL as some defence spending (such as the intelligence agencies) is allocated by the Cabinet Office.
Source: Historical data and projections for UK defence spending are from HM Treasury, Public Expenditure Statistical Analyses (PESA) 2015 and previous PESAs.
Figure 1b. Defence spending and Ministry of Defence budget as a share of national income (%), 1953–54 to 2015–16
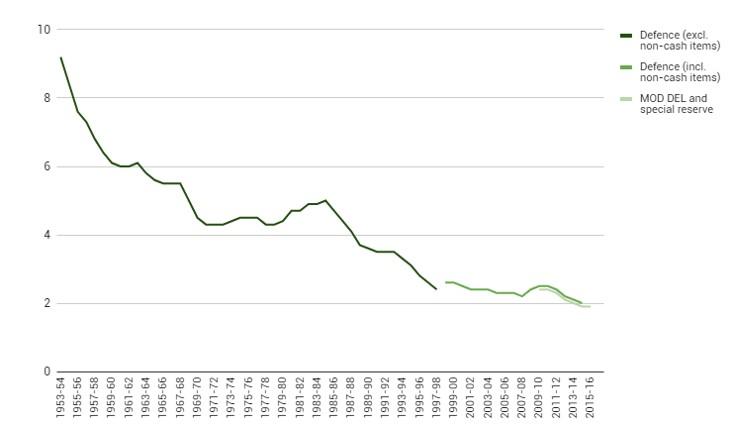
Note: Special reserve is a sum of money assigned for unanticipated increases in the need for defence spending, and is a cap rather than a target for extra spending in this area. Defence spending is slightly higher than MoD DEL as some defence spending (such as the intelligence agencies) is allocated by the Cabinet Office.
Source: Historical data and projections for UK defence spending are from HM Treasury, Public Expenditure Statistical Analyses (PESA) 2015 and previous PESAs.
The future for defence spending
The outlook for total public spending going forwards is likely to place pressure on the defence budget. In October 2010, the coalition government published its Strategic Defence and Security Review, setting targets for national security capabilities by 2020, in the context of a tight budgetary framework. It set out plans for priority areas that would be relatively protected from spending cuts, pencilled in cuts to the civilian workforce and highlighted opportunities for asset sales and efficiency savings.
The government has a (non-binding) commitment as a member of the North Atlantic Treaty Organisation (NATO) to spend at least 2% of national income on defence. Figure 1b shows that up until 2014–15, the government has met this commitment. In the July 2015 Budget, the Chancellor pledged to meet this commitment in each year of the current decade, and to increase the Ministry of Defence budget by 0.5% per year in real terms until 2020–21.
Useful resources
- House of Commons Library Standard Note on the NATO 2% target
- Royal United Services Institute