Last updated: 29 September 2015
In the 2014–15 financial year, the UK government spent £34 billion overall on servicing its debt, which amounted to 4.6% of overall spending. The government also receives interest and dividends on the assets that it holds; taking this into account, spending on net debt interest payments was £28 billion, or 3.8% of total spending.
Figure 1 shows spending on net debt interest payments over time. Since the middle of the twentieth century, spending on net debt interest payments has fluctuated between about 1.5% and 4.5% of national income, with a low point in around 2005–06, just before the financial crisis and recession.
Figure 1. Public sector net debt interest payments as a share of national income (%), 1948–49 to 2020–21
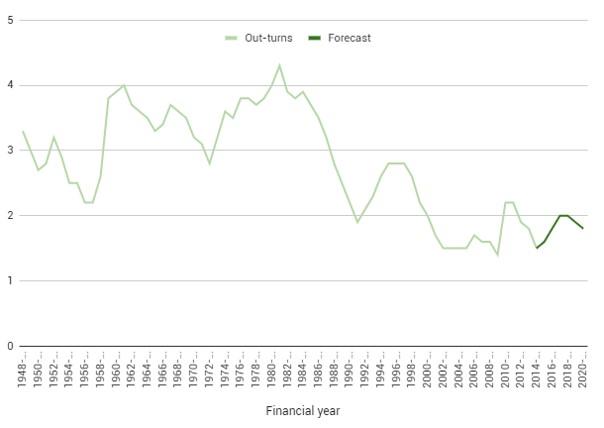
Source: Net debt interest payments are from Office for National Statistics series JW2L and JW2P from Public Sector Finances and Office for Budget Responsibility forecasts from the OBR's Economic and Fiscal Outlook: July 2015.
The size of net debt interest payments depends on three main factors:
1. The stock of debt
2. The cost of borrowing (i.e. the interest rate)
3. Inflation
The greater the stock of debt, or the higher the rate of interest payable on the borrowed funds, the greater will be the debt interest payments. Also, since most UK government bonds are nominal rather than index-linked, the higher inflation is, the more quickly will the real value of the existing debt stock be reduced, and the lower will be the real borrowing cost on that debt. Higher inflation therefore reduces the real cost of servicing public sector debt, although it would likely increase the cost of financing new borrowing.
Figure 2 provides context for the changing spending on debt interest payments over time by showing the size of the net debt stock over time. It includes two different measures of UK government debt: ‘public sector net debt’ (excluding the temporary impact of financial interventions) and ‘national debt’. Public sector net debt is a more comprehensive measure than national debt, but data is only available from 1974.
Figure 2. Debt as a share of national income (%), 1948–49 to 2020–21
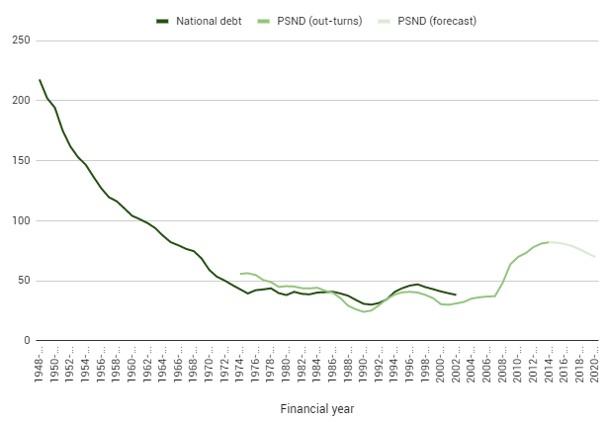
Note: National debt is on a calendar-year basis. Public sector net debt (PSND) is on a financial-year basis.
Source: National debt is from the UK Debt Management Office. Public sector net debt is from ONS, series HF6W. Forecasts are from the OBR's Economic and Fiscal Outlook: July 2015.
National debt fell from a peak of around 270% of national income immediately after the Second World War, to 218% by 1948-49. Between 1955 and 1970, strong growth in national income resulted in a reduction in the stock of debt as a proportion of national income. From the early 1970s to the mid 1980s, debt was fairly stable. However, the high inflation of the period meant that investors demanded higher nominal interest rates, which increased the cost of government borrowing. This resulted in the increase in debt interest payments seen in Figure 1. Then, during the late 1980s, both inflation and public sector debt fell as a share of the economy, and so spending on net debt interest payments decreased.
In the recession of the early 1990s, government borrowing increased and, in the absence of the high inflation seen in the 1970s, public sector net debt increased as a share of national income. Spending on debt interest payments therefore also increased quickly over that period. However, from 1997, debt interest spending fell dramatically. A major factor contributing to this (in addition to the decline in the debt stock over this period) was a reduction in market expectations of long-run interest rates, which was associated with the independent control of interest rates afforded to the Bank of England in 1997.
The financial crisis has resulted in a dramatic increase in government debt since 2007–08, both due to the decline in national income and due to the government running sizeable budget deficits each year. Consequently debt interest payments are forecast by the Office for Budget Responsibility to increase significantly over the next few years, despite the government's cost of borrowing remaining low by historical standards.
Useful resources
- 2015 Green Budget chapter discussing the risks of high government debt and providing an international comparison of the level of debt and debt interest payments