Downloads
BN201.pdf
PDF | 384.73 KB
Key findings
- UK public health spending grew in real terms by an average of 1.3% per year between 2009–10 and 2015–16. This is substantially below average growth of 4.1% per year between 1955–56 and 2015–16. Spending growth under the coalition government was the lowest five-year average since records began (though generous compared with the cuts to spending in other government departments over the same period).
- Total UK health spending, including both public and private expenditure, was in line with the unweighted EU-15 average (9.8% of national income) in 2015. However, it was substantially below the levels of the US (16.9%), Japan (11.2%), Germany (11.1%) and France (11.0%).
- Department of Health (DH) spending is set to increase by £8.2 billion (7.0%) between 2014–15 and 2020–21. Within the DH budget, spending on NHS England will increase by £11.6 billion (11.3%) over the same period. This includes a £9.0 billion increase between 2015–16 and 2020–21, and is consistent with the 2015 pre-election pledge to increase NHS funding by £8 billion. Other DH spending will fall by £3.4 billion (21.1%). Even so, in 2019–20, DH spending will be slightly below the amount needed just to maintain spending per person at 2009–10 levels once the growth and ageing of the population are taken into account.
- Public sector pay restraint has helped NHS inflation to stay below economy-wide inflation since 2011–12. However, pay restraint may be hard to continue going forward.
- Recent projections from the Office for Budget Responsibility (OBR) indicate that health spending is likely to increase considerably over the next 50 years. Regardless of short-term funding decisions, the next government faces a challenge to design and implement a long-run solution to these spending pressures.
UK public spending on health has increased considerably over time
Figure 1 shows how UK public spending on health has increased in real terms (after accounting for economy-wide inflation), and as a share of national income, between 1955–56 and 2015–16. Real spending increased from £12.8 billion in 1955–56 to £143.7 billion in 2015–16 (2017–18 prices). This growth in spending is larger than the increase in national income over this period. As a result, health spending increased from 2.8% of national income in 1955–56 to 7.4% in 2015–16. Health spending also increased at a quicker rate than other government spending. Health spending therefore grew from 7.7% of public spending in 1955–56 (or 11.2% of public service spending) to 18.4% of public spending in 2015–16 (29.9% of public service spending).
Figure 1. Annual UK public spending on health in real terms (2017–18 prices) and as a percentage of national income, 1955–56 to 2015–16
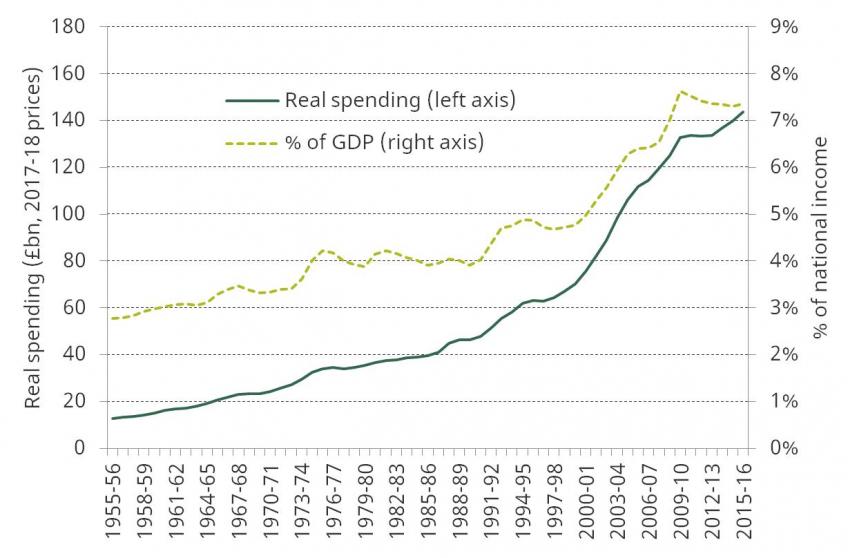
Growth in spending has varied over time, with large increases usually followed by smaller ones.[1] Over the whole period, spending grew by 4.1% per year on average. Spending since 2009–10 has grown at a much slower pace. Between 2009–10 and 2015–16, health spending has grown by 1.3% per year on average, with spending under the coalition government (2009–10 to 2014–15) growing at only 1.1%. This was the smallest five-year growth rate since records began. However, it is worth noting the context in which these more modest increases have taken place, with health one of only three main areas of public service spending (along with overseas aid and schools) that were protected from large cuts.
Real per-capita spending has increased over the long run, despite strong population growth
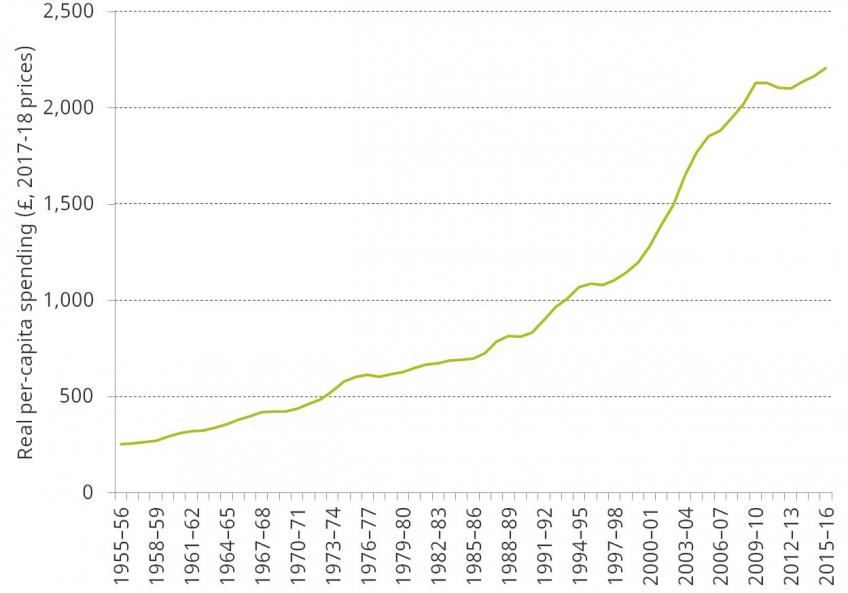
While health spending has considerably increased over time, so has demand for health services. One major driver of this increase in demand is population growth. Between 1955 and 2015, the UK population grew by 14.2 million people, or by 0.4% per year. This means that while health spending has grown by an average of 4.1% per year over this period, real per-capita spending has increased by 3.7%.
Figure 2 shows real per-capita UK public spending on health between 1955–56 and 2015–16. Per-capita spending experienced particularly rapid growth during the 2000s. Recent years have been characterised by strong population growth and weaker growth in health spending. As a result, real per-capita health spending increased by an average of 0.6% per year between 2009–10 and 2015–16. This compares with average increases of 4.0% between 1955–56 and 2009–10 and of 5.4% between 1996–97 and 2009–10.
Figure 2. Per-capita public spending on health in real terms (2017–18 prices), 1955–56 to 2015–16
Total health spending in the UK is in line with the EU-15 average, but is still lower than in many countries, including the US, France and Germany
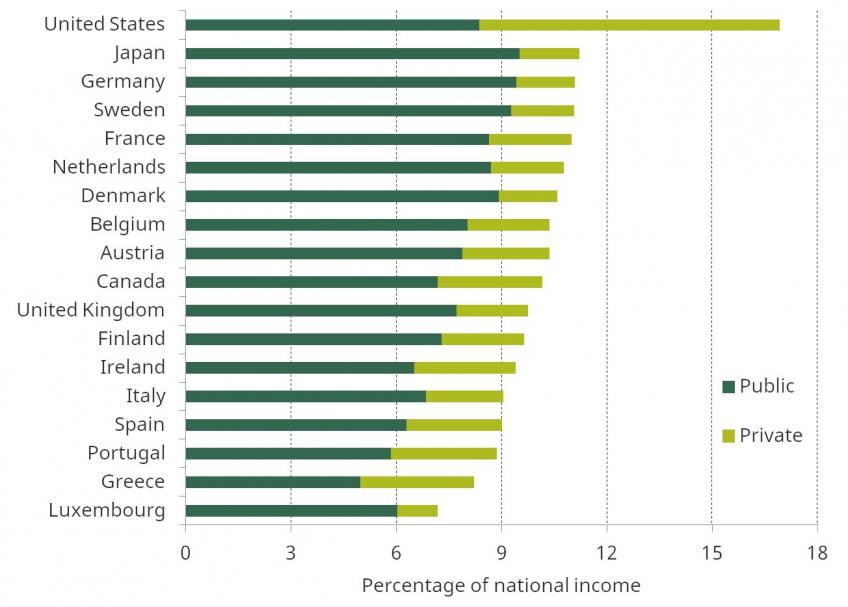
Figure 3 shows how total health spending in the UK (as a share of national income) compared with that in other countries in the EU-15 and G7 countries in 2015. This measure includes both public and private expenditure on health. UK spending was 9.8% of national income, 79% of which was accounted for by public spending.[2] UK spending was the same as the unweighted EU-15 average, but was substantially below the US (16.9%), Japan (11.2%), Germany (11.1%) and France (11.0%). Public spending accounted for a larger share of health spending in the UK than in most other EU-15 and G7 countries (79.0% compared with an unweighted average across all these countries of 75.0%).
Figure 3. Public and private health spending as a percentage of national income across the EU-15 and G7 countries, 2015
Health spending in England has increased since 2009–10, but at a historically slow rate and with sizeable cuts to non-frontline spending
Health spending in England is mostly the responsibility of the Department of Health (DH).[3] In 2015–16, DH spending was £121.5 billion (2017–18 prices). Real DH spending increased by £9.8 billion between 2009–10 and 2015–16. This is equivalent to an increase of 8.8%, or an average annual increase of 1.4%. This is far below the average increase in UK health spending over the previous 60 years (4.1% per year) but is considerably more generous than the large cuts to other departmental spending during this period.
Figure 4 shows how DH spending is set to change between 2014–15 and 2020–21 (under the 2015 Spending Review plans).[4] The black line shows additional DH spending in each financial year over this period relative to its 2014–15 level. Over the whole period, DH spending is set to increase from £118.3 billion to £126.5 billion, an increase of 7.0% (or an average increase of 1.1% per year).
Figure 4. Cumulative real changes to Department of Health spending set out by the 2015 Spending Review, 2014–15 to 2020–21, £ billion (2017–18 prices)
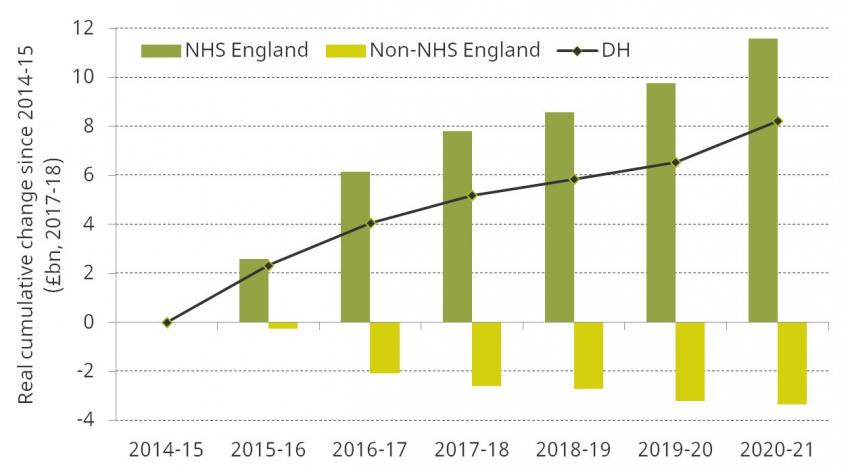
The majority of DH spending is on frontline health services, as delivered by the NHS. In 2014–15, NHS England accounted for 87.0% of the DH budget. The rest of the DH budget is spent on administration, funding public health initiatives and medical research, and training medical staff. Since 2014–15, funding for NHS England has increased at a quicker rate than overall DH spending. As a result, other DH spending has fallen over this period. Figure 4 also shows these changes. Between 2014–15 and 2020–21, NHS England spending is set to increase by £11.6 billion, or 11.3%. The planned increase of £9.0 billion on NHS funding between 2015–16 and 2020–21 would be sufficient to meet the pledge made before the 2015 election by then Prime Minister David Cameron to increase real funding by £8 billion (the pledge referred specifically to NHS funding rather than wider health spending). Over the same period, non-NHS-England spending will fall by £3.4 billion, or 21.1%. This is likely to have consequences for the non-health-service activities carried out by DH, and may also have spillover effects on the NHS if public health deteriorates (and therefore more NHS services are required) or if hospitals find it harder to recruit staff.
English DH spending in 2019–20 will be slightly below 2009–10 levels after taking into account the growth and ageing of the population
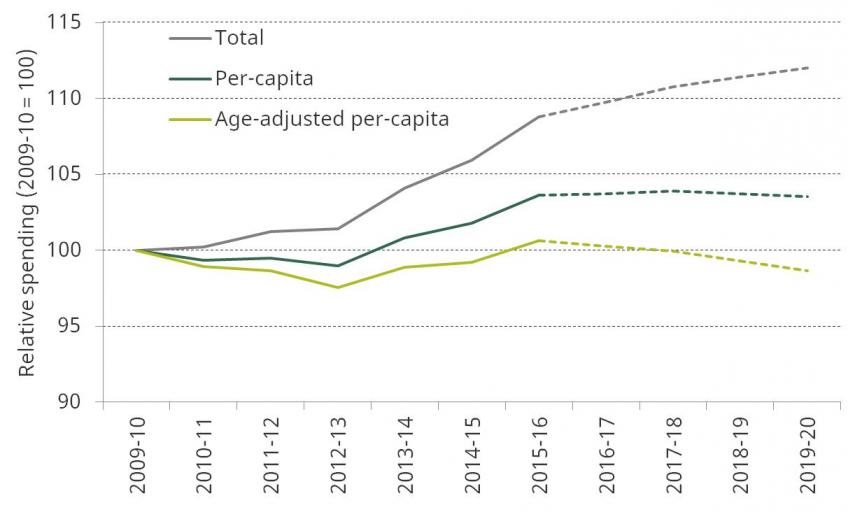
Demand for care has also increased since 2009–10. Two important factors are the size and age profile of the population. Between 2009–10 and 2015–16, the English population grew by 2.6 million people. This was an average increase of 0.8% per year, and the population is expected to continue growing at this rate until the end of the decade. Spending would therefore be required to increase at this pace between 2009–10 and 2019–20 to keep up with population growth alone.
Older individuals also tend to use more health care than younger individuals. For example, average public health spending was five times greater for an 85-year-old than for a 30-year-old in 2015. Between 2009 and 2019, the number of 85-year-olds in England is expected to increase by 16.1%. Health spending would need to increase by 1.3% per year (13.5% in total) to keep pace with both population growth and the changing age structure of the population between 2009–10 and 2019–20.
Figure 5 shows how changes to DH spending between 2009–10 and 2019–20 compare with these demographic pressures (solid lines show out-turns, dotted lines show planned spending). It shows that real DH spending is set to increase by 12.0% (1.1% per year) between 2009–10 and 2019–20. This is stronger than population growth over the same period (0.8% per year) and therefore real per-capita spending will increase by 3.5%. However, after accounting for changes to the age structure of the population, real age-adjusted per-capita spending will be slightly below 2009–10 levels in 2019–20 (a fall of 1.3%).
Figure 5. Real-terms Department of Health spending (2009–10 = 100), 2009–10 to 2019–20
The NHS faces a number of other demand and cost pressures, including pay pressure
Estimates from NHS England in 2013 indicate that non-demographic demand pressures – including a rise in the prevalence of chronic conditions and improvements in medical technology – could amount to 1.6% per year between 2013–14 and 2020–21.[5] Combined with the demographic pressures above, this suggests that demand for health care in England is likely to increase by around 3% per year. It should be noted, however, that these estimates are based upon historical trends, and estimating future pressures is a difficult exercise. NHS activity increased by an annual average of 4.9% between 1997 and 2014, with some of this increased activity occurring because of the increases in funding. If large funding increases do not occur in the coming years, then future growth in demand for care may actually be smaller than that estimated here.
Because the cost of employing people makes up a large part of health-care costs, the real cost of providing a given level of care is likely to increase over time. Figure 6 shows how the price of NHS Hospital and Community Health Services changed between 1985–86 and 2010–11, compared with economy-wide inflation (as measured by the GDP deflator). It shows that costs for the NHS increased at a higher rate (4.7% per year) over this period than economy-wide inflation (3.1% per year). However, the cost of non-labour goods and services (as measured by the health service cost index) was below general inflation (2.5% per year). The rapid increase in costs is instead explained by the much sharper rise in staffing costs (pay cost index), with an average increase of 5.7% per year over this period.[6] This represents an average increase in labour costs, relative to economy-wide inflation, of 2.5% per year.
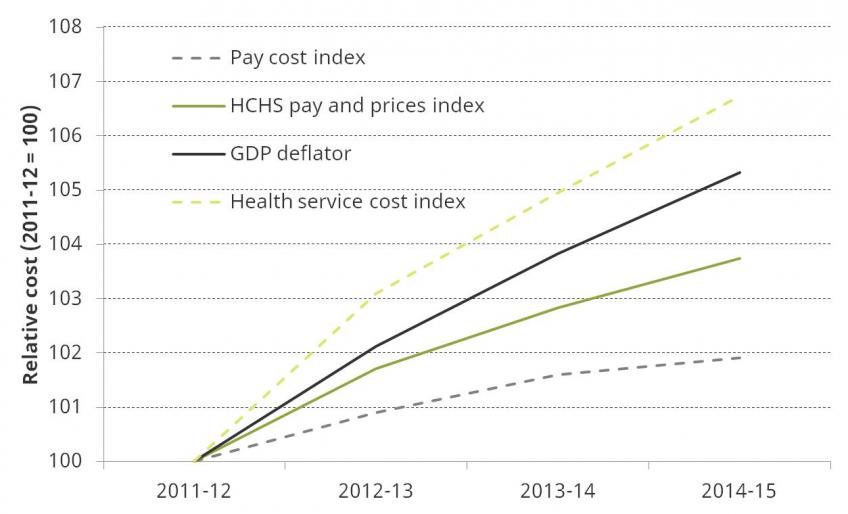
This pattern has reversed in recent years, as shown in Figure 7. Between 2011–12 and 2014–15, the overall health cost index grew by 1.2% per year, below economy-wide inflation of 1.7% per year. Non-labour goods and services have grown at a quicker pace (2.2% per year) while labour has increased at a much slower pace (0.6%). This represents an average annual fall of 1.1%, relative to economy-wide inflation, in NHS labour costs over this three-year period.
Figure 6. NHS Hospital and Community Health Services (HCHS) pay cost index and health service cost index, 1985–86 to 2010–11
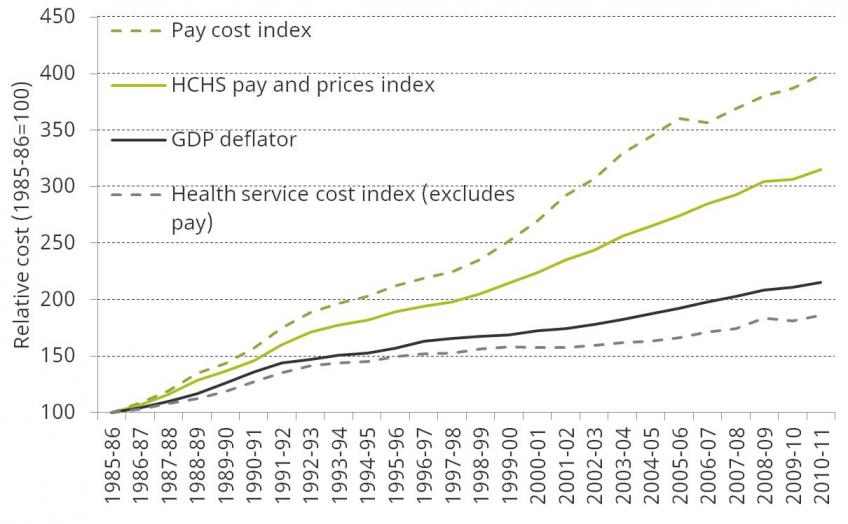
Figure 7. NHS Hospital and Community Health Services (HCHS) pay cost index and health service cost index, 2011–12 to 2014–15
The reduction in labour costs can in part be explained by pay restraint in the NHS. Public sector pay increases – including for NHS staff – have been capped at 1% since 2013–14 (with two years of nominal freezes before this for most staff) and are planned to continue until 2019. Increasing pay for NHS staff going forward would lead to increased cost pressures on the DH budget. In 2015–16, DH spent £48.7 billion on NHS provider staffing costs. This suggests that an across-the-board 1% increase in staff pay would add approximately £0.5 billion of cost pressures each year. Increasing NHS pay in line with inflation in 2017–18, 2018–19 and 2019–20 (the Consumer Prices Index is forecast to be 2.6%, 2.2% and 2.0% in these years respectively) would cost around £2 billion more in 2019–20 relative to increasing pay by 1% each year in cash terms (in line with the wider public sector pay cap to 2019). This funding would require either additional funding for the NHS or reductions in other (non-staffing) parts of the NHS or DH budget.
Regardless of short-term funding decisions, health spending is likely to increase substantially over the long run
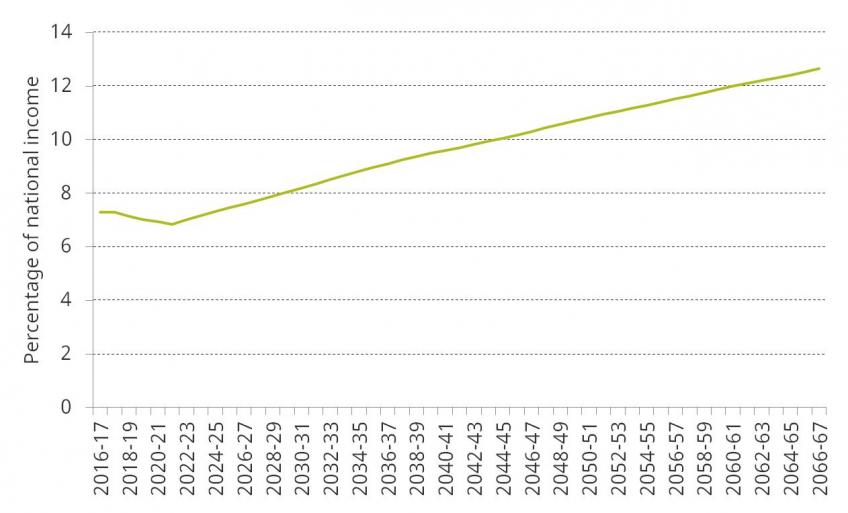
Figure 8 shows the latest projections from the Office for Budget Responsibility (OBR) of spending on health, across the UK, as a proportion of national income between 2016–17 and 2066–67. These projections indicate that current spending plans, if kept to, would mean health spending falling from 7.3% of national income in 2016–17 to 6.9% of national income in 2021–22. The OBR then projects that health spending would rise considerably, reflecting continuing demographic pressures and other cost and demand pressures in health. On the OBR projections, public spending on health reaches 12.6% of national income in 2066–67. This would represent a rise of 5.7% of national income over 45 years – an increase of £115 billion in current terms. Note that while this looks huge, and potentially unrealistic, health spending has risen by more than 4% of national income in the last 50 years, and increases on this scale are consistent with historical and international experience. The OBR also projects that spending on long-term care could also add spending pressures of 2.0% of national income in 2066–67 (up from just 1.0% in 2016–17).
Figure 8. OBR central forecasts of public spending on health, as a percentage of national income, 2016–17 to 2066–67
Demographic pressures add to the cost, with a larger and older population expected in 2066–67. Non-demographic factors, including the failure of productivity in health care to match that in the rest of the economy, and advances in medical technologies increasing costs, are even more important.
Of course, projections of spending over a 50-year period are very sensitive to the assumptions used, and it is therefore difficult to forecast the exact level of spending in future. However, these projections do indicate that future governments will likely be faced with the challenge of funding a huge rise in health care spending. This challenge will exist regardless of decisions about short-term health funding. It will therefore be important for the next government to consider very carefully the size and shape of future health spending, and focus on finding and implementing a long-term solution to funding these plans.
Notes and sources
Figure 1
Source: Nominal health spending data from Office of Health Economics (1955–56 to 1990–91) and HM Treasury, Public Expenditure Statistical Analyses (1991–92 to 2015–16). Real spending refers to 2017–18 prices, using the GDP deflator from the OBR in March 2017.
Figure 2
Source: Nominal health spending data from Office of Health Economics (1955–56 to 1990–91) and HM Treasury, Public Expenditure Statistical Analyses (1991–92 to 2015–16). Real spending refers to 2017–18 prices, using the GDP deflator from the OBR in March 2017. UK population data available on an annual basis (but not financial year) from Office for National Statistics (ONS), ‘UK population estimates 1851 to 2014’ (https://www.ons.gov.uk/peoplepopulationandcommunity/populationandmigration/populationestimates/adhocs/004356ukpopulationestimates1851to2014) and ONS, ‘UK population mid-year estimate’, June 2016 release (https://www.ons.gov.uk/peoplepopulationandcommunity/populationandmigration/populationestimates/timeseries/ukpop/pop).
Figure 3
Source: OECD Health Statistics (database available at http://www.oecd.org/els/health-systems/health-data.htm). Figures for the UK differ from those in Figure 1 as health spending (as reported by the OECD) is measured on an internationally comparable basis.
Figure 4
Source: Spending Review 2015. NHS England figures are not published as part of Public Expenditure Statistical Analyses (PESA) and therefore cannot be updated since the Spending Review (SR). As a result, SR 2015 figures are used to ensure consistency in comparisons between NHS England and DH spending over time. Real-terms changes are calculated using the March 2017 OBR GDP deflator.
Figure 5
Source: Author’s calculations using DH spending from HM Treasury, Public Expenditure Statistical Analyses 2016 (https://www.gov.uk/government/statistics/public-expenditure-statistical-analyses-2016) for all years between 2009–10 and 2019–20, ONS population projections (June 2014), ONS mid-year population estimates (2009 to 2015) and age spending weights from the Office for Budget Responsibility, Fiscal Sustainability Report – January 2017 (http://budgetresponsibility.org.uk/fsr/fiscal-sustainability-report-january-2017/) – see figure 5.8 of the 2017 IFS Green Budget for more details.
Figure 6
Note: The pay cost index is a weighted average of increases in unit staff costs for each of the staff groups within the Hospital and Community Health Services sector. Pay cost inflation tends to be higher than pay settlement inflation because of an element of pay drift within each staff group (i.e. there is a tendency for there to be a gradual shift up the incremental pay scales). The health service cost index measures the price change for 41 sub-indices of goods and services purchased by the NHS Hospital and Community Health Services, weighted according to the proportion of total expenditure that they represent. Pay index figures are not comparable before and after 2011–12 due to a change in methodology in that year.
Source: Department of Health, www.info.doh.gov.uk/doh/finman.../2015.16%20Pay%20&%20Price%20series.xlsx. The GDP deflator is from the OBR in March 2017.
Figure 7
Note and source: See Figure 6. Pay index figures are not comparable before and after 2015–16 due to a change in methodology in that year.
Figure 8
Source: Supplementary table 1.1 of the OBR’s Fiscal Sustainability Report, January 2017.
[1] For more details on this topic, see figure 5.2 and table 5.1 of D. Luchinskaya, P. Simpson and G. Stoye, ‘UK health and social care spending’, in C. Emmerson, P. Johnson and R Joyce (eds), The IFS Green Budget: February 2017, https://www.ifs.org.uk/uploads/publications/budgets/gb2017/gb2017ch5.pdf.
[2] Internationally comparable data on health spending are available from the OECD. These figures use a different definition of ‘health spending’ from those used in the UK public finances. As a result, the figures for public spending on health differ slightly from those used in Figure 1 (public spending is 7.7% of GDP, compared with 7.4% in Figure 1). This definition was changed in 2013, and so figures after this date are not comparable to those prior to 2013.
[3] DH accounted for 99% of health spending in England in 2015–16. The Department for Culture, Media & Sport and the Department of Business, Innovation & Skills accounted for the rest.
[4] Updated DH spending plans are available as part of HM Treasury, Public Expenditure Statistical Analyses 2016. However, there are no updated spending plans for NHS England funding. As a result, we use 2015 Spending Review plans. DH spending was £0.8 billion higher in 2015–16 relative to the 2015 Spending Review plans, and is set to be £0.2 billion higher in 2019–20 than set out at the time of the Spending Review.
[5] This includes an estimate of demand growth due to the Integration Transformation Fund (which may effectively reallocate some NHS funds to activity not previously funded by the NHS) and an estimate of cost pressure from the revaluation of pensions. Without these, non-demographic demand pressures are estimated at around 1.2%. Source: NHS England, ‘The NHS belongs to the people: a call to action – the technical annex’, 2013.
[6] The pay cost index is a weighted average of increases in unit staff costs for each of the HCHS staff groups (doctors, nurses etc.).
IFS Election 2017 analysis is being produced with funding from the Nuffield Foundation as part of its work to ensure public debate in the run-up to the general election is informed by independent and rigorous evidence. For more information, go to http://www.nuffieldfoundation.org.
Authors

George Stoye
I completed a PhD at UCL in 2020. My work examines the drivers of variation in the quantity and quality of healthcare provided to different patients.
More from IFS
Understand this issue


Policy analysis


Academic research


