Downloads
BN197.pdf
PDF | 275.63 KB
This Briefing Note provides key information on the UK labour market in recent years, and summarises the challenges in the labour market facing the next government. It uses up-to-date data to understand how the labour market has performed in recent years and how it might continue to evolve over the course of the next parliament. IFS Election 2017 analysis is being produced with funding from the Nuffield Foundation as part of its work to ensure public debate in the run-up to the General Election is informed by independent and rigorous evidence.
IFS Election 2017 analysis is being produced with funding from the Nuffield Foundation as part of its work to ensure public debate in the run-up to the General Election is informed by independent and rigorous evidence. For more information go to www.nuffieldfoundation.org
Key findings
1. The remarkable growth in employment since 2012 means the current employment rate is at a record high of 75%. However, it has levelled off in recent months and is not forecast to rise further.
2. There is no evidence that recent employment growth has been disproportionately driven by jobs in low-skilled occupations. Measures of ‘under-employment’ (workers who want to work more hours) are still higher than in 2008, but have fallen back since 2012.
3. Although the number of non-UK-born workers has increased faster than the number of UK-born workers since 2008, the employment rate of UK-born individuals is at a record high.
4. After adjusting for inflation, average earnings of employees are still substantially below pre-recession levels, and are currently being squeezed by rising household inflation (linked in large part to falls in sterling). Central forecasts from the Office for Budget Responsibility (OBR) imply average earnings will still be lower than their 2007–08 level in 2021‒22. This is despite an extraordinary increase in the education levels of the workforce: 35% are now graduates compared with 25% in 2008.
5. Men and younger workers have seen larger falls in average earnings than women and older workers since 2008. Low-earning workers, boosted by recent large increases in minimum wage rates, have seen stronger pay growth since 2008 than higher-paid workers.
6. With unemployment having fallen to below 5%, further increases in employment will be harder to achieve. A key future challenge is pay growth: it will continue to disappoint unless poor productivity growth can be redressed. It is hard to overstate how important this is to increasing living standards in the long run.
The remarkable recovery in the employment rate since 2012 has pushed it to a record high, though employment growth has slowed in recent months.
Figure 1. Employment rate (aged 16–64)
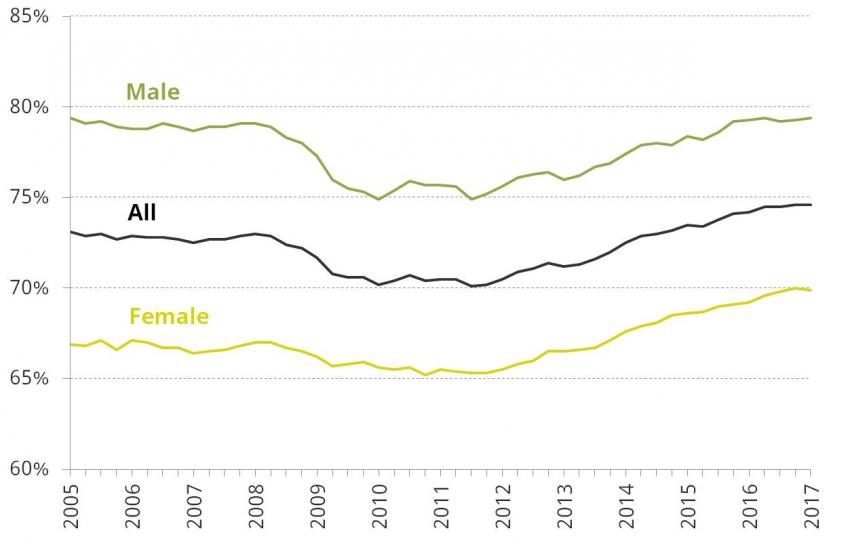
Note: 2017Q1 data point contains data for the three months ending in February 2017.
Source: ONS series LF24, MGSV and LF25.
Employment in the UK since the 2008 recession has consistently performed better than expected. The strong recovery since 2012 has pushed the employment rate above its pre-recession level and it now stands at an all-time high of nearly 75%. Employment growth has been particularly strong among women, with the female employment rate increasing from 67% in 2008 to 70% in 2016. Despite falling further during the recession, male employment has now also slightly exceeded its 2008 level, reaching 79% in early 2017.
Since early 2016, however, the employment rate has barely changed. With unemployment now lower than in 2007, substantial further rises in the employment rate are unlikely unless groups who are currently not actively seeking paid work start to do so. Neither the Office for Budget Responsibility (OBR) nor the Bank of England anticipates further increases in the employment rate in their central forecasts.
Despite rises in self-employment, full-time employee jobs still dominate the UK workforce.
Figure 2. Composition of workforce, by type of work in main job
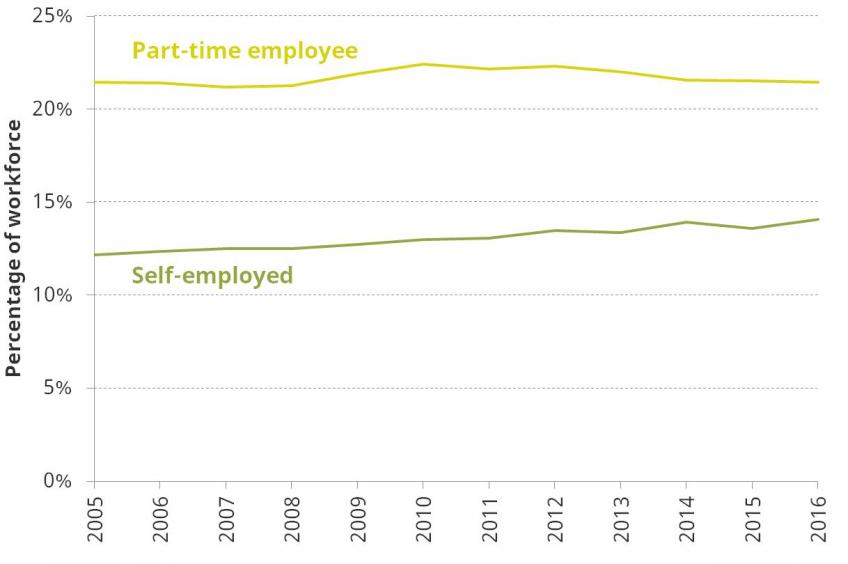
Note: Restricted to the 16–64 workforce.
Source: Authors’ calculations using the Labour Force Survey.
In recent years, there has been considerable interest in the growth of ‘non-standard’ ways of working, particularly in the increase in self-employment. The past decade has witnessed a steady increase in the share of workers who are self-employed, which has risen from 12.2% in 2005 to 14.1% in 2016. This may not sound dramatic but it amounts to 860,000 more self-employed workers in 2016 than in 2005, an increase of 25%.
The share of workers working as part-time employees increased in the aftermath of the recession but has since returned to its pre-crisis level. This overall trend masks a falling prevalence of part-time employment for women and a rising prevalence for men. While these trends have caused a small overall decline in the share of workers in full-time employee jobs, working as a full-time employee continues to be by far the most prevalent, and accounted for 64% of the UK workforce in 2016 compared with 66% in 2008. Overall, changes in employment and hours mean working-age adults are working 4% more hours in 2016 than in 2008.
Measures of ‘under-employment’ have been falling but remain above pre-recession levels.
Figure 3. Indicators of ‘under-employment’
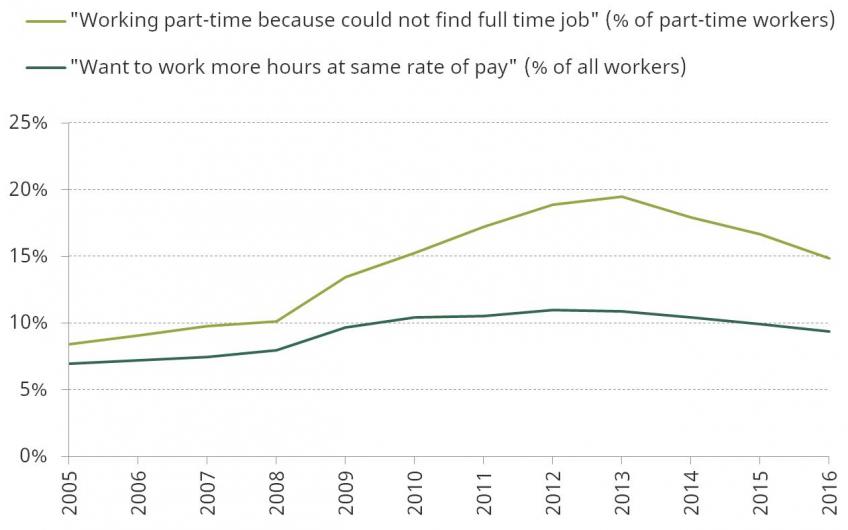
Note: Restricted to the 16–64 workforce.
Source: Authors’ calculations using the Labour Force Survey.
Although employment is at a record high, there is evidence that some workers still want to work more hours than they are currently working. The proportion of part-time workers wanting to work full-time is still higher than in 2008, at 15% of part-time workers compared with 10% in 2008. The fraction of workers who want to work more hours (at the same rate of pay) is also slightly above pre-recession levels. However, both of these measures of underemployment are reduced from their recent peaks in 2012 and 2013, particularly the fraction of part-time workers who could not find a full-time job.
Recent years have not seen a rise in the share of jobs in low-skilled occupations.
Figure 4. Composition of workforce, by skill level of occupation and education
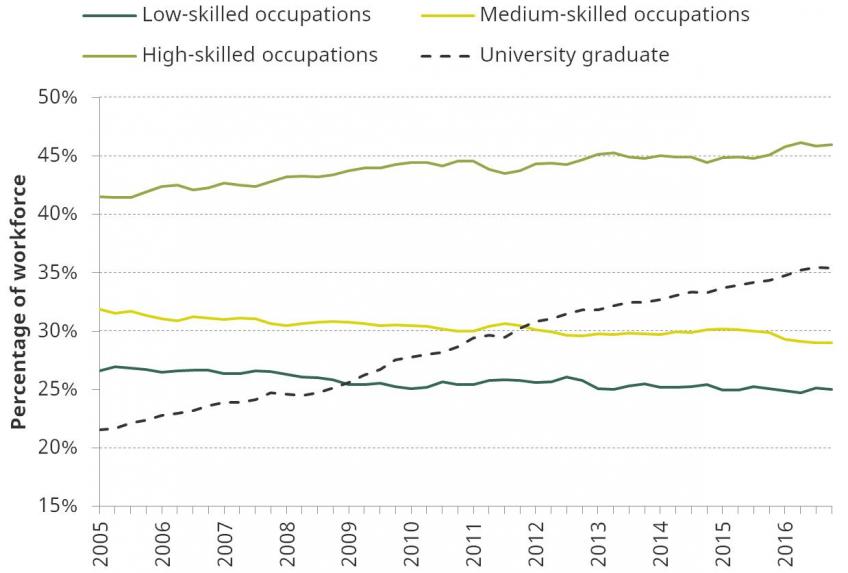
Note: Restricted to the 16–64 workforce. Adjusted for discontinuity caused by the introduction of SOC2010 occupation coding between 2010Q4 and 2011Q1. Skill level of occupation is defined by one-digit Standard Occupational Classification (SOC) 2000 code (SOC 2010 since 2011). ‘High-skilled’ is defined as codes 1– 3, ‘medium-skilled’ is codes 4–6 and ‘low-skilled’ is codes 7–9.
Source: Authors’ calculations using the Labour Force Survey.
Despite some perceptions that recent employment gains have been driven by an expansion of low-skill work, low-skill occupations have not increased any faster than overall employment. As a result, the share of workers in low-skill jobs has remained virtually unchanged during the labour market recovery in recent years. By contrast, the share of workers in high-skill jobs has increased slightly, at a slower rate than during the years preceding the recession.
However, there has been a very large increase in the percentage of workers who are university graduates: 35% of workers now have completed an undergraduate degree, up from 25% in 2008. This share is set to rise further in coming years as younger generations are more educated than older generations. In combination, these trends mean the proportion of graduates working in low-skill jobs has increased, from 5.3% in 2008 to 8.1% in 2016.
Numbers of non-UK-born workers have increased rapidly, but employment rate of UK-born also higher than pre-crisis.
Figure 5. Change in (16+) employment level since 2000, by country of birth
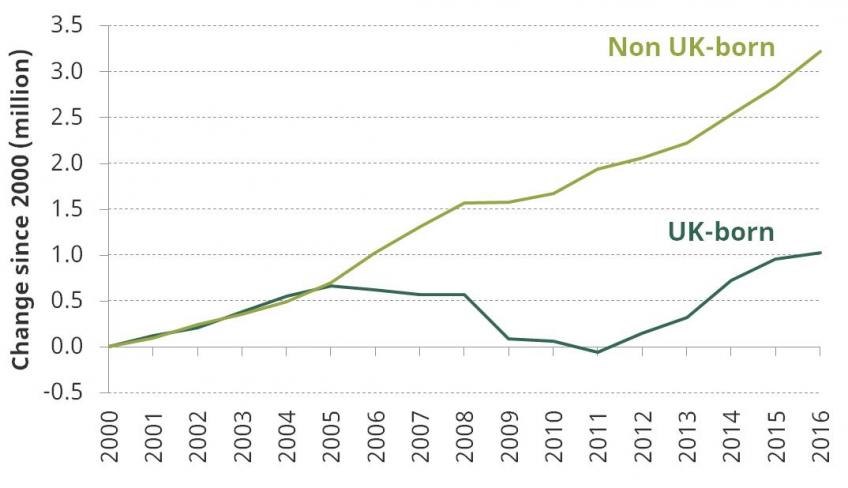
Source: ONS series JF6F and JF6G.
Figure 6. Employment rate (aged 16–64), by country of birth
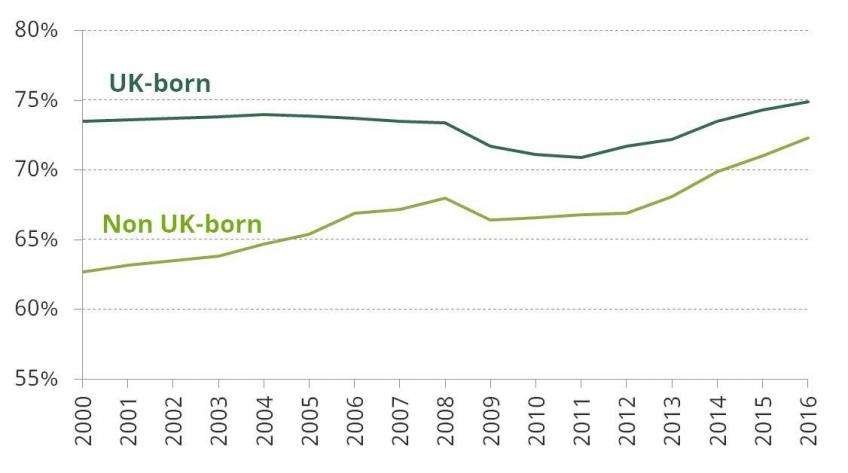
Source: ONS series LFM6 and LFM7.
Increases in the non-UK-born population and their employment rate resulted in the number of non-UK-born workers rising by 1.7 million between 2008 and 2016. This large increase means that workers born outside the UK have accounted for a large share of overall employment growth in recent years. However, the number of UK-born people in work has also increased substantially during the recent labour market recovery, rising by 1.1 million between 2011 and 2016. Moreover, the fraction of UK-born people in work, at 75%, is now higher than at any point since consistent statistics began in 1997.
Average earnings are still substantially below pre-crisis levels; central forecasts see average earnings not reaching 2007–08 levels even in 2021–22.
Figure 7. Real median earnings of employees since 2007–08, and forecasts
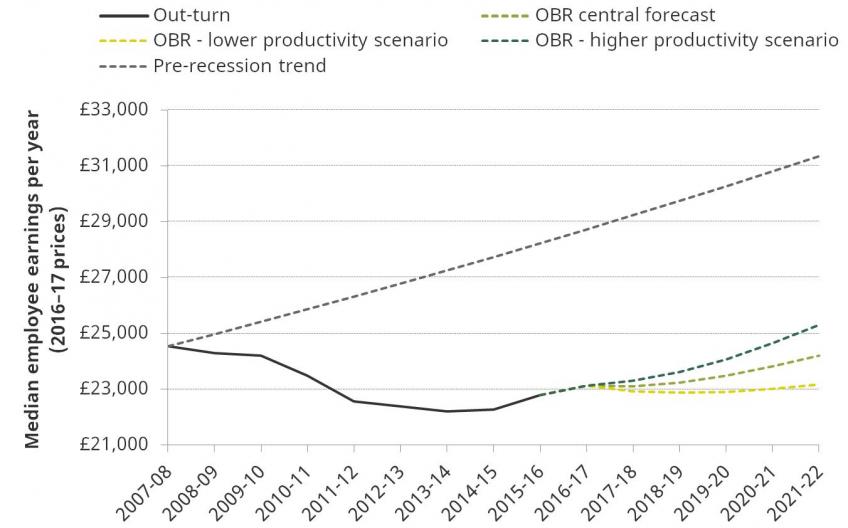
Note: Adjusted for inflation using the Consumer Prices Index. The line ‘Pre-recession trend’ projects what real median earnings growth would have been had the growth in real median earnings in the decade before the recession (1.8% p.a.) continued in each year after 2007–08.
Source: Authors’ calculations using the Annual Survey of Hours and Earnings and the OBR’s Economic and Fiscal Outlook March 2017.
The recession had a particularly severe impact on employees’ pay, with median (middle) employee earnings falling by 9.4% between 2007‒08 and 2013‒14 after adjusting for inflation. Although growth has returned since then, growth rates have consistently been lower than expected, with the result that median earnings in 2015‒16 were still 7.1% (£1,700 per year) lower than in 2007‒08. In comparison, had real earnings continued to grow at the same pace after 2007–08 as in the decade prior to the recession, by 2015–16 median earnings would have been 15% (£3,700 per year) higher than they were in 2007–08.
These statistics are informative because they allow us to understand how the average pay of people in work in 2015–16 compares with the pay of those in work in previous years. However, it is important to stress that this is not the same as the average pay growth of people who have been in work continuously since 2007–08. Many individuals will have personally experienced substantial pay growth over this period.
More recent data from ONS, shown in Figure 8, show growth in real mean weekly earnings slowing substantially since the middle of 2016. This is due to the increase in inflation, which has risen in recent months in large part due to the fall in the value of sterling following the vote to leave the European Union. Real mean pay in early 2017 was only 0.3% above its level a year earlier. With inflation rising, it would not be surprising for official statistics to record falling real earnings in the coming months.
Figure 8. Annual nominal mean earnings growth, inflation and real mean earnings growth since 2015Q1
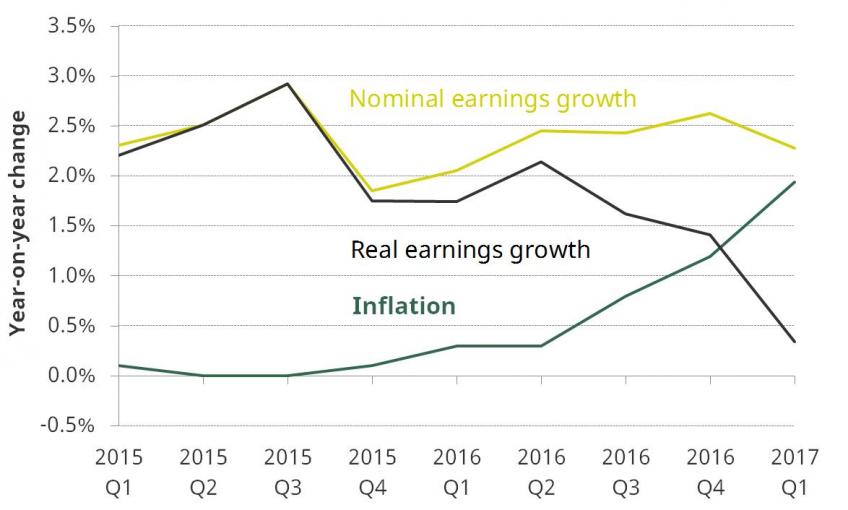
Note: Inflation measured using the Consumer Prices Index. 2017Q1 refers to the three months December 2016 to February 2017. Growth in prices and earnings are calculated compared with the same three months a year earlier.
Source: Authors’ calculations using ONS Average Weekly Earnings series.
Looking further ahead, the OBR’s central estimate is that only modest real pay growth will mean that average earnings will still not have returned to pre-recession levels by 2021‒22 – an astonishing and unprecedentedly long period without a rise in average earnings in the UK. Given current forecasts are subject to particularly high uncertainty, Figure 7 also presents two alternative scenarios, which show the path of average earnings if productivity growth is 1% higher or lower per year than the OBR expects. The low-productivity scenario results in essentially no earnings growth over the next five years. Even under the optimistic high-productivity scenario, it would take until 2020–21 for average earnings to exceed pre-recession levels.
Men have seen greater reductions in pay, due to sharper falls following the recession.
Figure 9. Real median earnings growth of employees since 2008, by sex
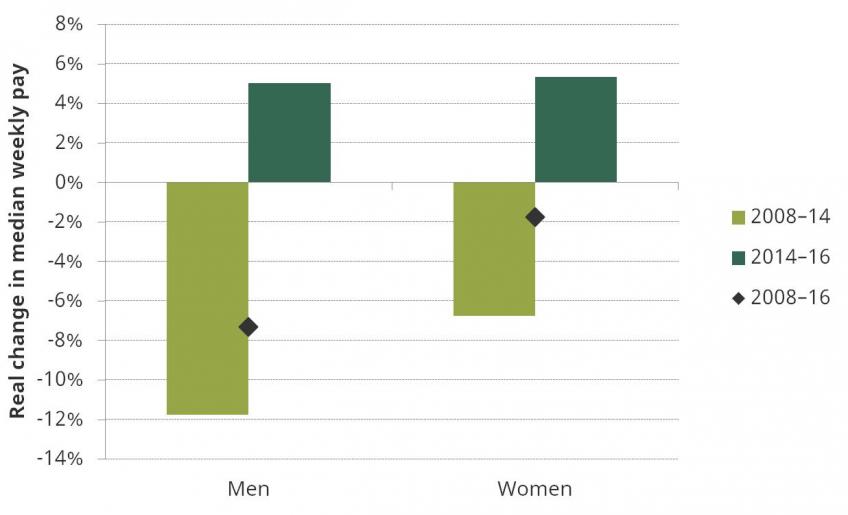
Note: Adjusted for inflation using the Consumer Prices Index.
Source: Authors’ calculations using the Annual Survey of Hours and Earnings.
Figure 9 shows the difference in earnings growth in recent years between men and women. It gives the change in real earnings between 2008 and 2016 and also split between 2008‒14 and 2014–16. Earnings fell in the first period and started to recover in the second.
Average earnings of male employees were 7.3% lower than their 2008 levels in 2016, whereas average earnings of female employees were only 1.8% lower. This largely reflects much bigger falls in male average earnings in the years following the financial crisis.
Younger workers have seen the biggest falls in earnings, although their earnings have bounced back in recent years.
Figure 10. Real median earnings growth of employees since 2008, by age group
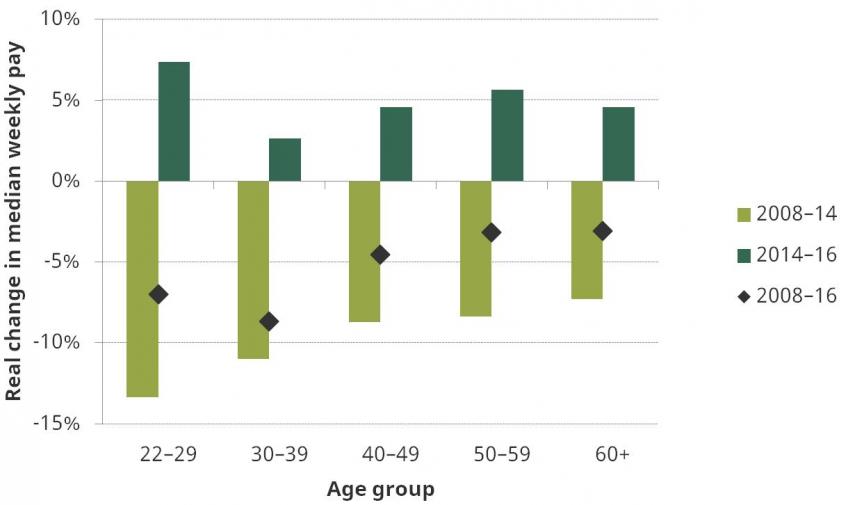
Note: Adjusted for inflation using the Consumer Prices Index.
Source: Authors’ calculations using the Annual Survey of Hours and Earnings.
Distinguishing between younger and older workers shows that those aged below 40 have seen the greatest reductions in their earnings between 2008 and 2016. Workers in their 20s saw the sharpest earnings falls in the aftermath of the recession; younger workers typically fare worse during downturns. Earnings growth for this group, however, has been particularly strong during the recent recovery, to the extent that it is those in their 30s who have seen the largest earnings falls over the entire period.
Strong growth in the earnings of low earners since 2014 has reduced earnings inequality.
Figure 11. Real earnings growth of employees since 2008, by percentile point
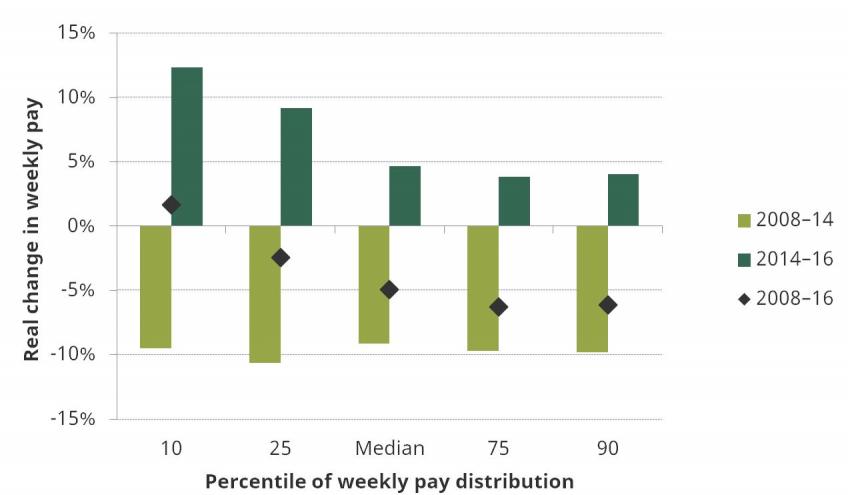
Note: Adjusted for inflation using the Consumer Prices Index.
Source: Authors’ calculations using the Annual Survey of Hours and Earnings.
Although earnings fell relatively uniformly for high, middle and low earners during the aftermath of the recession, earnings growth since 2014 has been strongest for low-paid workers. Between 2014 and 2016, pay at the tenth percentile (i.e. the pay of someone who earns less than 90% of employees) rose by an impressive 12.3% in comparison with growth of only 4.6% at the median. The surge in earnings at the bottom of the distribution is largely driven by increases in minimum wage rates, which we will discuss further in an upcoming election briefing note. The combined result of these trends is that earnings inequality is lower in 2016 than it was in 2008.
Earnings growth will remain weak unless poor productivity growth can be redressed. Further increases in employment will be harder to achieve than in recent years.
It is hard to overstate the importance of boosting productivity if robust pay growth is to return and be sustained. It is the very poor productivity performance of the economy which has led directly to the worst earnings growth we have seen in more than a century. While there are no quick fixes, investment in infrastructure, genuine improvements in education and skills, and a more efficient tax system are all important avenues to pursue.
It will be harder for employment to grow in the next parliament than in recent years. Employment has reached record highs and unemployment has fallen to below 5% for the first time since the mid 2000s. With the unemployment rate near its long-term sustainable level, further growth in the employment rate will have to come from encouraging more people to seek work and participate in the labour force. There may well be scope for this – male employment rates, especially among older men, are still well below historical highs. While past policy reforms have successfully increased the participation of some groups – notably lone parents and women aged 60 and over – additional increases in participation will probably be more challenging.
IFS Election 2017 analysis is being produced with funding from the Nuffield Foundation as part of its work to ensure public debate in the run-up to the general election is informed by independent and rigorous evidence. For more information, go to http://www.nuffieldfoundation.org.
Authors

Robert Joyce
Robert is a Deputy Director. His work focuses on primarily on the labour market, income and wealth inequality, and the design of the welfare system.

Jonathan Cribb
Jonathan is an Associate Director and Head of Retirement, Savings and Ageing sector, focusing on pensions, savings and later-life economic activity.

Agnes Norris Keiller
More from IFS
Understand this issue


Policy analysis


Academic research


