Downloads
Download
PDF | 509.08 KB
Key findings
Police force numbers are driven by changing entry rates, not exit rates
Police officers are not employees, as in other occupations. |
| The absence of a contract of employment implies, among other things, that police officers cannot be made redundant. |
Changes in police officer numbers are largely driven by changes in the entry rate. |
| Police officer numbers rose sharply between 2001 and 2005, and contracted between 2010 and 2013. Exit rates changed little over time. |
Which officers leave, and what do they do next?
The primary exit route for police officers is through ordinary retirement via the police pension schemes. |
| Over the period 2004–05 to 2014–15, 62% of police officer exits from the force were ordinary retirements, while 7% were early retirements on the grounds of ill health. Less than one-third (27%) were voluntary resignations from the police force. |
Most police retire from the labour force on leaving the police service; those who remain in the labour force choose a variety of occupations. |
| Of the third that leave the police (either through retirement or for other reasons) and continue in employment, 15% continue in protective services or elementary security occupations. However, the majority go to occupations not directly related to policing, including administrative and secretarial (25%) and associate professional and technical (19%) occupations. |
Leaving rates differ across police forces and this variation reflects the relative attractiveness of alternative occupations. |
| We show that better outside local labour market opportunities (higher wages and lower unemployment rates) are statistically significantly associated with higher resignation rates across police forces. Those forces geographically close to London also have higher rates of exit through transfers. We find no evidence that variation in crime rates and workload affect exit from the police service. |
Introduction
The labour market in England and Wales for police officers is unusual in two respects. First, unlike virtually all other occupations in the UK, police officers have security of tenure. Police officers are not employees, but officers under the Crown, and there are no provisions for making police officers redundant. Hence, fluctuations in the size of the police officer workforce are largely driven by changes in entry rates rather than exit rates over time. Second, the requirement that an active police officer should be ‘fully deployable’ over a whole range of activities has underpinned a relatively young ‘normal age of retirement’ in police pension schemes relative to most other occupations.
These two characteristics of the police labour market imply that standard analyses of employee retirement in other occupations are less pertinent to police officers. Exit rates are not very sensitive to aggregate fluctuations in public spending or the aggregate business cycle. In addition, many police officers do not retire from the labour force on leaving the police. Nevertheless, local conditions may be an important factor in considering retention and exit strategies of police officers. This briefing note therefore considers retention in the police force: who leaves the police, what they go on to do, and how retention differs across the individual police forces of England and Wales.
To set the scene, Figure 1 illustrates the size of the total police officer workforce across England and Wales between 1989 and 2015. During the 1990s, the number of police
Figure 1. Total police officer strength
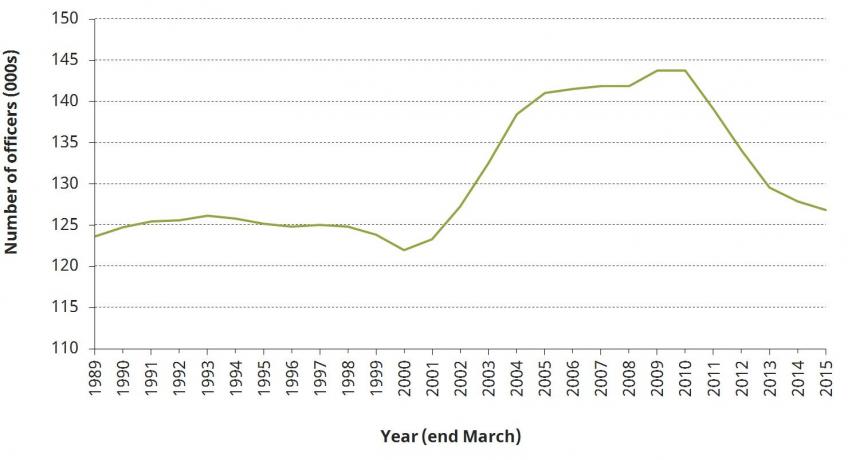
Note: Full-time equivalents as at 31 March. Excludes secondments outside the police service in England and Wales.
Source: Home Office, Police Service Personnel, 1998–2000; Home Office, Police Service Strength, 2000–12; Home Office, Police Workforce, 2013–15.
officers was relatively steady at around 125,000, though on a gradual decline from 1993 onwards. However, from 2001, the number of police officers increased markedly, reaching around 141,000 in 2005. This expansion was an explicit decision by the Labour government, who were re-elected in 2001 on the basis of a manifesto that included a pledge to increase police spending significantly and to thereby increase police numbers to record levels. Between 2005 and 2010, officer numbers were again relatively stable (increasing slightly in 2009). From 2010 onwards, as a consequence of the coalition government’s cuts to public spending in the wake of the financial crisis, the number of police officers has fallen to roughly the level in 2002.
Figure 2 shows that these changes in police officer numbers are largely driven by changes in the rate at which officers join the police force; the leaving rate is relatively stable over this period by comparison. This is unsurprising given, as we have suggested, that police forces have little direct control over leaving rates.
Figure 2. Police officer joining and leaving rates
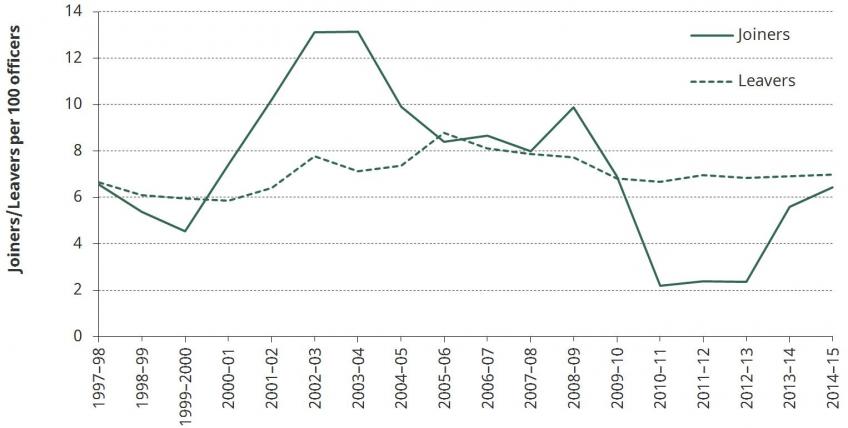
Note: Joining/leaving rates are calculated as the number of police officers joining/leaving the police during a financial year, divided by the total number of police officers (full-time equivalents) at the end of the financial year. Figures include transfers (i.e. officers who transfer between forces will count as both a joiner and a leaver).
Source: Home Office, Police Service Personnel, 1998–2000; Home Office, Police Service Strength, 2000–12; Home Office, Police Workforce, 2013–15.
In this briefing note, we examine police officer retention in more detail. We start in Section 2 by describing the institutional context – the ways by which police officers can leave the force voluntarily or involuntarily and the incentives created by the police pension schemes. In Section 3, we examine how common different types of exit are across England and Wales as a whole, how this has changed over time and what police officers do when they leave the police force. Then in Section 4 we explore differences across individual police forces in exit rates and reasons. Section 5 concludes.
Authors

Richard Disney
Richard is an IFS Research Associate, a Part-time Professor of Economics at the University of Sussex and a Visiting Professor of Economics at UCL.

Rowena Crawford
Polly Simpson
More from IFS
Understand this issue


Policy analysis


Academic research


