
A special issue of Fiscal Studies launched today shows how wealth is concentrated among a small number of households, and is much more concentrated than incomes. Younger generations are on course to have less wealth at each point in life than earlier generations and inheritances do little to even out wealth holdings. It also draws attention to the relative lack of data on wealth holdings, especially among the very wealthiest. Wealth is a key determinant of wellbeing. It matters to households whether they have enough savings to see themselves through retirement and it matters for how they would respond to economic shocks and to fiscal and monetary policy. So understanding the distribution of wealth matters.
In fact, as the papers published in the volume show, we have been learning a lot about the wealth distribution in recent years, especially following the introduction of the Wealth and Assets Survey. But this survey cannot tell us much about the top 1% who hold around 20% of household wealth. So it is concerning that HMRC have consulted on discontinuing their publication of statistics on top shares of wealth (derived from data on bequests). These statistics have for decades given us the only, albeit imperfect, window into the wealth of the very richest.
The rest of this observation highlights what we know about the wealth distribution in the UK.
The wealth distribution in the UK
Figure 1 (taken from ‘Household Wealth in Great Britain: Distribution, Composition and Changes 2006–12' by Crawford, Innes & O’Dea) provides an overview of the distribution of household wealth in Great Britain. The household population is divided into 100 groups– and is ordered from those with the least wealth (those on the left) to those with the most.
The least wealthy one percent of households (the 1st percentile) have negative net wealth (i.e. debts in excess of any gross wealth) of more than £12,000 per adult. Net wealth holdings are also negative for those in each of the next 8 percentiles (that is 9 per cent of households have no positive net wealth). Wealth at the median is £104,000 per adult and at the very top increases dramatically across a small number of percentiles – wealth at the 95th and 99th percentiles is £0.7 million and £1.4 million per adult respectively (and there is reason to believe that the top shares - estimated using survey data -are underestimates).
FIGURE 1
Percentile plot of total household wealth per adult
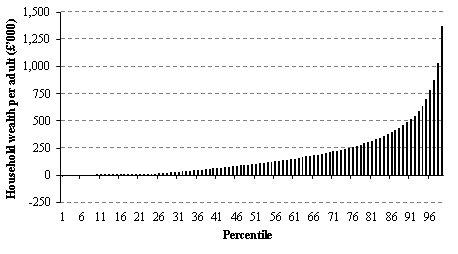
Note: Weighted sample of all households interviewed in WAS Wave 3 (2010–12). Household wealth comprises gross financial wealth, gross housing wealth, private pension wealth less mortgage and non-mortgage debt.
Wealth inequality
- Wealth is far more unequally distributed than is income. The Gini coefficient (a summary measure for how unequal a distribution is) is 0.64 for wealth. This compares to 0.34 for net income (see Table 1 of Crawford et al.).
- The wealthiest 1% of households hold about 20% of household wealth, the top 5% of hold approximately 40%, and the top 10% hold over 50% of wealth (see Table 1 of Alvaredo et al.). These authors also find that household wealth in the UK has become more concentrated since the turn of the century. Unfortunately, the data available do not permit more concrete statements about the extent to which this is the case.
Changes in wealth since 2006
Data covering 2006 to 2012 is now available from the Wealth and Assets Survey. Crawford et al. track changes in wealth over this period and find that:
- Average household wealth increased in real terms between 2006 and 2012. These increases are largely driven by increases in pension wealth; average household wealth held outside pensions fell in real terms between these years, except for the youngest households.
- The rate of increase in real wealth over the period 2006 to 2012 suggests that younger cohorts are on course to have lower real wealth on average at each age than earlier generations.
Inheritances and the wealth distribution
Crawford and Hood, use the English Longitudinal Study of Ageing (a survey that contains a representative sample of individuals in England aged 50 or over), to investigate the effect that the receipt of inheritances has on the distribution of wealth.
- Inheritances are smaller in absolute terms for those lower down the wealth distribution, but they are more important relative to other wealth holdings. Inheritances therefore act to make the distribution of non-pension wealth more equal.
- However, this inequality-reducing impact of inheritances and gifts shrinks (or even disappears) when public and private pensions are included in the measure of household wealth. The impact of transfers on the distribution of this broader measure of wealth gives a better indication of the impact of transfers on lifetime resources.
Conclusion
Measuring the wealth distribution is difficult and there is value in using all available data sources (survey data, data from estates, data from capital income etc.) to obtain the best possible understanding of the wealth distribution. Alvaredo, Atkinson and Morelli conclude (and we agree) that data on wealth in the UK and elsewhere are in need of substantial and continued investment if researchers are to be able to communicate firm conclusions to policymakers about trends in the wealth distribution. We hope that the papers in this Fiscal Studies issue will spur further discussions on these issues and ensure that the UK and other countries have the best possible infrastructure for the collection and analysis of household wealth.
Authors

Thomas F. Crossley
Tom is a Research Fellow at IFS, a Research Professor for the Institute for Social Research at the University of Michigan.

Cormac O'Dea
Cormac is a Research Associate of the IFS, an Assistant Professor of Economics at the Yale University and Research Fellow at the NBER.
More from IFS
Understand this issue


Policy analysis


Academic research


