The government has started to send out information on how tax revenue is spent to individuals who pay income tax or National Insurance contributions. It has broken down spending into a number of categories. The biggest of these is "welfare", which represents a quarter of total spending. State pensions also appear as a separate category, accounting for 12% of spending. In this observation we look at what counts as pension and welfare spending, and offer some alternative breakdowns.
Spending on state pensions is straightforward. This is essentially just the annual spend on the basic state pension and earnings-related state pensions from various different schemes.
"Welfare" spending, at 25% of the total, is taken directly from the government's public expenditure statistical analyses. It is the total spending defined as "social protection" in these analyses, less spending on state pensions. Total spending on social protection comes in at £251 billion in 2013-14, which is about 37% of total public spending of £686 billion (before accounting adjustments). Take off £83 billion of spending on state pensions and you get to £168 billion on "welfare" - very nearly a quarter of total spending.
What is included in that "welfare" total?
It includes £28.5 billion on "personal social services". This is a number that in many analyses one would want to report separately from other welfare spending. It includes spending on a range of things, such as looked-after children and long term care for the elderly, the sick and disabled. Unlike other elements of "social protection" it is not a cash transfer payment and in many ways has more in common with spending on health than spending on social security benefits.
Another £20 billion of the spending counted under welfare is pensions to older people other than state pensions. That includes spending on public service pensions – to retired nurses, soldiers and so on[1]. This is not spending that would normally be classed as "welfare". The rest of the pay package of a public sector worker is included as departmental spending within the department of that worker. One could either report such pension payments separately or, like pay, as part of the relevant spending function. The pay of nurses counts as health spending. One could count their pensions in the same way.
That leaves around £120 billion of other welfare spending, which can be broken down in a number of different ways.
Since the government has chosen to report state pension spending separately, one obvious division would be to separate spending on those of working age and those of pension age. In addition to state pensions a further £28 billion is spent on pensioners, of which £15 billion goes on benefits specifically for that group, such as pension credit, attendance allowance and winter fuel payment, while the remaining £13 billion is largely spent on housing benefit and disability living allowance. So of the £205 billion or so spent on tax credits and social security benefits about £111 billion is spent on those over pension age and £94 billion on those of working age.
Figure 1 and Table 1 show this breakdown of the 25% of total spending described as "welfare" by the government, alongside the 12% spent on state pensions. 4% goes on "personal social services", 3% on public service pensions, 4% on other benefits for pensioners, and the remaining 14% on benefits for those of working age.
Figure 1. Breakdown of "welfare" as a share of total spending
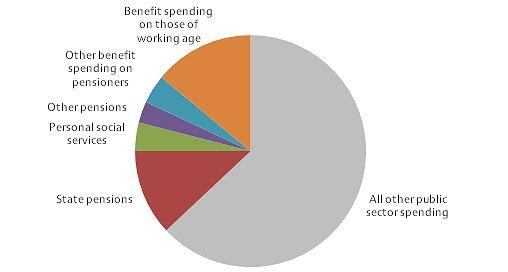
Sources: Public Expenditure Statistical Analyses, Department for Work and Pensions benefit expenditure tables.
Table 1. Breakdown of "welfare" as a share of total spending
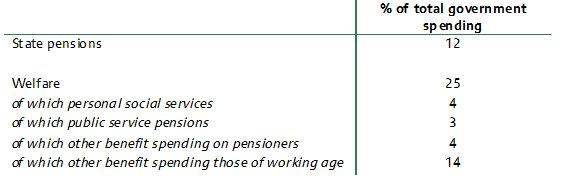
Sources: see Figure 1.
It could of course be argued that this would provide too much detail. But there are five categories reported in the government's breakdown of spending, each representing less than 2% of total spending. If it is worth reporting contributions to the EU budget which represent less than 1% of total spending then there might be a case for providing this additional breakdown of "welfare spending".
There are of course other ways of breaking down spending on social security benefits. The OBR, for example, show spending on the elderly, sick and disabled, families with children, the unemployed and help with housing costs (table 2.1 here) . In our survey of the benefits system we provide a similar split (table 3.1 here), separating out spending according to its function as best we can. There are clearly different judgments one can make here (we include attendance allowance in spending aimed at the sick and disabled, rather than the elderly for example), but it does give a good sense of the overall spending priorities within the system. Table 2 shows this split, including the 12% of total spending going on state pensions, and excluding the 4% spent on personal social services and the 3% reported as going on pensions other than the state pension (both of which the government includes in "welfare").
Table 2. Welfare spending by function
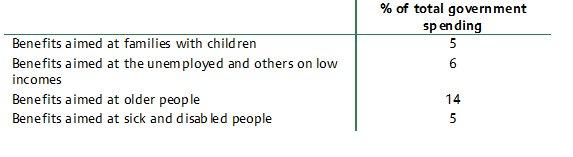
Note: categories correspond to the primary recipient of a given benefit, rather than capturing all of the expenditure on each group.
Source: Department for Work and Pensions benefit expenditure tables.
There are different ways of reporting how our taxes are spent, and there is a balance to be struck between the amount of detail presented and clarity of message. Lumping a quarter of total spending into one bucket labelled "welfare" may not strike the most helpful balance, especially when it includes such diverse items as spending on social care, public service pensions, disability benefits, child benefit and unemployment benefits.
Note: The IFS provides detailed breakdowns of tax revenue here, benefit spending here, and other public service spending here.
[1]It is also not the number reported by the OBR when looking at spending on public service pensions (see table 4.24 here). The OBR reports gross spending of £36 billion and "net" spending – i.e. gross spending less contributions received – of £10.5 billion. But for the purposes of this note we stick with the numbers published in PESA.
Authors

Paul Johnson
Paul has been the Director of the IFS since 2011. He is also currently visiting professor in the Department of Economics at University College London.

Andrew Hood
More from IFS
Understand this issue


Policy analysis


Academic research


