Different house price indices are giving conflicting messages
House price indices are some of the most closely watched economic indicators in the UK and it can feel as if barely a week goes by without a new set of widely-reported statistics. But what do these numbers really mean and why do they sometimes look very different? In a new IFS briefing note we explore some of the reasons for the differences between these indices and some of the methodological difficulties in constructing house price indices in general.
There are now several well-established house price indices that are published on a monthly basis. All the indices show house prices on a general upward trend, but exactly how fast they are increasing is less clear. The various indices can and do differ significantly from month to month, leading to a confusing picture of what is happening. This matters because commentary on whether the UK, and especially London and the South East, is experiencing a ‘boom’ or even ‘bubble’ in house prices, often rests on a particular house price statistic. Two sets of data illustrate this conundrum.
The first graph shows average house prices portrayed by several well-known indices in early 2014, relative to their previous peak in 2007-08. All but one (Halifax) suggest that London house prices, in nominal terms, had exceeded their previous peak. But the differences between the indices are huge. According to an index produced by LSL Property Services / Acadata (LSL Acad), based on Land Registry data, London house prices are now more than 30% above their 2007-08 peak, whilst the Halifax index suggests they have not quite reached that peak. And when it comes to house prices for the UK as a whole three indices suggest prices are still around 5% or more below their previous peak while two show them 5% above.
Note: Land Registry and LSL Acad cover England and Wales only. All figures compare February 2014 to previous index-specific monthly peak, except London figures for Nationwide and Halifax which compare 2014Q1 to previous quarterly peak.
Source: see Figure 4 in IFS Briefing Note 146.
Over longer periods one might expect the various indices to converge on a common trend. But this turns out not to be the case either. In the graph below, we look at the cumulative increase in house prices according to the various indices since 2003. All the indices show a broadly similar pattern. But they disagree on the extent of growth over the decade: the LSL Acad index shows an increase of over 55%, while the Land Registry index suggests an increase of around 35%. This is a large discrepancy.
Source: see Figure 3 in IFS Briefing Note 146
Why house price indices differ
House price indices are based on sales data, which can be misleading
House price indices are based on the prices of properties actually sold in a given period. However, because not all houses are sold in every period, house prices indices are based on a small sample of the total housing stock.
The major challenge with using sales data to measure house prices is that the mix of houses being sold from month to month can vary significantly. In particular, a simple average of sales prices might vary even if house prices stayed the same. For example, suppose sales volumes in London increase relative to the rest of the country, but the price of all houses stay the same. Because houses in London are typically more expensive than elsewhere, the average value of a house sold will increase, even though prices have in fact remained the same.
Most indices adjust sales data
Most house price indices adjust sales data to account for changes in the mix of houses being sold. The most popular method, used by the ONS, Nationwide and Halifax, is to use sales data to put a price on the various characteristics of a house, such as an additional bedroom, a garden, or the location. The values attached to each characteristic are then combined into the price of a synthetic house (e.g. a two-bed, detached house, with garden, in Reading), whose characteristics are representative of the houses being bought and sold. The LSL Acad index follows a broadly similar methodology.
In part, the indices differ because they make different choices about which characteristics matter, and how to measure their value. In addition, the indices differ in terms of how they combine individual characteristics in order to construct an ‘average’ house price. At one extreme, the Halifax index tracks the price of a house that was typical of transactions in 1983, while at the other end, Nationwide and ONS revise their definition of the average house to reflect transactions over the past two or three years, respectively (the ONS index is ‘chain-linked’ in order to provide a consistent series despite these annual revision to what constitutes the ‘average’ house). While the Halifax index has the advantage of consistency (it measures the price of the same property over time), the Nationwide and ONS may be more relevant, because they measure the price of a property which is typical of recent transactions. This may help explain the relatively fast growth in the ONS and Nationwide indices since 2009, as they reflect the shift in sales volumes towards the more expensive London market.
The Land Registry take a different approach
The Land Registry (LR) index is based on another method, known as repeat sales. The LR measures the increase in the price of each property sold in a given month compared to the price of that same property the last time it was sold. The average increase in prices is essentially the average of these individual increases in price. This approach ensures the index only measures genuine increases in price, without requiring the level of detail described in the methods above (assuming the quality of the property has not changed substantially between sales, in which case an increase in ‘price’ might just reflect an increase in quality). However, it is still affected by changes in the mix of sales: for example, a shift in sale volumes towards properties whose price is increasing rapidly will show up as an increase in the overall rate of price growth, even if in fact each property is growing at the same rate as before. More generally, properties which sell more frequently will be over-represented in this index.
Indices also use different data
Different indices are also based on different data. The LSL Acad index is based on Land Registry data which covers every registered property transaction in England and Wales, while the LR index itself uses just those properties which have been sold at least twice since 1995. The ONS, Nationwide and Halifax indices are based on mortgage data, which by definition excludes cash sales, with the ONS drawing on the largest sample, while Nationwide and Halifax use their own sales data which might be influenced by their lending policies. It is not simply the case that the index with the largest sample is ‘best’, because the indices also differ in their methodologies.
What price is right?
Given the underlying differences in both methodology and data, it is not surprising that the various house price indices provide different estimates of house price changes. It is not clear that any single method is “right” or clearly superior to the others. It probably makes sense to look at what is happening to all the indices in thinking about trends in house prices. The tendency of commentators to pick on each new piece of information in isolation as it is reported is not helpful. Ideally we would have a composite index based on all the various methods of construction. But that would be a huge undertaking. And it would raise considerable methodological difficulties of its own.
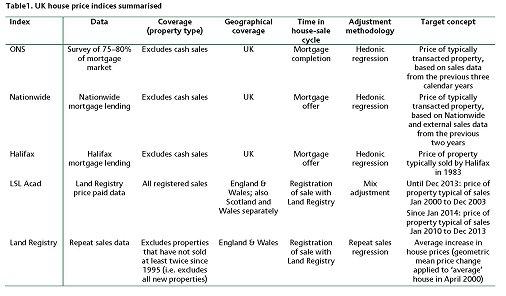
Source: see Table 1 in IFS Briefing Note 146
Authors

Richard Disney
Richard is an IFS Research Associate, a Part-time Professor of Economics at the University of Sussex and a Visiting Professor of Economics at UCL.

Daniel Chandler
More from IFS
Understand this issue


Policy analysis


Academic research


