Following the financial crisis in 2008, the UK – like many other advanced economies around the world – has been undertaking a significant fiscal consolidation. The current government plan is for eight successive years of tax increases and spending cuts intended to offset the permanent rise in public borrowing that became apparent after 2008. The UK’s fiscal consolidation started at the beginning of this parliament (in 2010–11) and is expected to continue until 2017–18, which will be well into the next parliament.
According to recent analysis from the International Monetary Fund (IMF), in 2010, the UK is estimated to have had the fourth highest level of structural government borrowing among the 29 advanced economies for which comparable data are available. However, at least according to plans published so far, the UK is intending the fourth largest fiscal consolidation among this same group of countries and so by 2017 the IMF forecasts that the UK will have a lower level of structural borrowing than many other advanced economies – being below the average in the Euro area and below the average among the G7 and G20 countries.
The UK’s fiscal consolidation began in 2010–11, when the Labour government’s fiscal stimulus package was withdrawn and the incoming coalition government implemented some immediate spending cuts and some in-year increases in indirect taxes (including increasing the main rate of VAT from 17.5% to 20% from January 2011). Additional austerity measures are due to be implemented each year through to 2017–18. Taken together, the measures announced since the March 2008 Budget are expected to reduce public borrowing by 9.1% of national income (or £143 billion in today’s terms) by 2017–18, as shown in the Figure. This is larger than the 6.5% of national income (£101 billion) fiscal tightening originally planned by the coalition government in 2010. Since then permanent downgrades to the outlook for the UK economy and public finances have led the government to pencil in further austerity measures, but these are not scheduled to be implemented until after the next general election. (Box 5.1 in the 2013 IFS Green Budget provides more detail on how these figures are calculated.)
The current financial year is forecast to see a somewhat smaller fiscal tightening from discretionary policy changes (1.2% of national income) than seen in recent years (1.5% in 2012–13 and 1.8% in 2011–12). While discretionary spending cuts and tax increases were implemented in 2012–13, the level of cash borrowing last year was almost exactly the same as in the previous year. This is due to underlying upward pressure on the cash level of public spending, and weak economic performance leading to tax revenues growing only marginally; thus cash borrowing fell very little between 2011–12 and 2012–13. A similar story is forecast for this year: a combination of a weak outlook for economic performance, underlying upwards pressures on spending and further austerity measures being implemented means that cash borrowing is forecast to be largely unchanged once again.
By the end of this year, the government plans to have implemented just over half (52%) of the total planned consolidation. However, within this, the tax rises and investment spending cuts have been relatively front-loaded, while the benefit cuts and the cuts to day-to-day spending on public services have been relatively back-loaded. By the end of this financial year, virtually all of the planned tax increases (95%) and cuts to investment spending (90%) are planned to have been implemented, while only 58% of the total cuts to benefit spending and under one-third (31%) of the overall cuts to other current (i.e. non-investment) spending will have been achieved. The allocation of some of the remaining cuts to non-investment spending will be announced in the Spending Round on 26 June, which will allocate departmental budgets for the 2015–16 financial year.
It is worth noting, however, that the composition of the additional austerity measures planned for 2015–16 and beyond could change. First, it is possible that the Spending Round this summer could announce further cuts to, for example, spending on benefits or tax credits from 2015–16, which would ease the required squeeze on other current spending: for example, if the government wanted to continue cutting departmental spending in 2015–16 at only the same rate as is now planned on average over the four years from 2011–12 to 2014–15, they would need to announce a further £1 billion of cuts to other areas of non-investment spending. Second, history suggests that net tax rises are often announced in the 12 months following a general election (see Figure 5.13 of the 2013 IFS Green Budget); any new tax increases could be used to reduce the spending cuts required after 2015, something which the Budget document (paragraph 1.59) makes clear is a possibility
Figure: Timing and composition of the fiscal consolidation
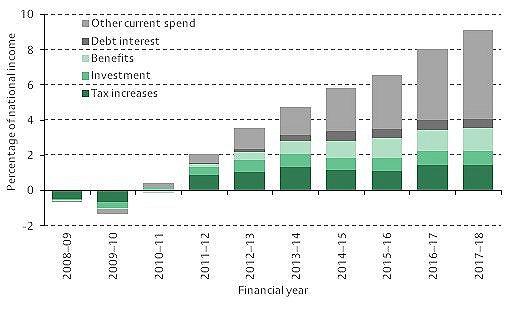
Note: This figure updates the numbers presented in Figure 5.8 of the 2013 Green Budget to include the policy announcements made in Budget 2013 and some minor changes to our methodology. The Green Budget contains details of the methodology and sources used to construct this figure.
The data underlying this figure can be found here
Authors

Gemma Tetlow
More from IFS
Understand this issue


Policy analysis


Academic research


