It is widely known that income inequality has risen substantially over the past thirty years. During the 1980's, in particular, inequality rose dramatically - to levels from which it has never subsequently fallen. But what lies behind this increase in income inequality? In recent work, commissioned by the National Equality Panel, IFS researchers attempt to answer this question by 'decomposing' changes in inequality into the effects of various different forces.
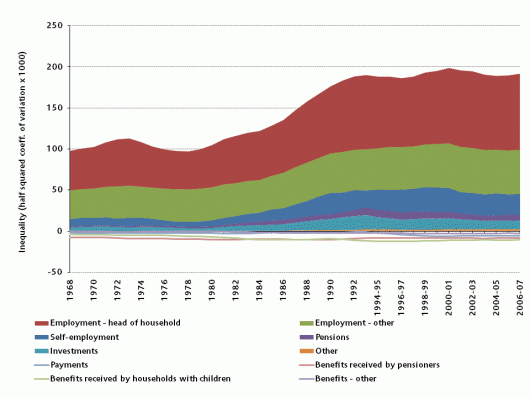
For example, households' incomes derive from many different sources - earnings from employment, state benefits, pensions, investment income, and so on. By breaking income up into these constituent parts, we can investigate which income sources contributed most to changes in inequality. As the chart below shows, it appears that earnings from employment were the main culprit in driving up inequality, but that most sources of income - including investment income and income from self-employment - became more unequally distributed throughout the 1980's.
Income inequality by income source, 1968 to 2006-07
Our full report decomposes inequality according to many other factors (age, sex, region, occupation, etc.), in an effort to assess which contributed most strongly to changes in income inequality. Several factors which one might expect to be important drivers of inequality - Britain's ageing population, for example, or the inequality between the North and the South - turn out to explain very little of the changes in inequality over the past forty years. More surprisingly still, the earnings gap between men and women has actually acted to reduce inequality, as the relative earnings of women have 'caught up' with those of men.
The most important drivers of increased inequality appear to be occupation - with a widening earnings gap between unskilled workers and professional/managerial workers - and education, with increasing relative wages among better-educated members of the workforce throughout the 1980's. This finding is consistent with the idea that 'skills-biased technological change' was responsible for much of the increase in inequality - with new technologies complementing the work of skilled and educated workers, but substituting for the work of lower-skilled workers.
However, our analysis also provides grounds for humility - there is still much about inequality changes over the past four decades which remains unexplained. Individuals' observable characteristics (at least the ones we have in our data) account for only a fraction of total inequality - rarely as much as half. Indeed, the unexplained ('residual') portion of inequality increases over time, suggesting that incomes have become more dispersed even within tightly defined groups.
On the same day that our report was published, the Office for National Statistics announced the results of their Wealth and Assets Survey (WAS) - providing a snapshot of the wealth distribution in the UK between 2006 and 2008, and revealing stark disparities. The top 10% of wealth-holders have more than 44% of all wealth (compare this with the top 10% of income earners, who receive 'only' 29% of all income). Where the Gini coefficient for income inequality is currently around 0.36 (a higher Gini coefficient means more inequality), the Gini for net financial wealth is as high as 0.81. And education again appears important: households headed by an individual with a degree are nearly four times wealthier than households headed by an individual with no qualifications, on average. As striking as inequalities in income are, the WAS shows that inequalities in wealth are far greater.


