Downloads
R160-How-do-other-countries-raise-more-in-tax-than-the-UK-1.pdf
PDF | 423.84 KB
The UK raised 35% of national income in tax in 2018–19. Figure 1 shows that tax as a share of national income has fluctuated between around 30% and 35% of national income since the end of the second world war and been rising since the early 1990s. Tax revenues are now, just, higher as a share of national income than at any point since the late 1960s.
An ageing society is increasing pressure on health, social care and pension systems such that maintaining the same quality and scope of public services in the future will likely require higher taxes as a share of national income.[1] Tax increases have been on the public policy agenda. For example, in the 2017 general election, the Labour party proposed a package of tax measures that it expected to raise £50 billion (2% of national income) a year.[2] This would have taken tax revenues to 37% of national income.
Figure 1: UK national accounts taxes, 1948 to 2023–24
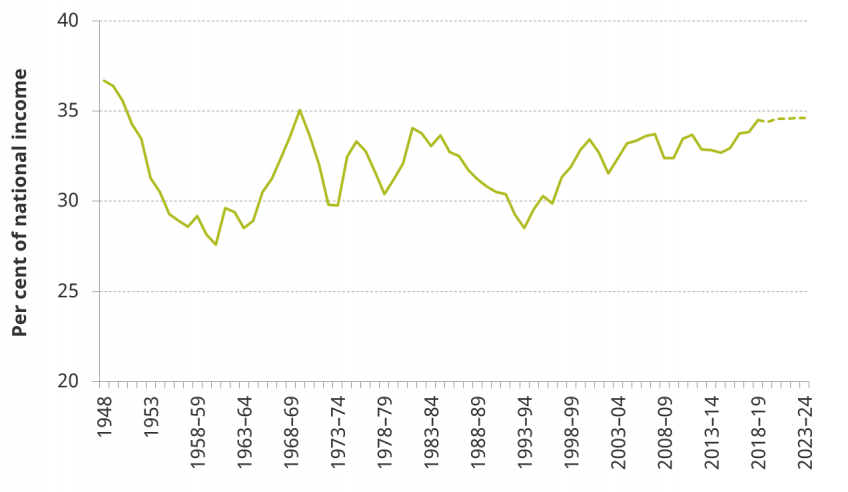
Note: Data are calendar year up to 1953 and financial year thereafter. Dotted line from 2019–20 onwards is the Office for Budget Responsibility forecast accompanying the Spring Statement in March 2019. Public sector current receipts (not shown) is national accounts taxes plus other revenues, including the gross operating surplus of public sector corporations and interest on government assets.
Source: Office for Budget Responsibility, Public Finances Databank, https://obr.uk/data/.
Figure 1 shows that the UK has not previously raised more than 35% of national income in tax on a sustained basis. This highlights that significant tax increases (such as those set out in the Labour party’s manifesto) would take the UK into unprecedented territory, and suggests that raising additional revenues sufficient to meet future public service demands may be challenging. However, many other advanced economies already raise substantially more than the UK. Figure 2 shows that UK revenue as a share of national income is in the middle of the pack when compared with other advanced economies (and would remain middle of the pack if tax were 2% of national income higher). It is slightly below the OECD average, significantly below many EU15 countries and even further below the average among Scandinavian countries.
Figure 2: Tax revenues as a share of national income, OECD countries, 2016
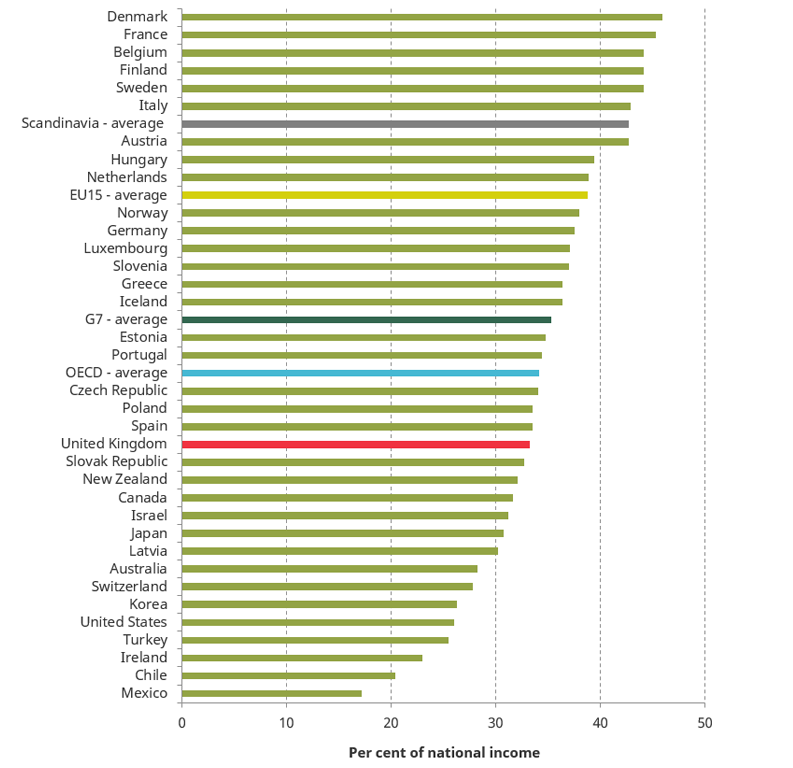
Note: Scandinavia includes Denmark, Sweden and Norway. For Australia, Greece and Japan, data are shown for 2015 as 2016 values were unavailable at the time of download. Precise definition of tax revenue here differs from that in Figure 1 – for example, because items such as environmental levies are classified as taxes for national accounts purposes but are not included as tax revenues on the OECD definition. However, the revenue streams included in Figure 1 and this figure are mostly the same.
Source: OECD, Global Revenue Statistics Database, http://www.oecd.org/tax/tax-policy/global-revenue-statistics-database.htm, extracted 2 August 2018.
This report provides context to the debate about the size of the UK tax take by setting out how different countries raise tax (Section 2). We show that the UK stands out mainly in raising less from income tax and social security contributions (SSCs). We then explore who would pay more tax on their earnings if the UK were to adopt other European countries’ tax systems (Section 3).
International examples do not set a prescription for UK tax policy. There are many reasons why countries raise different amounts of tax and from different individuals, including, among others, different economic structures, the chosen scope and quality of public services, and the desire for redistribution.
Key findings
The UK’s current tax take is high by historical UK standards, but below average among OECD countries. The UK government raises around 35% of national income in tax revenue, a share that has been edging up in recent decades and is now at its highest point since the late 1960s. The average among OECD countries is higher and many countries in Europe raise substantially more as a share of national income.
All OECD economies raise the majority of their tax revenues from three broad-based taxes on income, earnings and consumption. Income tax, social security contributions (SSCs) and value added tax (VAT) / general sales tax (GST) account for over 50% of revenues in all advanced economies, and significantly more than that in most.
The UK raises a below-average share of national income from income tax and SSCs. It raises much less than many European countries from SSCs (National Insurance contributions) and from employer contributions in particular. The UK’s lower revenues from these taxes more than explain the UK’s below-average tax take – the UK raises more than average from taxes excluding income tax and SSCs.
Individuals at both the median and top of the UK income distribution pay less income tax and SSCs than they would if the UK adopted the tax system of a higher-tax country. In most cases, average tax rates would be higher for both median and high-income earners if the UK implemented the income tax and SSC system from one of the EU15 countries that raise more tax than the UK. The UK is more of an outlier at the median, especially for SSCs, than it is for top earners.
The UK has one of the more progressive income tax and SSC systems in the EU15 in the sense that average rates are high at the top relative to the median. Average tax rates rise more quickly with income in the UK, and are higher at the top relative to the median, than in most of the European countries that raise more revenue overall.
References:
[1] See A. Charlesworth and P. Johnson (eds), Securing the Future: Funding Health and Social Care to the 2030s, IFS Report R143, 2018, https://www.ifs.org.uk/publications/12994.
[2] Labour Party, Funding Britain’s Future, 2017, http://labour.org.uk/wp-content/uploads/2017/10/Funding-Britains-Future.pdf.
Authors

Helen Miller
Helen is Deputy Director of the IFS and Head of the Tax sector.

Thomas Pope
Maddalena Conte
More from IFS
Understand this issue


Policy analysis


Academic research


