Summary
The deadline is fast approaching for organisations with at least 250 employees to publish their gender pay gaps for a second year. The reporting requirements have brought greater scrutiny to the gender pay gap, but they miss a potentially important part of the problem: the tendency of men and women to work for different types of organisations.
In this observation, we show that women tend to work for less productive (and lower-paying) firms than men. The gap in firm productivity opens up markedly around the time women have children, when many switch to part-time work or start working closer to home, thereby reducing their job options. This is also when the gender wage gap opens up rapidly.
Tomorrow is the final deadline for private sector firms with 250 or more employees to report their gender pay gaps. Under the reporting requirements, which came into force last year, organisations are legally obliged to publish the percentage gap between average (mean and median) hourly wages for men and women. Additional information must be provided on bonuses and the distribution of men and women within the organisation’s pay structure.
Across the UK economy, women are on average paid nearly 20 percent less per hour than men. This gap is the fourth largest in Europe and it has changed little in the last decade.
The reporting requirements have brought greater scrutiny to this important issue. But by focusing on pay differences within firms, they miss a potentially important driver of the gender pay gap: the tendency of women to work in less productive, lower-paying firms. Even if no organisation had any gender pay gap, an over-representation of men in higher-paying firms would still lead to a gender pay gap in the UK as a whole.
We look at a common proxy for firm productivity, ‘gross value added per worker’, that is used by the ONS, OECD and other statistics authorities (see endnote). Broadly speaking, it measures the amount of revenue that the firm generates (per worker) that is left over for either profit or workers’ pay – that is, excluding the cost of raw materials and other intermediate goods. These data are only available for private sector firms, and it is worth noting that the gender wage gap in the private sector in 2010-2014 (the latest years in which figures are available) was 26 percent, higher than the overall gap of 20 percent in those years.
Figure 1 shows that compared to men, women are more likely to work in firms at the bottom end of the productivity distribution, and less likely to work for the most productive firms. This is partly because women are overrepresented in the retail and hospitality sectors, which tend to have low productivity.
Average gross value added per worker among the firms that women work for is 22 percent lower than among the firms that men work for. Women are about a third less likely to work for one of the top fifth most productive firms (21 percent versus 33 percent). Because more productive firms pay their workers more on average, the gender pay gap in firm productivity is likely to contribute to the overall gender pay gap.
Figure 1. Distribution of men and women by firm productivity, 2010-2014
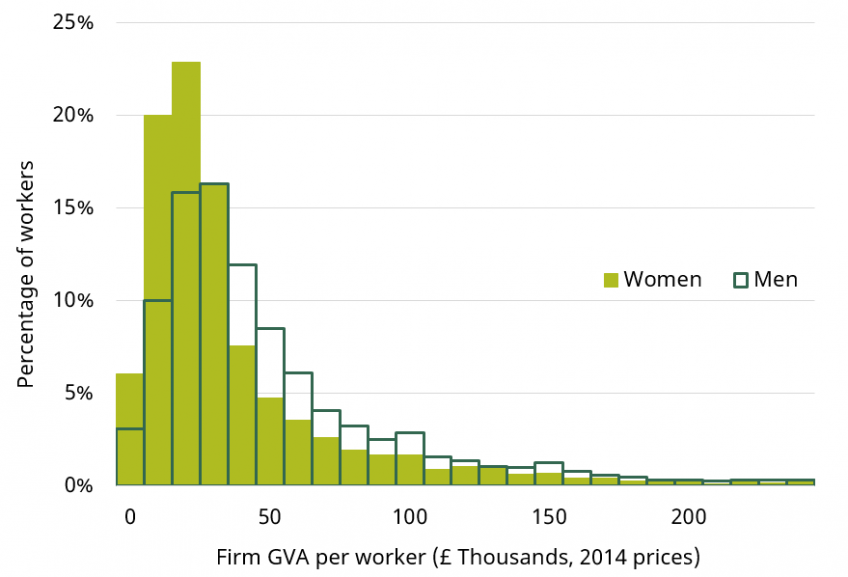
Source: Annual Survey of Hours and Earnings linked to Annual Respondents Database, 2010-2014.
Note: Includes workers aged 18-64 in non-financial private sector firms. 2.9% of women and 4.1% of men are in firms above £240,000; 1.8% of women and 2.0% of men are in firms with negative GVA per worker.
The gender gap in firm productivity begins to widen for people in their mid-30s. Women aged 18-34 are around 5 percentage points less likely to work for the top fifth most productive firms than men of the same age. This difference grows rapidly over the next decade, before levelling off at around 15-20 percentage points for those aged 44 and over. This partly reflects differences in sector – older women are more likely (and older men less likely) to work in retail – but even within sectors the productivity of firms women and men work in starts to diverge in the mid-30s. The same pattern holds if we use other proxies for firm productivity, such as the share of workers employed in R&D activities or average R&D spend per worker.
Figure 2. Percentage of men and women working in the top 20% most productive firms (by GVA per worker)
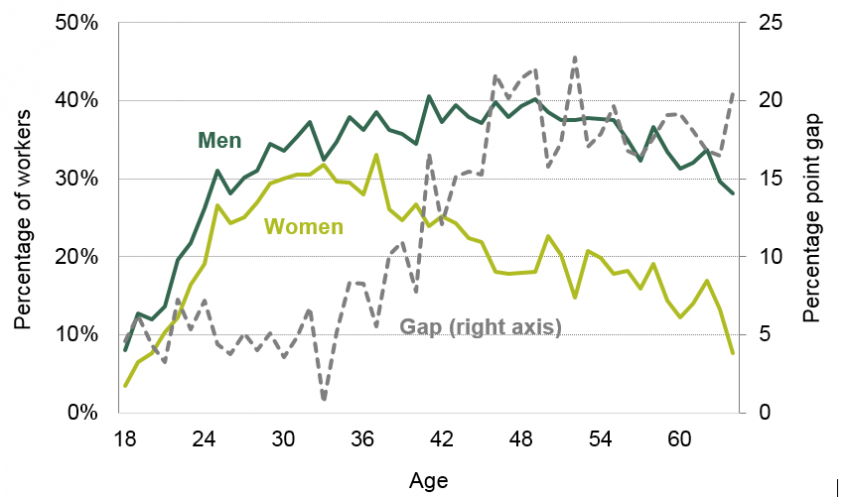
Source: Annual Survey of Hours and Earnings linked to Annual Respondents Database, 2010-2014.
Note: Includes workers aged 18-64 in non-financial private sector firms.
The data do not follow the same individuals over their lifetimes, as other data sources have allowed us to do when looking at the gender pay gap. It is possible that some of the differences by age reflect differences between generations: older people in the sample entered the workforce in earlier decades, when gender differences in the labour market were more pronounced. However, the widening of the firm gap around childbearing age is striking and mirrors the evolution of the gender pay gap.
Previous IFS research has shown that the average hourly wage gap between men and women starts to widen after the birth of the first child. Before having children, women are paid 7-13 percent less than men per hour; this gradually increases to 30 percent in the 13 years after childbirth before flattening out again. Gender commuting patterns evolve in a similar way. After childbirth, average commuting times among women start to fall (which implies that women start to work closer to home), and this fall continues for around a decade after.
The evolution of gender gaps in pay, commuting and firm productivity over the life course may well be related. Previous IFS research has shown that part of the gender pay gap is explained by mothers moving to part-time work, which offers few prospects for wage progression. Childcare requirements may constrain mothers to work closer to home, which means that they have less access to productive, high-paying firms than fathers casting a wider net. And the need for part-time or flexible work arrangements may further restrict the set of firms mothers can choose from, limiting their pay and opportunities for pay progression.
Research from other countries, including Portugal, France and Germany, has suggested that differences between men and women in the firms they work for may explain a larger part of the gender pay gap in those countries than differences in wages within firms. Current IFS research is examining these possible drivers in the UK in greater depth. We hope to shed more light on the causes of the gender pay gap and the potential for policies to reduce it.
Note
This observation uses the following datasets:
Annual Survey of Hours and Earnings, 1997-2018: Secure Access. DOI: 10.5255/UKDA-SN-6689-12
Annual Respondents Database X: 1998-2014: Secure Access. DOI: 10.5255/UKDA-SN-7989-4
Data on gross value added (GVA) per worker are available for nearly all firms in 2010-2014 with 250 or more employees, excluding firms in the finance industry, and a random sample of smaller firms. We reweight the sample so that the share of workers in large and small firms matches the distribution in the economy. GVA is deflated using ONS industry-level deflators.
GVA is defined as the total revenue the firm generates less the cost of intermediate goods and services used to produce its output. GVA per worker or hours worked is a common proxy for labour productivity at the firm level that is used by many statistics authorities, for example the ONS and OECD. However, because the price of goods that a firm produces may reflect the firm’s market power as well as the value of its goods to consumers, GVA per worker may conflate market power with ‘true’ productivity. A detailed discussion of the issues with using GVA per worker as a measure of productivity can be found here. Our findings in this observation are robust to other proxies for firm productivity, for example average R&D spend per worker and the share of workers employed in R&D activities.
Authors

Robert Joyce
Robert is a Deputy Director. His work focuses on primarily on the labour market, income and wealth inequality, and the design of the welfare system.

Xiaowei Xu
Xiaowei joined the IFS in 2018 and works in the Income, Work and Welfare sector.
More from IFS
Understand this issue


Policy analysis


Academic research


