The most widely claimed form of means-tested support in Britain is council tax support (CTS), which helps low-income households with their council tax. In 2013, responsibility for designing CTS for working-age households in England was devolved to local authorities (LAs), and central government funding for it was cut. Almost six years on, now is an appropriate time to look back and evaluate the experience of localised CTS. Research that we’ve undertaken into the design and effects of local schemes reveals three key insights. First, cuts to working-age CTS have become much bigger since 2013. Second, otherwise-similar households can be treated very differently depending on the type of LA they live in. And third, LAs have struggled to collect the extra council tax liabilities that these cuts have created.
Big cuts since 2013
It is not a surprise that LAs have chosen to reduce the generosity of CTS relative to the national system of council tax benefit (CTB) that preceded it. When central government gave LAs responsibility for CTS in 2013, the funding it provided for it was only 90% of what maintaining the generosity of CTB would have cost them – despite requiring LAs to maintain support for pensioners at its previous level. In principle, councils were free to top up this funding from other sources in order to protect households’ entitlements, as the Scottish and Welsh governments did – and some local authorities took this route. But given already tight budgets, it is hardly surprising that four-fifths of English councils cut back support. Working-age entitlements in England were 14% lower in 2013–14 than they would have been under CTB.
By 2018–19, however, entitlements were fully 24% lower than if the generosity of the pre-2013 system had been maintained. Partly, the additional cuts reflects the fact that many councils have mirrored cuts made by central government to the nationwide benefit system – most notably the freeze to most working-age benefit rates that has been in place since April 2015. We might have expected these cuts to be reflected in CTB even if had it not been localised. But by 2018–19 90% of the 326 English LAs responsible for CTS had made changes beyond mirroring national benefit reforms, almost all of them cuts.
A 24% cut is big: it equates to an average loss of £196 this year for the 3.6 million households who would have been entitled to CTB had its generosity been maintained. Of course, these cuts have fallen almost entirely on low-income households, as they are the ones who were entitled to CTB in the first place.
Significantly, for many households a cut in support means that they have a council tax bill to pay when, under the old system, they wouldn’t have had to pay anything. CTB was designed so that the lowest-income households would have their council tax bill covered in full. But the main way in which LAs have cut support is by introducing minimum council tax payments, which requires that all households (apart from any ‘vulnerable groups’ that the LA decides to protect) pay at least a fraction of their council tax bill. This means that many of the poorest households are now local taxpayers. That hadn’t been true in Britain since council tax replaced the poll tax in 1993.
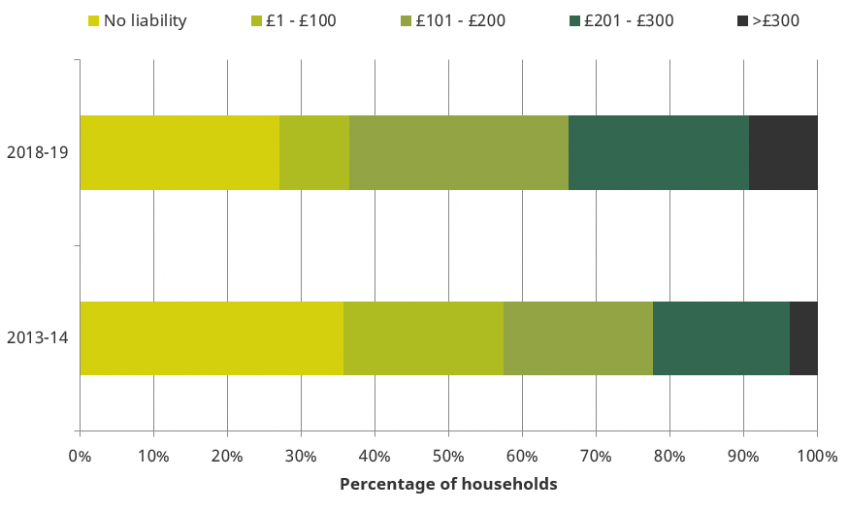
Had the generosity of CTB been maintained, 1.9 million working-age English households would have had no bill to pay this year. Instead, almost three quarters of them have to pay some council tax, and one in three must pay more than £200. Figure 1 shows that these proportions have risen markedly since 2013–14, the first year of localisation.
CTS cuts are thus significant, not just because they represent a big cut to entitlements on average, but also because they have generated council tax liabilities for 1.4 million more households who would not previously have had to pay it, and from whom it now needs to be collected.
Figure 1: Net council tax liability among working-age households in England who would have no bill to pay under the pre-2013 system
Where you live matters
While CTS cuts have been big on average, and generated many new council tax bills, they haven’t affected households in different parts of the country equally. There are still half a million working-age households in England that don’t have to pay any council tax, whereas if they lived in another part of the country they could be paying over £300 a year. This is because some LAs have made bigger cuts than others.
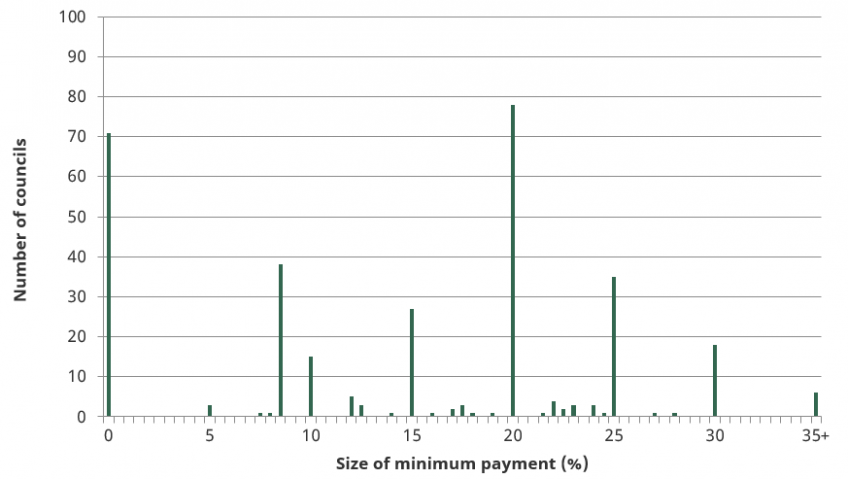
This can be shown most clearly by looking at the minimum payment levels chosen by different LAs (Figure 2). A fifth of LAs still have no minimum payment, while another fifth have a minimum payment of more than 20% (requiring that all households pay more than 20% of their gross council tax bill). The highest minimum payment is found in North Lincolnshire, which requires all working-age residents (except those with a disability) to pay at least 50% of their gross council tax bill.
Figure 2: Minimum payment levels in 2018–19
These minimum payment levels are not random. LAs that saw bigger cuts in central government funding for CTS in 2013 – typically more deprived areas – were more likely to reduce households’ entitlements. Thus households among the lowest-income fifth in England had a 60% chance of seeing their entitlement reduced if they also lived in one of the most deprived fifth of LAs, but only a 46% chance if they lived in one of the least deprived fifth of LAs – though since council tax tends to be higher in more affluent areas, poor households in affluent areas who have seen a cut to CTS have tended to receive a larger additional council tax bill (losing £323 a year on average) than those in poorer areas (£229).
After 2013, funding for CTS was rolled into central government’s broader grant to LAs. But interestingly, the extent of subsequent cuts to that overall funding from central government had no effect on the size of CTS cuts in different LAs. This is despite the fact that overall cuts to funding were much bigger than those in 2013 specifically associated with CTS, and LAs were free to allocate funds however they chose. This suggests that councils’ decisions are influenced by how funding streams are labelled – they’re more likely to cut CTS if the cut to funding is explicitly associated with this policy.
A further oddity in councils’ scheme choices is displayed in Figure 2. On the whole, LAs choose minimum payments that are multiples of 5% (for example, there are ‘spikes’ at 15%, 20%, 25% and 30%). However, 38 councils have a minimum payment level of exactly 8.5%. This quirk is a hangover from the first year of localisation, when central government provided temporary additional funding for LAs with a minimum payment of no more than 8.5%, and 100 councils chose a minimum payment of exactly that level. That incentive expired 5 years ago, but many councils have kept an 8.5% minimum payment, while a few have even chosen that level after the incentive expired. Those LAs that do have an 8.5% minimum payment are mostly clustered together in a few areas such as Derbyshire, Dorset and East Anglia.
The continued prevalence of 8.5% minimum payments shows that there is considerable inertia in councils’ decision-making: many councils simply keep the scheme they had last year, and so temporary incentives can have long-lasting impacts. But the pattern also suggests that another important factor is what other councils – and especially their neighbours – are doing.
Faced with a bill they wouldn’t have had before, many don’t pay it
To varying degrees, then, LAs have cut support for working-age households. This means households are billed for more council tax, and many households now have a bill to pay when otherwise they wouldn’t have had to pay anything. An important question is whether or not councils have succeeded in collecting the extra tax due. The answer is that, as some predicted, CTS cuts have led to a significant increase in the amount of council tax going uncollected.
Comparing otherwise-similar LAs that chose different CTS schemes, we estimate that councils have only successfully collected around three quarters of the additional council tax billed for as a result of CTS cuts. That leaves a quarter of the additional tax going uncollected, ten times the non-collection rate that is typical for council tax. Because these extra liabilities are small relative to total council tax revenue, this does not have a big impact on the overall council tax collection rate – increasing it from 2.5% to 2.7%. But it does imply that cutting council tax support is of limited effectiveness as a way of raising much-needed additional revenue.
While councils might have hoped that any problems in collection might be temporary – perhaps dissipating after households could adjust to their new bill – this is not what we find. Even five years after a minimum payment is introduced, the share of the extra council tax being successfully collected remains at around three-quarters. Low collection rates would thus seem to be a long-lasting feature of CTS reforms, with collection still significantly below ‘normal’ five years after cuts are first introduced.
By comparing otherwise-similar households living in otherwise-similar LAs that cut CTS by different amounts, we can work out which types of household are most likely to go into arrears when they experience CTS cuts.
Figure 3 shows the relationship between the amount a household loses from CTS cuts and the increase in the probability that the household is in arrears, split between those who would have had no bill to pay without the reform and those who would have had some council tax to pay anyway. Households who would have had to pay part of their council tax even without the cuts are barely more likely to go into arrears if their bill is increased. But households asked to pay council tax when, without the cuts, they would have had nothing to pay see a much bigger increase in their chance of being in arrears. And this is true whether this council tax bill is big or small – households are almost as likely to go into arrears if they are asked to pay £100 a year as if they are asked to pay £300.
Figure 3: Estimated effect of losing CTS on probability of arrears, split by whether household would have had a bill to pay in the absence of cuts
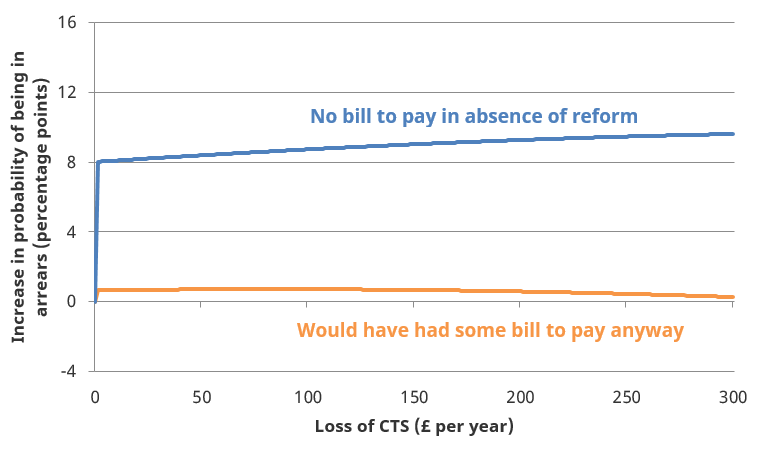
These households required to pay council tax as a result of the reform, while much more likely to be in council tax arrears, are no more likely to be in arrears on other bills. This is despite the fact that the relatively tough enforcement and penalties for non-payment of council tax mean that it would usually make more sense for households to pay the council tax and (if necessary) go into arrears on another bill instead. This further suggests that the problem for households is not simply one of adjusting their budgets to pay an extra £1 or £2 a week. Rather, faced with a council tax bill they would not otherwise have had to pay, many households simply do not pay it – irrespective of its size.
This experience of persistently low collection rates for the extra council tax generated by CTS cuts, driven by high non-payment of newly generated bills, suggests that going forwards LAs might find it easier to collect additional revenue by increasing the size of existing bills than by generating entirely new ones. That is important for the design of their CTS schemes, but may also affect whether they choose to raise revenue by cutting the generosity of CTS or by increasing council tax rates across the board – an option that has been restricted for much of the period since 2013.
This article first appeared in IRRV Benefit magazine and is reproduced here with full permission.
Authors

Stuart Adam
Stuart is a Senior Economist working in the Tax sector, and focuses on analysing the design of the tax and benefit system.

Robert Joyce
Robert is a Deputy Director. His work focuses on primarily on the labour market, income and wealth inequality, and the design of the welfare system.

Thomas Pope
More from IFS
Understand this issue


Policy analysis


Academic research


