The last comprehensive review of the local government finance system took place more than a decade ago.
Since then, we’ve seen substantial cuts to funding, the introduction and planned expansion of the business rates retention scheme, and changes in the responsibilities devolved to councils.
The fair funding review is aimed at updating and improving the system for allocating resources between councils given this changed environment. A key part of this – perhaps the area the government has focused most on – is developing new assessments of councils’ relative spending needs for different services.
But assessing spending need is not easy, mainly because there’s no objective answer to the question: “What do councils need to spend?”
A council with a larger population will need to spend more than a council with a smaller one. Likewise, a council with more deprivation will likely need to spend more on services like social care than a privileged counterpart.
But how much more? How can we get from agreement on the factors affecting spending needs to weights for those factors?
The government says it wants to employ evidence-based, data-driven approaches. For environmental, protective and cultural services this will mean estimating the statistical relationships between councils’ spending and some of their characteristics, termed ‘needs indicators’.
The idea is that these relationships will reflect needs indicators’ impact on spending needs.
This approach is certainly better than just using each council’s spending as an indicator of its need. It’s also less reliant on ministerial judgment than spending needs formulas based on that alone. But this approach still requires the careful exercise of judgment – and suffers from several weaknesses.
For instance, decisions must be taken on what needs indicators to include in the spending needs formulas. This can matter a lot, especially for councils with unusual socio-economic characteristics.
Take Westminster. In our recent analysis changing which needs indicators are included in the estimated spending needs formula leads to the assessed spending need per person for environmental, protective and cultural services varying from 16% below to 61% above the national average.
Moreover, one cannot work out whether an indicator should be included in the formula just by looking at its statistical significance in explaining spending patterns.
Many things other than spending needs can affect spending patterns: variation in local preferences, local efficiency and funding provided by central government. Statistical relationships can pick up these, so judgment must decide whether an indicator reflects variation in needs or in other factors – the latter potentially biasing needs assessments.
Judgment is also important when it comes to choosing which years of data to estimate the statistical relationships from, a question more pertinent given recent funding cuts.
While all councils have seen funding cuts, deprived councils, on average, saw larger cuts than their privileged counterparts. A needs formula based on recent spending patterns would weight deprivation lower and allocate relatively less money to deprived councils than one based on spending patterns from before the cuts.
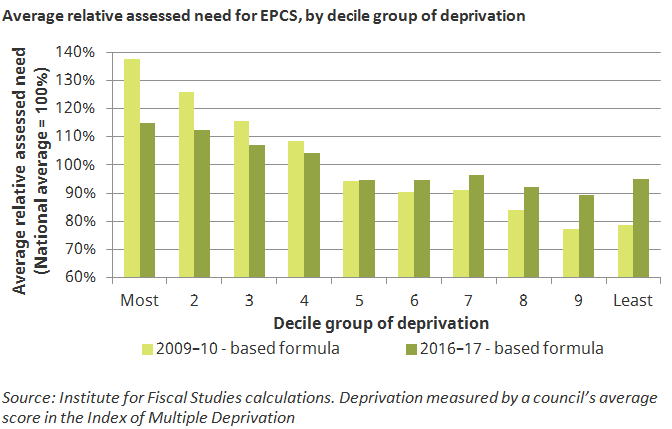
This is illustrated in the figure below. It shows the average assessed spending need per person for environmental, protective and cultural services using formulas constructed using pre-cuts (2009-10) and post-cuts (2016-17) data by councils’ deprivation level.
The most deprived councils having higher assessed needs under the 2009-10 formula compared to the 2016-17 formula, and vice versa for the least deprived councils. For the most deprived tenth of councils, the 2009-10 formula would assess spending needs to be 38% above the national average, compared to just 15% in the 2016-17 formula.
It would seem odd to use data from almost ten years ago to estimate a new spending needs formula. But it’s important to realise that using the most recent data isn’t really any more objective.
The question becomes when you think the distribution of funding between councils was fairer.
Have years of bigger cuts for more deprived councils unfairly penalised them, or addressed unfairly high relative funding that previously existed? These are inherently subjective – even political – decisions.
The risk with different baskets of indicators and years of data leading to different outcomes is that each council simply lobbies for choices that benefit them irrespective of their broader merits.
To head off this risk, the government has focused first on achieving approval on the principles guiding the updated needs assessments, and on the type of indicators to include in the new spending needs formulas. It has yet to release figures on how different options could affect different councils.
This is probably a good strategy. It recognises the role judgment has to play, but tries to avoid those judgments being distorted by everyone focusing on the effects different options will have on their own council.
At some stage though, the government will have to produce such impact assessments. These will show clearly the winners and losers from different options. At that stage, things could get more fraught.
Will councils, in effect, turn on each other and try to swing ministerial judgment towards options that benefit their council? Will they focus their energies on trying to extract additional funding from ministers, so that the funding pie can be made bigger as well as re-sliced?
These are big questions of judgement for councils – and ministers – indeed.
Tom Harris is a Research Officer and David Phillips is Associate Directorat the IFS. This article was originally published by the Local Government Chronicle and is reproduced here with permission.
Authors

David Phillips
David is Head of Devolved and Local Government Finance. He also works on tax in developing countries as part of our TaxDev centre.

Tom Harris
More from IFS
Understand this issue


Policy analysis


Academic research


