Downloads
R141.pdf
PDF | 849.22 KB
Recent years have seen big changes to the local government finance system. These include the ending of annual spending needs assessments and the introduction of the business rates retention scheme (BRRS) in 2013–14. This scheme has allowed councils to retain up to 50% of the real-terms growth in local business rates revenues and bear up to 50% of any real-terms falls. The government has announced plans to increase this share to 75% by 2020–21 and continues to expand a series of pilots of 100% retention in certain (volunteer) areas. The aim of these reforms is to provide stronger financial incentives for councils to boost local economies and tackle the underlying drivers of spending need. However, the flip side of these stronger incentives is a greater potential for councils’ revenues to diverge from their spending needs.
How big could these divergences be? Since we do not know how revenues and needs will evolve in future, in this report we look at how local tax revenue-raising capacity and assessed spending needs varied and changed between 2006–07 and 2013–14, the most recent years for which data on both are available. We then model how the relative levels of funding for different councils could have evolved under different versions of 100% business rates retention if such systems had been in place during this period. This allows us to get a sense of the potential scale of the divergences between councils’ revenues and their assessed needs that could open up over the medium term, and how this is affected by the design of the BRRS.
This report shows that significant divergences could arise in just a few years under 100% rates retention. This is because those councils which would have seen the biggest increases in their retained business rates revenues were often not the councils that experienced the biggest increases in their relative spending needs, for example, because their population became older, poorer or sicker. This implies that central and local government face a difficult trade off when moving to 75% or 100% rates retention. More frequent and fuller periodic redistributions of revenues could limit the scale of funding divergences. But they would also dampen the incentives for councils to grow revenues and tackle spending needs.
It is also not clear that the incentives provided by rates retention will translate into faster economic growth. The report finds no relationship between changes in the councils’ business rates tax bases and local economic growth, or indeed employment or earnings growth, in recent years. However, there is a link between changes in the value of business properties when they are re-valued (as in April 2017) and local economic growth. Most of the impact of these valuation changes is stripped out from the revenues actually retained by councils though, meaning little incentive for councils to boost local business property values.
The revenues and spending needs data also show that:
• Between 2006–07 and 2013–14, the assessed spending needs of different councils converged. In other words council areas became more alike in terms of how much money they were thought to need to provide similar levels of service. Deprivation became less concentrated in areas that were initially the poorest. At the same time the population aged more rapidly in those, generally richer, areas initially assessed to have lower needs. This latter trend is likely to have continued since then and to persist in the future.
• Changes in councils’ capacity to raise revenues from council tax and business rates varied significantly across England. After stripping out the overnight impact of the business rates revaluation on revenues – as happens under the business rates retention scheme – around one-in-ten council areas saw their tax raising capacity increase by 13% or less. Another one-in-ten saw it increase by 30% or more.
The report also shows how in shire areas where local government is split into two tiers – shire districts and counties – the way changes in business rates revenues are shared between these tiers can have a big impact on the scale of funding divergences:
• Shire district councils cover relatively small areas and their other revenues are relatively low. This means that divergences between their funding levels and assessed spending needs can grow very large when they bear a large part of the change in local business rates revenues. This is the case currently where they bear four-fifths of the 50% of revenue change retained locally.
• If this four-fifths allocation were maintained under a 100% retention scheme then divergences could grow very rapidly. Had such a scheme been in place between 2006-07 and 2013-14, then by the end of this period the quarter of districts doing worst would have had funding that was at least 13% lower relative to their spending needs than the quarter doing best.
• A natural response would be to increase the proportion of business rates changes borne by county councils which are bigger and could bear more change without so much divergence. This would also provide counties with stronger incentives to boost these revenues for example through education and skills, transport and strategic planning for which they are responsible. Districts, however, control most local planning decisions and their incentives would be weaker.
• If, as has historically been the case, business rates revenues grow in real-terms, allocating a higher share of this growth to counties would provide more resources for services counties have responsibility for, including social care and children’s services. However it would not, on its own, solve funding issues for these areas of spending.
Figure. Distribution of relative funding ratios (2006–07 to 2013–14) under baseline100% BRRS scenario
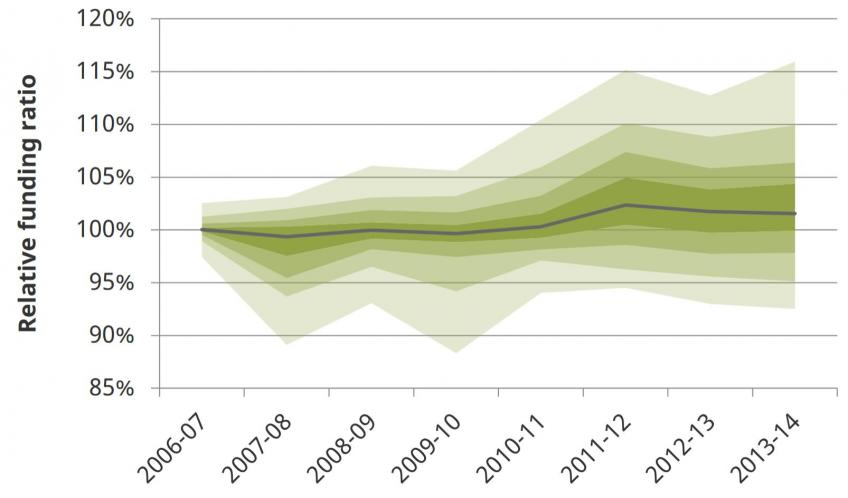
Note: Excludes City of London and Isles of Scilly. The grey line shows the median, and each ‘fan’ away from that line shows a decile away. The very top of the shaded area thus shows where the 90th percentile of the distribution is in each year, and the very bottom shows the 10th percentile.
Authors

David Phillips
David is Head of Devolved and Local Government Finance. He also works on tax in developing countries as part of our TaxDev centre.

Polly Simpson
Neil Amin Smith
More from IFS
Understand this issue


Policy analysis


Academic research


