When a Chancellor delivers his Budget, the question people naturally ask is ‘why does this matter for me’. Often that means looking out for the newly announced tax and spending measures. For some, the policy measures announced in November, for example, the removal of stamp duty land tax (SDLT) for most first-time house buyers, or another year of fuel duties being frozen in cash terms, will be fairly significant.
However, for most it will have been the new economic forecasts, considerably more pessimistic than at the March Budget, that will have the largest material impact. These forecasts downgraded the outlook for productivity, the main driver of economic growth, over the next few years. Slower productivity growth means, on average, slower wage growth, which in turn depresses government revenues.
If correct, these forecasts imply median wages – the wage of the person for whom half of workers earn more and half less – still below their pre-crisis (inflation-adjusted) level in 2022–23. Fifteen years without a pay rise is virtually unprecedented in recent (and not-so-recent) history, and is certainly a far worse outcome than would have been reasonably expected at the start of 2008, or even in 2010.
Lower productivity
For this median worker, the economic downgrade from March to November reduced forecast annual earnings in 2021 by £650 (from £24,150 to £23,500 in today’s prices). This is a substantial sum and has a more significant effect than even many large tax changes would have. While we focus on the median earner to put changes into perspective, lower productivity affects earnings, on average, across the whole range: for example, the national living wage for those aged 22 and over is set to rise to 60% of median wages by 2020, with a lower median wage implying a lower national living wage. The effect of the downgrade is to reduce average earnings by around 2.7% in 2021 compared with previous forecasts.
Average changes to wages do not mean everyone will be affected. For some the change may be more severe while others may escape unscathed. However, even if the change to the Budget forecast does not affect how you expect your own pay to grow over the next few years, the forecast change may still affect you indirectly. Slower economic growth means depressed tax receipts, which in turn pushes up government borrowing.
The economic downgrade in November caused the forecast for government borrowing in 2021-22 to increase by £15bn (around 0.7% of national income). Given the government’s commitment to eliminate the deficit entirely by the mid-2020s, this means a further saving of around £15bn per year, through further tax increases or yet more spending cuts, must be found within the next decade.
The government has not yet specified what these further deficit-reducing measures will be. However, in the Budget the Chancellor Philip Hammond did announce that departmental spending will be squeezed for at least one extra year (2022-23), on top of the 12 years of austerity planned up to that point. Lower spending on public services is likely to affect the quantity and/or quality of those services. If the government were also to increase taxes, or to cut social security benefits, in order to eliminate the deficit, this would reduce the incomes of some households.
Deficit elimination
Even if the government were to abandon its deficit-elimination target, the higher borrowing as a result of slower economic growth would not be cost free. It would mean a higher level of government debt, meaning a higher cost of servicing that debt going forwards, leaving less revenue for spending on other services or social security payments. Regardless of your personal financial situation, therefore, slower economic growth matters. It means that the government can afford to do less, which may mean higher taxes or lower government spending, both of which affect the majority of the population.
Of course, forecasts can be wrong. It may be that the official forecasts made at the time of the March Budget turn out to be more accurate than the subsequent November revision. In that case, the outlook for wages and the public finances would be at least somewhat rosier. Importantly, a big change in prospects for economic growth often affects people far more significantly than even substantial policy changes. For that reason, we should all hope that the latest forecasts are unduly pessimistic. But we should also plan on the basis that they could, like recent previous forecasts, turn out to have been overly optimistic.
Figure 1. Productivity growth forecasts
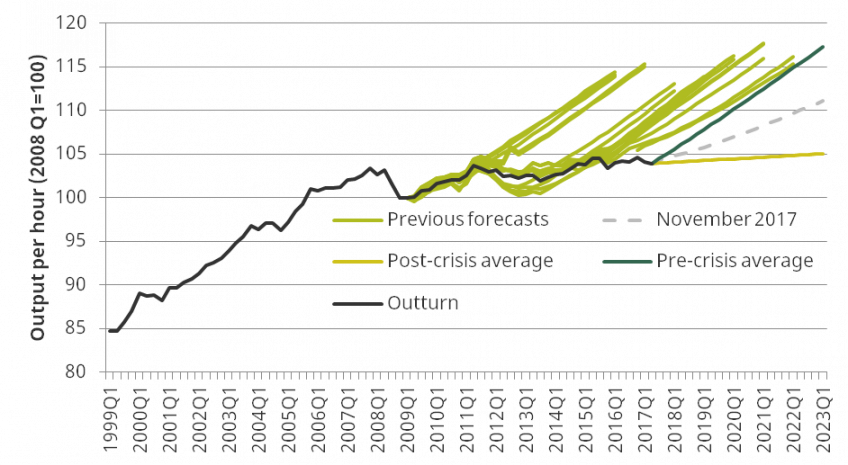
Source: Office for Budget Responsibility (OBR)
Figure 1 shows successive forecasts for output per hour (productivity) growth since the Office for Budget Responsibility (OBR) began making forecasts in 2010. Until November, the forecasts persistently predicted a return to the productivity growth rate experienced in the forty years leading up to the financial crisis. Over that period, productivity growth had consistently exceeded 2% per year. However, since 2008 productivity has remained virtually flat. In the Autumn Budget, the OBR downgraded its outlook for productivity growth – they no longer expect productivity growth to return to pre-crisis rates, at least not in the next five years. This makes it a more pessimistic economic forecast than any of the 16 the OBR had produced since its inception in 2010. However, as the chart shows it still projects productivity growth well above the average rate since 2010, suggesting it is possible that even this forecast will not prove to be pessimistic enough.
Figure 2. Forecast paths for median earnings, £ per annum
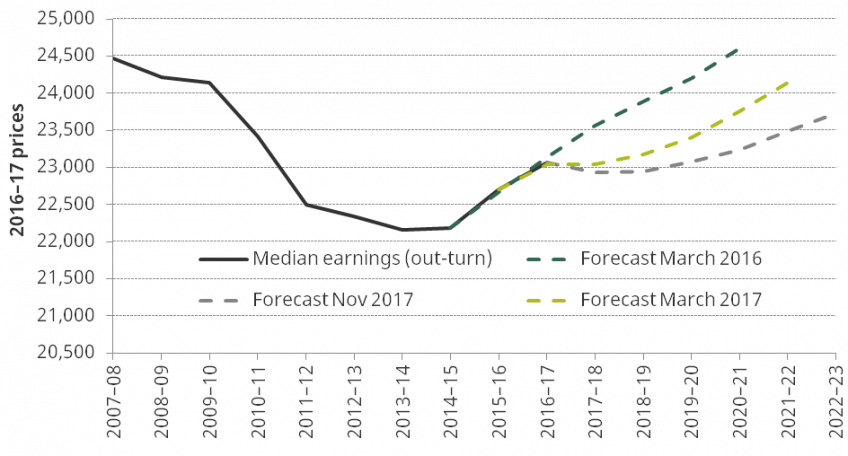
Source: OBR, Annual Survey of Hours and Earnings (ASHE), IFS calculations.
Note: Median earnings refers to the annual earnings of the person for whom half of workers earn more and half less.
Figure 2 shows that, based on the latest forecasts, median earnings will still be below 2007–08 levels in 2022–23 in real terms. Real earnings are due to increase over the next five years, but these sluggish increases are forecast to be insufficient to outweigh the large falls between 2007–08 and 2013–14. This outlook is much changed since March 2016. Since then, there have been two large downwards revisions to the economic forecasts: first in the aftermath of the vote to leave the European Union, and more recently in the 2017 Autumn Budget. Whereas in March 2016 earnings were due to reach the 2007–08 level by 2020–21, the latest forecasts suggest median earnings in that year will now be more than £1,350, or 5.6%, lower.
This article was first published on Accountancy Live and is reproduced here in full with permission. Thomas Pope is a research economist at the Institute for Fiscal Studies.
Authors

Thomas Pope
More from IFS
Understand this issue


Policy analysis


Academic research


