Health is a devolved matter: the UK government decides how to organise healthcare services in England and how much to spend on them, while healthcare in Wales is organised by the Welsh Government, which decides how much of the block grant given to it by Westminster to allocate to health, and how much to allocate to other services. Social care services are devolved to local authorities in both England and Wales and are funded by a mix of grants from central government and revenue raised locally (via, for instance, council tax).
Recent months have seen significant debate about the relative performance of – and the relative funding for – the health services of England and Wales. The Prime Minister has repeatedly raised the issue in the House of Commons, and recently claimed that while health spending had increased in England, that the health budget in Wales had been cut by 8%. The Welsh Government has disputed this figure, arguing that it has protected social services spending in a way England has not done.
In this Observation, we assess the empirical evidence on what has happened to health and social services spending in England and Wales since 2010–11. We find that the relative degree of protection offered to these services does differ between the two countries.
Health and social care spending in England and Wales: 2010–11 to 2014–15
Table 1 shows how much the UK government spent on healthcare in England and the Welsh government spent on healthcare in Wales in real-terms in 2010–11, and how much they plan to spend in the current financial year, 2014–15. It also shows how much local authorities spent (or plan to spend) on social services in England and Wales in the same years. All figures refer to resource expenditure – spending on the day-to-day provision of services – and exclude capital expenditure. (We exclude capital expenditure as figures are not available on a consistent basis for social services capital expenditure for England and Wales).
Table 1. Health and social services resource spending in England and Wales, £ billion (2015–16 prices)
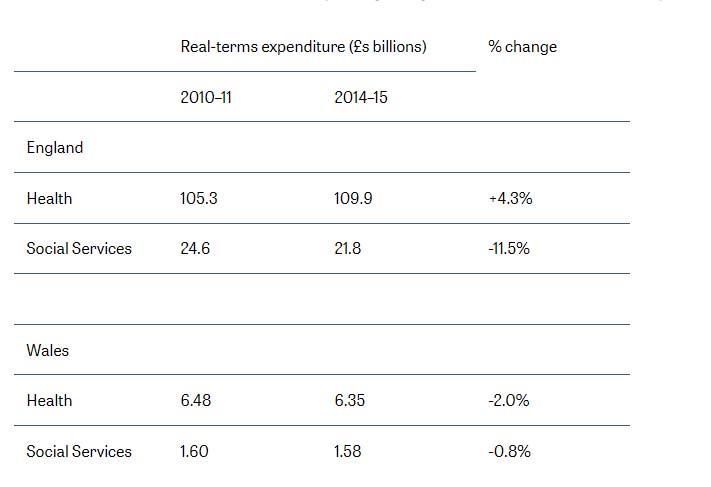
Sources: English health spending is taken from PESA 2014, Table 1, as item “NHS (health)”. English social services spending is taken from local government revenue expenditure outturns and budgets, and is adjusted for changes in classification of social services spending, such as including in 2010–11 spending then funded via the Department of Health but now part of the regular social services budget, and transfers between the Education and Social Services components of local government spending. Welsh health spending is taken from the Welsh Government’s second supplementary budgets for 2010–11 and 2014–15, and excludes spending on the drugs misuse strategy. Welsh social services spending is taken from local government revenue expenditure outturns and budgets, and is adjusted for shifts between the education and social services portfolios. Full details are available from the author on request.
Notes: Percentage changes are calculated using unrounded numbers
The figures show that while spending on health services in England has increased by 4.3%, spending on health services in Wales has been reduced by 2.0%. Turning to social services spending, a different pattern is found. While spending in Wales has been cut by just 0.8%, spending in England has been reduced by 11.5%.
These patterns reflect the differing decisions of the Welsh and UK governments, and of local authorities in the two countries. They illustrate the trade-offs involved when trying to protect particular services from budget cuts. In the case of England, the UK government’s real-terms increases for the health budget have meant that cuts to other “unprotected” departments need to be larger. One of those unprotected departments facing larger cuts has been the Department for Communities and Local Government which provides grants to local authorities in England. Significant cuts in these grants, and the widespread freezes to council tax in England, have led to a substantial reduction in the spending power of councils and may have made it harder for local authorities to protect social services spending. In contrast, the somewhat lesser protection given to health by the Welsh Government has allowed smaller cuts to other areas, like grants to Welsh local authorities. Alongside council tax rises, this may have made it relatively easier for Welsh local authorities to protect social service spending.
It is worth noting that these differences largely reflect decisions taken in the first couple of years of the cuts: 2011–12 and 2012–13. During this period, the Welsh Government cut the resource budget for health by 3.5%, perhaps seeking to avoid the large cuts to unprotected services that protection of health spending in England had required. Starting in 2013–14, however, the Welsh Government changed tack, and has found additional money for health by cutting more deeply elsewhere. This has partially (but not fully) reversed the earlier cuts to health spending.
It is also worth asking whether there is a reason why the Prime Minister claimed health spending in Wales was being cut by 8% when we have calculated the cuts to be 2%.
The main reason seems to be that when the Prime Minister’s claim was made (on 7 January), the Welsh Government had yet to publish its second supplementary budget for 2014–15. In its first supplementary budget (then, the most up-to-date budget available), the Welsh Government had not allocated all its money for the year. It always keeps some back to be allocated in the second supplementary budget, and for several years at least, much of that money has then been allocated to health. The first supplementary budget showed a resource budget for health in 2014–15 that would have been 5.9% lower than in 2010–11, and an overall budget including capital spending 7.7% lower than in 2010–11 (a figure very close to the 8% cut claimed by the Prime Minister). Since then, the additional £250 million of resource funding allocated to health in the second supplementary budget has reduced the scale of the cut to resource spending to the 2.0% reported in Table 1 (and together with an extra £15 million of capital funding, reduced the cut to the overall budget including capital spending to 3.9%).
Conclusion
Devolution means that the Welsh Government has freedom to decide how to allocate the block grant it gets from Westminster across different service areas. Since 2010–11 the Welsh Government has used these powers to allocate cuts across services in a different way to the UK government in England. In particular, the Welsh Government has offered less protection to the health budget than is the case in England. But this has meant smaller cuts to other areas of government spending in Wales than in England. One such area is social services.
Authors

David Phillips
David is Head of Devolved and Local Government Finance. He also works on tax in developing countries as part of our TaxDev centre.
More from IFS
Understand this issue


Policy analysis


Academic research


