Over the course of this parliament, the government have made changes to benefits and tax credits that, at the time they were announced, were expected to reduce spending in 2014–15 by £19 billion relative to a world of no policy change. In fact, real spending (after adjusting for CPI inflation) will be only £2.5 billion lower in 2014–15 than it was in 2010–11. This observation explains why.
If we adjust for prices using the CPI, the move from RPI to CPI for uprating benefits (expected to save over £4 billion in 2014–15) did not bring about a cut in spending over time – rather it meant benefits were no longer expected to increase in real terms. So we’re left with around £15 billion of cuts to explain, compared to an actual fall in real terms spending of around £2.5 billion.
Over a third of the remaining £12.5 billion gap is down to higher spending on pensioner benefits. Combined spending on state pensions, pension credit, and universal pensioner benefits such as the winter fuel payment will be £5 billion higher in 2014–15 than in 2010–11. All of that increase is explained by the rising cost of state pensions. To some extent this reflects an ageing population, with the number getting the state pension up 400,000 over the period. But it is mostly the result of higher spending per pensioner, with each recipient getting nearly £500 a year more on average. This was, for the most part, planned – as each new cohort of pensioners retire, they benefit from past decisions giving them more generous entitlements than previous generations.
Once we strip out pensioner benefits, we’re left with around £7.5 billion of extra spending to explain. In order to help with that task, Table 1 shows real terms spending on major working-age benefits in 2010–11 and 2014–15, alongside announced cuts (excluding the move from RPI to CPI indexation).
Table 1. Changes in spending and announced cuts for some major working-age benefits
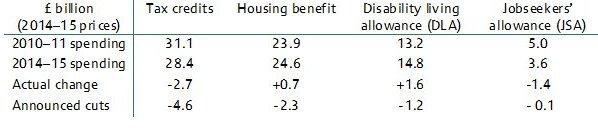
Notes: Spending figures adjusted for CPI inflation. Spending on employment and support allowance not shown as cuts announced by previous government. Disability living allowance figures include personal independence payment. Cut to JSA is from 1% uprating and is approximate.
Source: Department for Work and Pensions benefit expenditure tables, Office for Budget Responsibility policy measures database.
The first thing to draw from the table is that there is actually more than £7.5 billion of extra spending to explain, once you take account of the fact that spending on JSA has fallen by around £1.3 billion as a result of lower unemployment.
Housing benefit explains £3 billion of the extra spending. Despite announced cuts of over £2 billion, real terms housing benefit spending will be nearly £1 billion higher in 2014–15 than 2010–11. This was unanticipated – the OBR’s welfare trends report shows expected spending in 2014–15 has risen by nearly £3 billion since their June 2010 forecast. As they explain, the private rented sector has grown faster than expected, private rents have grown faster than expected, and earnings have grown more slowly than expected – all of which increase housing benefit spending. That slower-than-expected earnings growth also increases tax credit spending. Government cuts to tax credits total £4.6 billion, but spending in 2014–15 is expected to be down less than £3 billion on its 2010–11 level.
It’s not all about macroeconomic conditions though. The difference between the £1.2 billion cut to DLA spending that was announced and the £1.6 billion increase in spending that is now expected reflects the significant delays to the government’s replacement of DLA with the less generous personal independence payment. And although the introduction of employment and support allowance is not included in the £19 billion of cuts (since it was announced by the previous government), it too has saved much less than expected (for reasons discussed here).
All this has important fiscal consequences. Working-age benefit spending has always been sensitive to the unemployment rate. But the rapid growth of housing benefit and tax credits over the couple of decades (documented in this briefing note published today) means that slow earnings growth now has the potential to push up spending too. Much of the hoped-for savings from the introduction of ESA have failed to materialise, and it is an open question whether the personal independence payment will be any different. Mr Osborne wants further cuts to social security spending to help reduce the deficit. He may end up having to make cuts just to stay on track.
Note: The DWP benefit expenditure tables adjust spending figures for economy-wide inflation (as measured by the GDP deflator) – in those terms spending is expected to be £5 billion higher in 2014–15 than 2010–11.
Authors

Andrew Hood
More from IFS
Understand this issue


Policy analysis


Academic research


