Downloads
R138%20-%20Problem%20debt.pdf
PDF | 1.44 MB
In recent years, the debt holdings of households in Great Britain have been a subject of attention and concern amongst policymakers and the general public. In particular, there has been heightened awareness of unsecured household debt or ‘consumer credit’ such as credit card debt, hire purchase agreements and unsecured loans.
One aspect of the concern around unsecured debt is that keeping up with repayments on these debts may place significant financial and psychological burdens on households. Requirements to make large repayments could have effects on households’ ability to purchase other essential items, with immediate impacts on the well-being of members of the household. Extended periods when income is being used to make debt payments may mean that households cannot make important investments, with knock-on consequences for future life prospects.
Yet households can hold debt for good reasons. Credit cards and loans can be used to meet unexpected costs or to smooth over periods when income is temporarily low. Hire purchase and leasing agreements may enable a household to access a durable good, such as a car, sooner than would otherwise be the case. Such decisions may be perfectly reasonable, and indeed actually beneficial to a household whose income in future will allow it to meet debt repayments without getting into problems.
It is therefore crucial to distinguish between the occasions when debt is a problem and those when it is not. To do this, we need to go beyond aggregate figures about debt holdings and look at individual households’ situations and the circumstances in which debt is taken on and paid off. In this report, we set up and examine metrics that bring together different aspects of households’ situations to capture better when debt may be problematic. Understanding the nature and evolution of cases where debt can lead to problems will increase our understanding of why this can happen and so inform responses which seek to alleviate or prevent ’problem debt’.
In this report, we aim to build on a range of previous research into ‘problem debt’. We do this using the Office for National Statistics (ONS)’s Wealth and Assets Survey (WAS), which interviews a representative sample of Great British households on a rolling two-year basis, such that each household is re-interviewed biennially where possible. We focus on the objective characteristics of households and their financial situations. This should be seen as complementary to analyses that draw on households’ subjective experiences of holding debt as well or instead, such as Department for Work and Pensions (2017).
Key findings:
Unsecured household debt in Great Britain
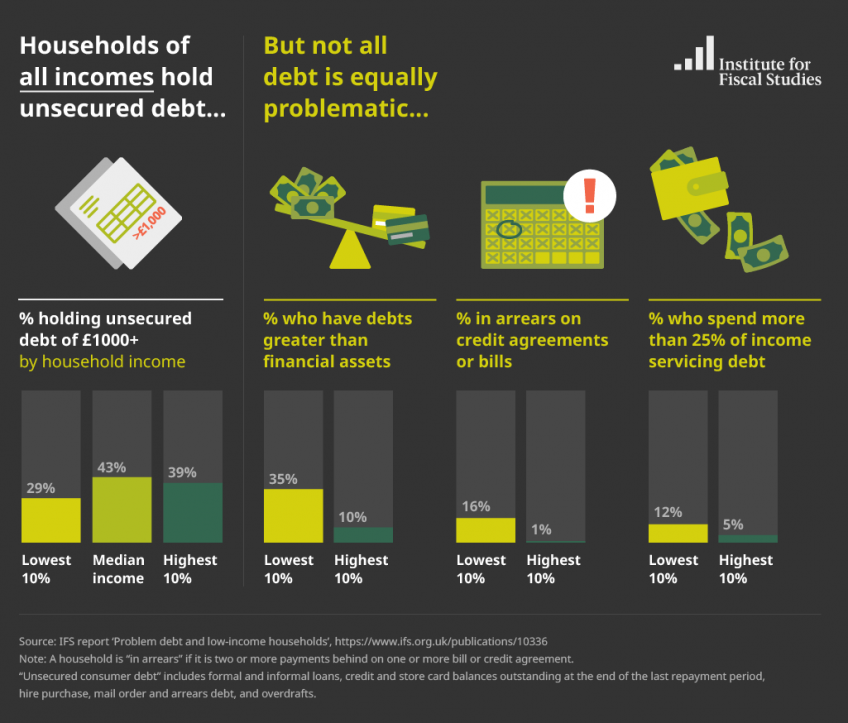
Around half of households in Great Britain in 2012–14 had some unsecured consumer debt, with 10% of households holding over £10,000 of such debt. Almost half of this kind of debt is from formal loans (43%), with credit and store card debt (25%) and hire purchase debt (21%) the next most significant categories.
Those with lower incomes are less likely to hold any unsecured debt, but are more likely to be in ‘net debt’, with unsecured debts of greater value than their financial assets. 35% of those in the lowest income decile have debts of greater value than their financial assets. This compares with 10% in the highest income decile.
Those who held debt in 2012–14 were likely to have held debt for a number of years. More than half of those who had debts when interviewed in 2012–14 had debts on all four occasions they were interviewed (spanning a period of six years).
While debts can be a sign that a household is struggling to manage its finances, they can also be an appropriate and manageable response to negative shocks or an anticipated income rise. It is important for policymakers looking to address ‘problem debt’ to distinguish between these different possibilities, based in part on the wider economic circumstances of households.
The immediate term: ‘debt servicing pressure’
The proportion of individuals spending more than a quarter of their income on servicing unsecured debts is relatively similar for different income groups. From the second-lowest to the top income decile, the proportion remains between 5% and 7%. The rate is higher in the lowest income decile, at 12%.
Being in arrears on debts or other payment obligations (e.g. utility bills) is highly concentrated amongst the lowest-income households – 16% of those in the lowest income decile are in arrears compared with just 1% of those in the highest decile. As a result, according to a measure of ‘immediate servicing pressure’ defined as spending more than a quarter of current income servicing debts or being in arrears, the proportion of individuals in a household that is under pressure is 25% in the lowest income decile and just 6% in the highest decile.
Low-educated young adults are more likely to face servicing pressure than high-educated young adults due both to higher rates of arrears and to higher costs of servicing their debts. This is despite the fact that the two groups hold similar amounts of unsecured debt relative to income (student loans are not included). Low-educated individuals hold more of their debt as types such as mail order and hire purchase debt, which have faster repayment rates.
Differences in asset holdings provide one important reason to be more concerned about low-income households that face servicing pressure than high-income ones. Of those individuals under immediate servicing pressure, 64% in the lowest income decile had financial assets worth less than half their debts, compared with 29% in the highest income decile.
The dynamics of ‘servicing pressure’
Low-income households are significantly more likely to enter servicing pressure than those with higher incomes. Entry rates fall from 11% in the lowest income quintile to 4% in the highest. This difference is entirely driven by lower-income households being much more likely to fall into arrears.
Those with lower incomes are more likely to get stuck in servicing pressure than those with higher incomes. 44% of those in the bottom income quintile under servicing pressure were still under servicing pressure two years later, compared with 34% of those in the top income quintile. This is driven by the fact that low-income individuals who are in arrears are more likely to be in arrears two years later than those on high incomes.
Entry into servicing pressure is much more likely to be explained by a rise in debt servicing costs than by a fall in income. 58% of those who entered servicing pressure due to their repayment-to-income ratio rising saw their servicing costs rise by at least a quarter of their income. By contrast, only 15% had income falls that were alone sufficient for entry into servicing pressure.
Those remaining under servicing pressure due to persistently high repayments have higher debt-to-income ratios and are more likely to take out additional debt when already under pressure. 27% of those who remained under servicing pressure saw their credit card debt rise by at least a tenth of their income, compared with just 12% of those who left servicing pressure.
The medium term: ‘repayment pressure’
When considering whether unsecured debts might pose problems for a household, it is important to consider not just servicing pressure (which may arise temporarily) but also whether unsecured debts will be a struggle to repay over the medium term. Defining a measure of ‘repayment pressure’, we identify households whose total debt burden, less any financial assets, is greater than 20% of household income. Using this measure, 9% of individuals were in a household under repayment pressure in 2012–14.
As with immediate servicing pressure, it is low-income and younger households that look most likely to struggle to repay their debts over the longer term. The percentage of individuals under repayment pressure (on the measure above) falls from 14% of those aged 20–24 to 1% of those aged 80–84 and from 13% in the lowest income decile to 3% in the highest income decile.
Taking account of the facts that debt will be repaid out of future income, and that incomes tend to grow over time, does tend to make repayments look more manageable for some groups. The debt repayments of younger adults look slightly more manageable once one accounts for the fact that their incomes are expected to increase, but there is almost no impact on repayment pressure among older working-age adults.
Accounting for the fact that some people are only temporarily on low incomes reduces the percentage of low-income households expected to be under repayment pressure. The percentage of individuals in the lowest income decile in a household under repayment pressure falls from 15% to 9% when taking this uncertainty into account. However, doing this makes little difference to the rate of repayment pressure for low-income households with children.
Authors

Robert Joyce
Robert is a Deputy Director. His work focuses on primarily on the labour market, income and wealth inequality, and the design of the welfare system.

Andrew Hood

David Sturrock
David’s research covers household wealth, intergenerational transfers, social mobility, pensions taxation, and health and work at older ages.
More from IFS
Understand this issue


Policy analysis


Academic research


